$ES_F (daily) chopping along the channel resistance all week. Momentum slowing down with spinning top daily candle friday which indicates indecision and potential reversal candle. I remain bearish as long as current channel resistance holds

$SPY (daily) similar channel as $ES_F along with shorter term channel (orange) providing dual resistance.

$SPY 1H head and shoulder consolidation with potential lower high on Friday.

$NQ_F (daily) at dual channel resistance. 3 straight dojis (indecision) followed by a small unconvincing small bodied spinning top candle. High potential for top/reversal

$QQQ (daily) rejected so far at channel resistance with some toppy candles.

$DJI (daily) at upper trendline with momentum looking dry.

$RTY (daily) rejected off the channel backtest and downtrend line

$XLF (weekly) reversal at channel resistance

$XLF (monthly) rejecting at channel resistance

$XLE (weekly) constructive for bears with H&S top at the moment.

Watch the leaders for clues as well:
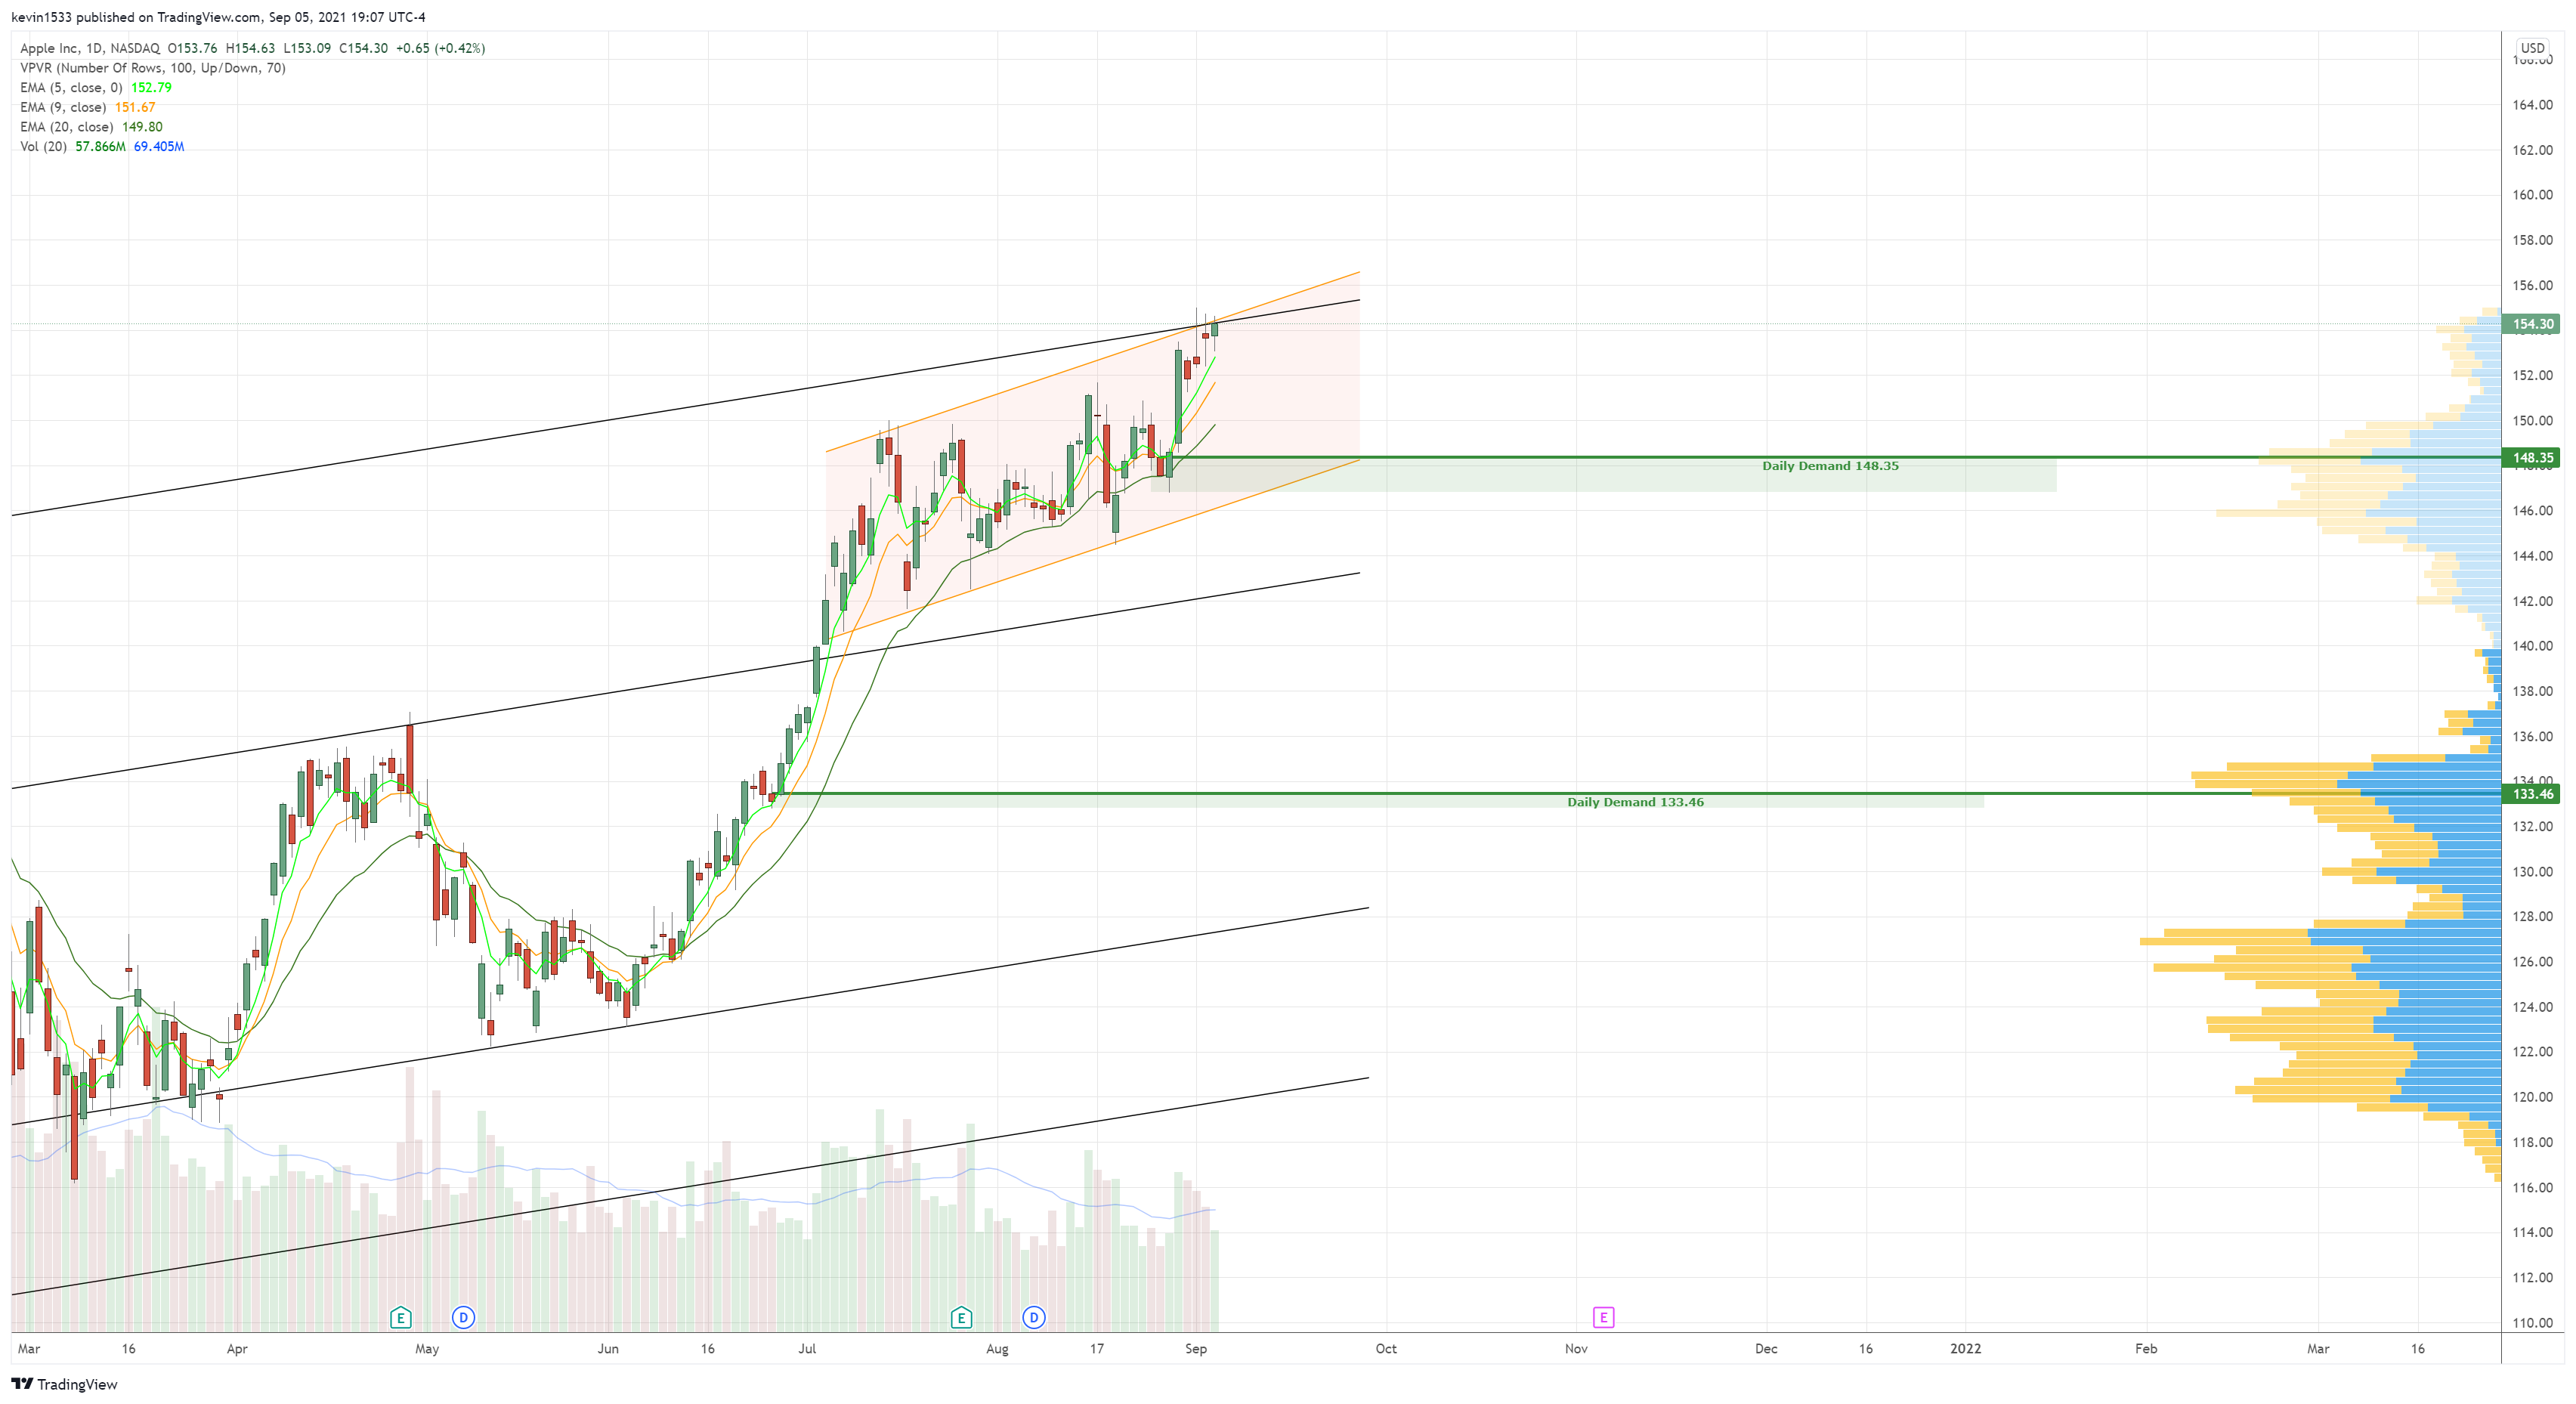
$AAPL (daily) upper trendline and short term channel resistance with double inside bar (indecision/potential reversal)

$FB (weekly) shooting star rejection off trendline from may 2019. Negative RSI divergence

$GOOGL (weekly) spinning top at channel resistance with weekly RSI highest level in history.

$MSFT (weekly) double inside bar at long term channel resistance.

$NFLX (weekly) appears strong and bullish with weekly breakout of major consolidation – but not much volume confirming.
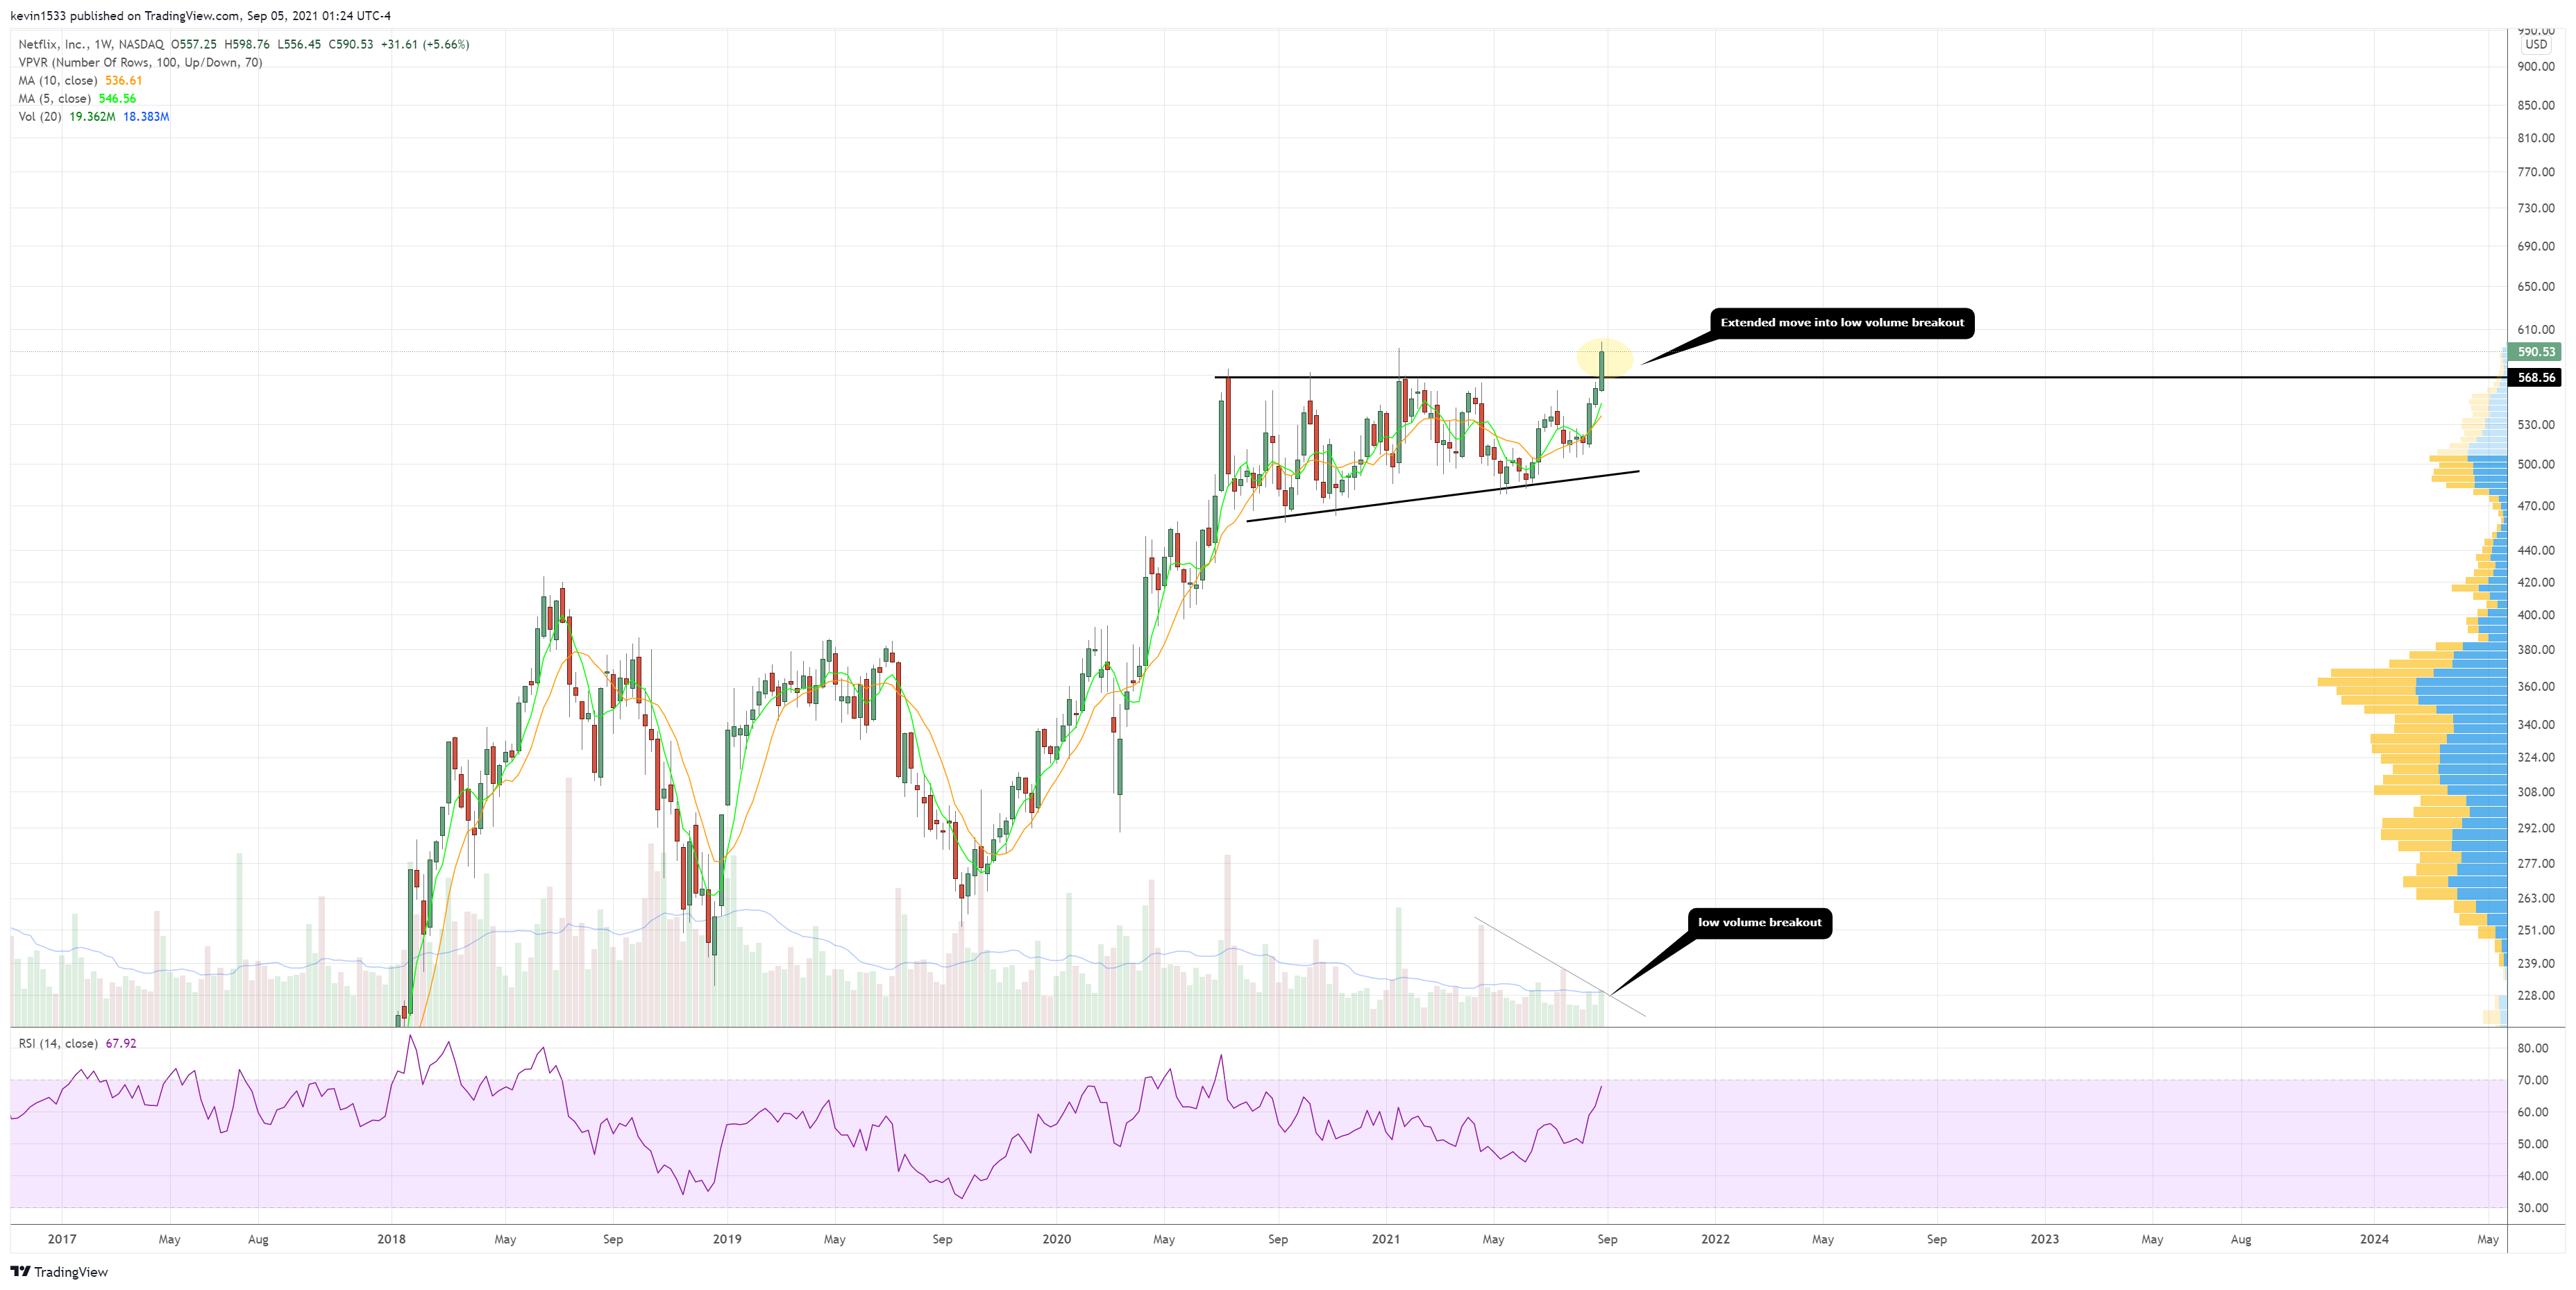
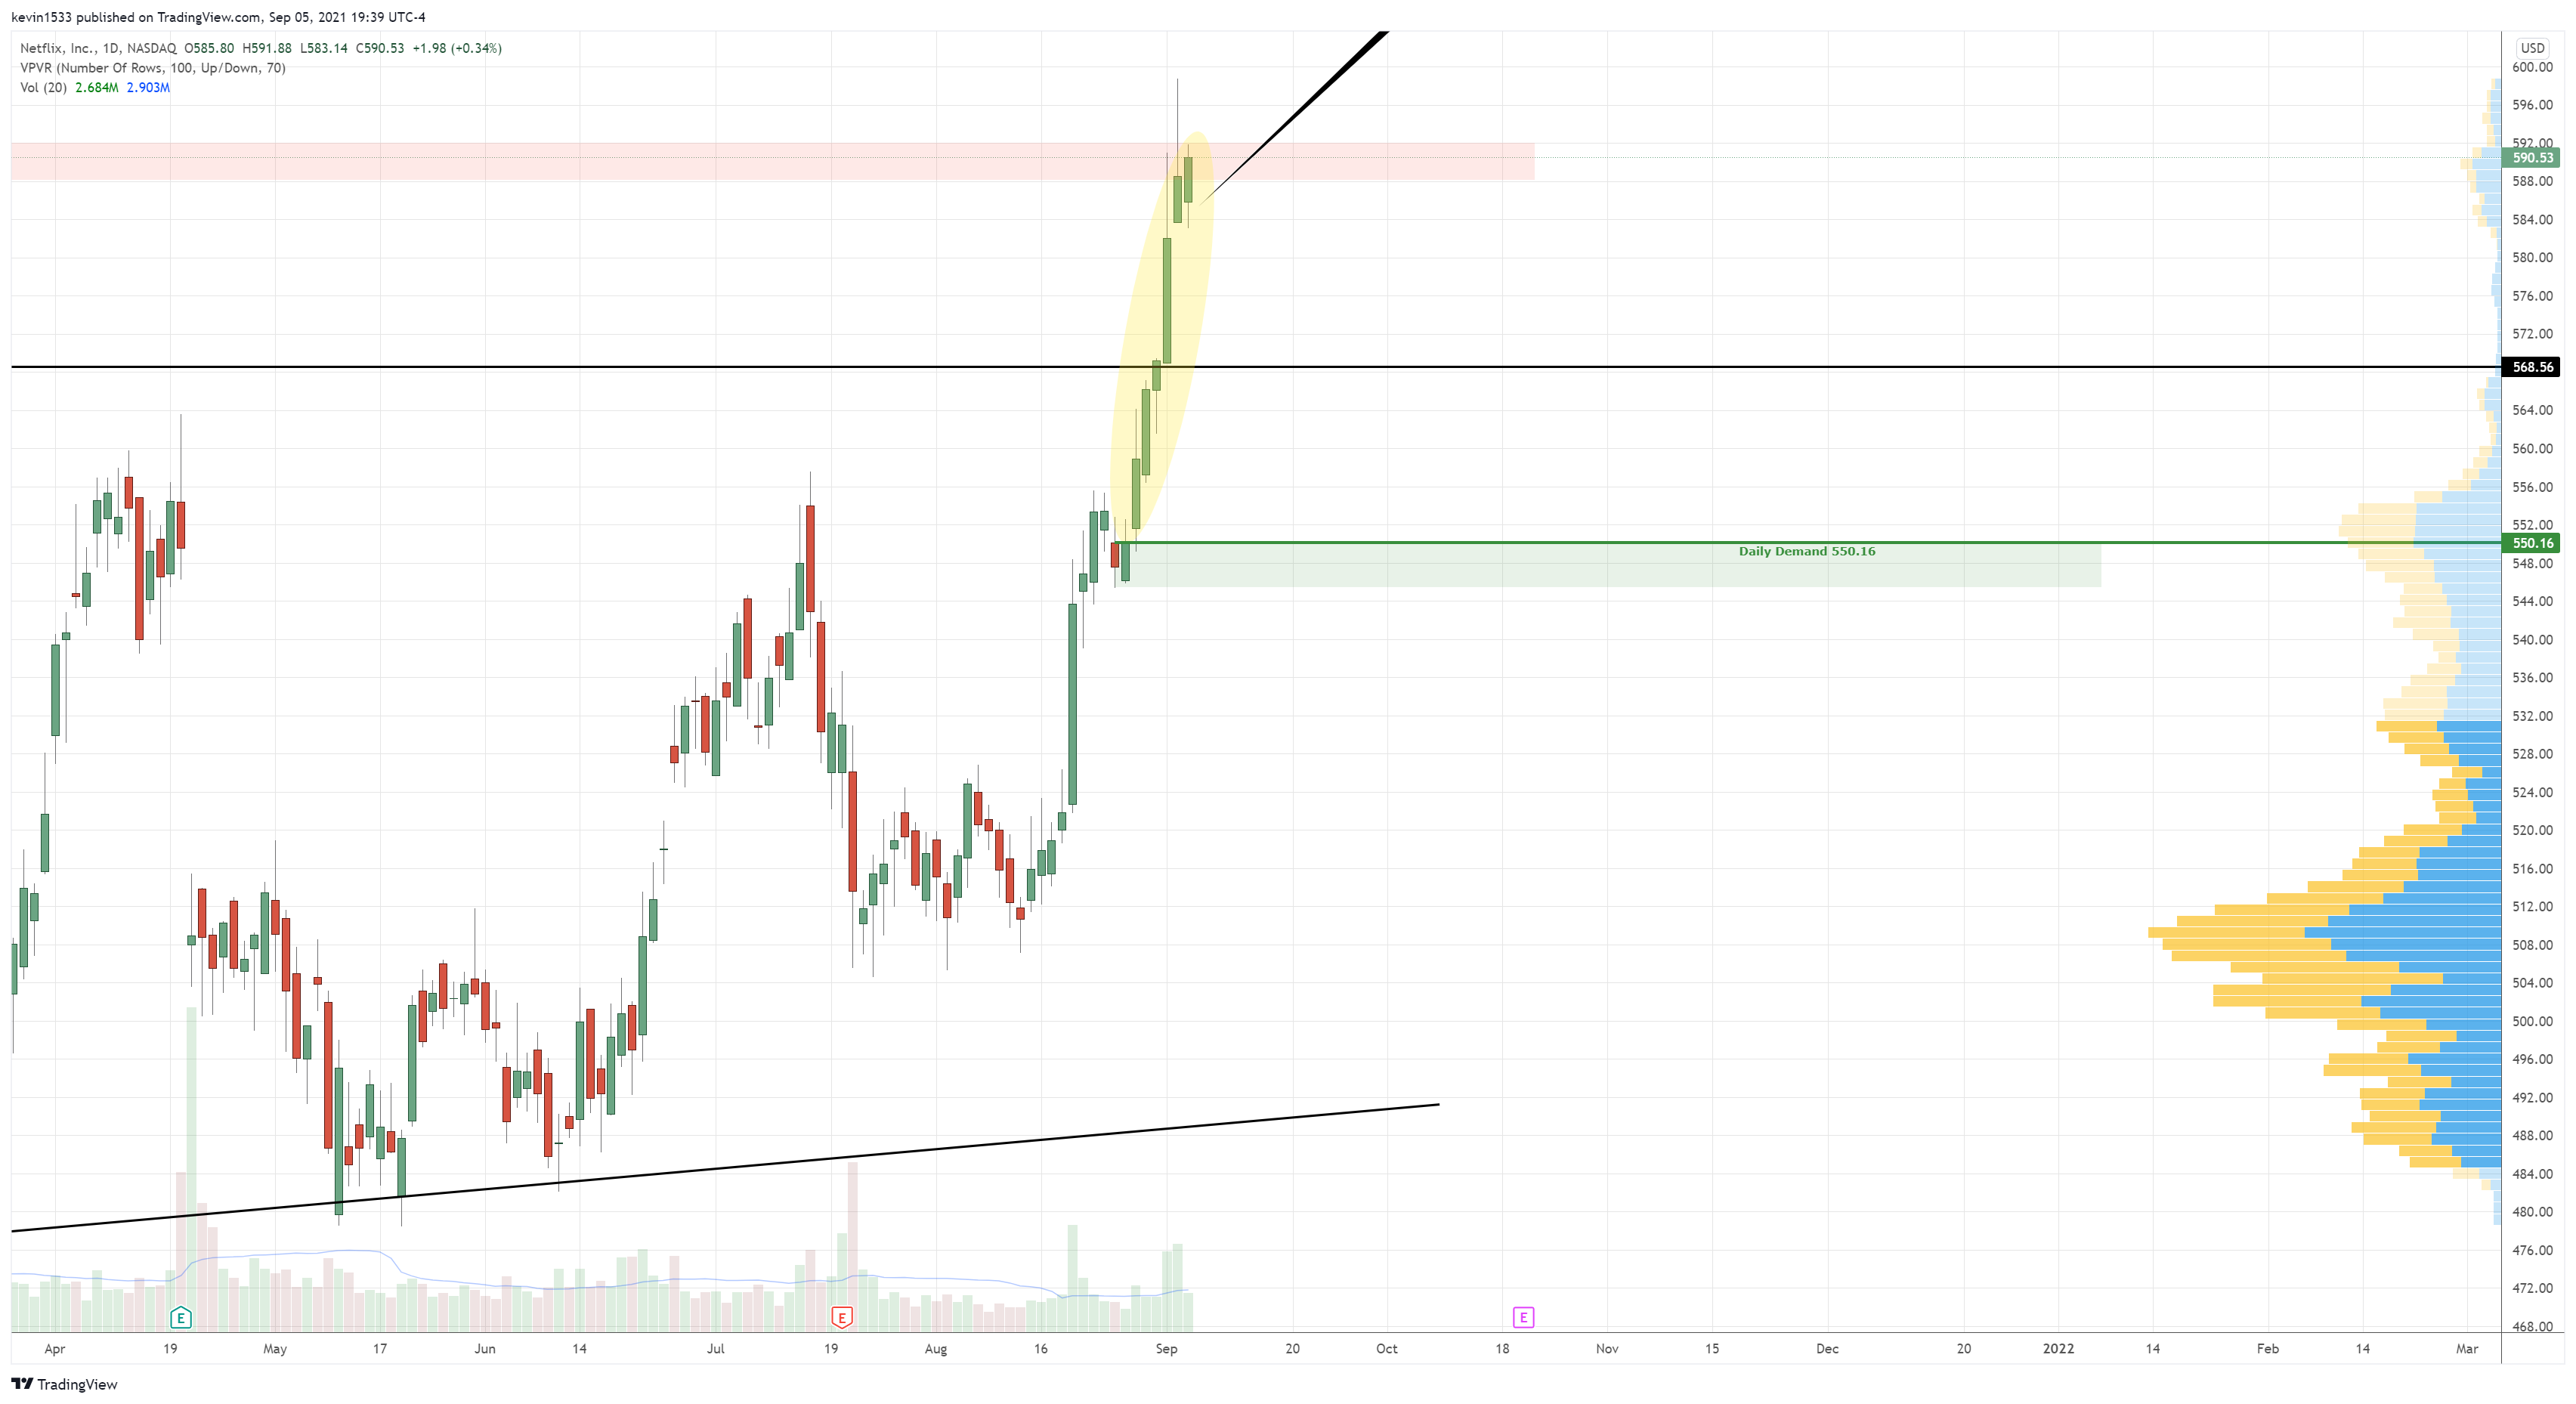
$NFLX (daily) ridiculously extended move extended from even 5ema with 9ema far behind. Double top with RSI extremely overbought. In need of healthy pullback or consolidation

$TSLA (weekly) at channel and horizontal resistance zone

$TSLA (weekly) shooting star at dual resistance (horizontal+ channel)

If the market pulls back significantly, we’ll wait for demand levels to trigger
$AAPL (daily) long setup at 148.35 and 133.46
$AAL (daily) long setup at 17.83

$AMC (daily) long setup at 37.39

$AMD (daily) long setup at 92.94

$AMZN (daily) long setup at 3310 and 3070

$BA (daily) long setup at 196 and 178.95

$BABA (daily) long setup at 134.27

$BYND (daily) long setup at 108.60

$BZUN (daily) long setup at 19.07

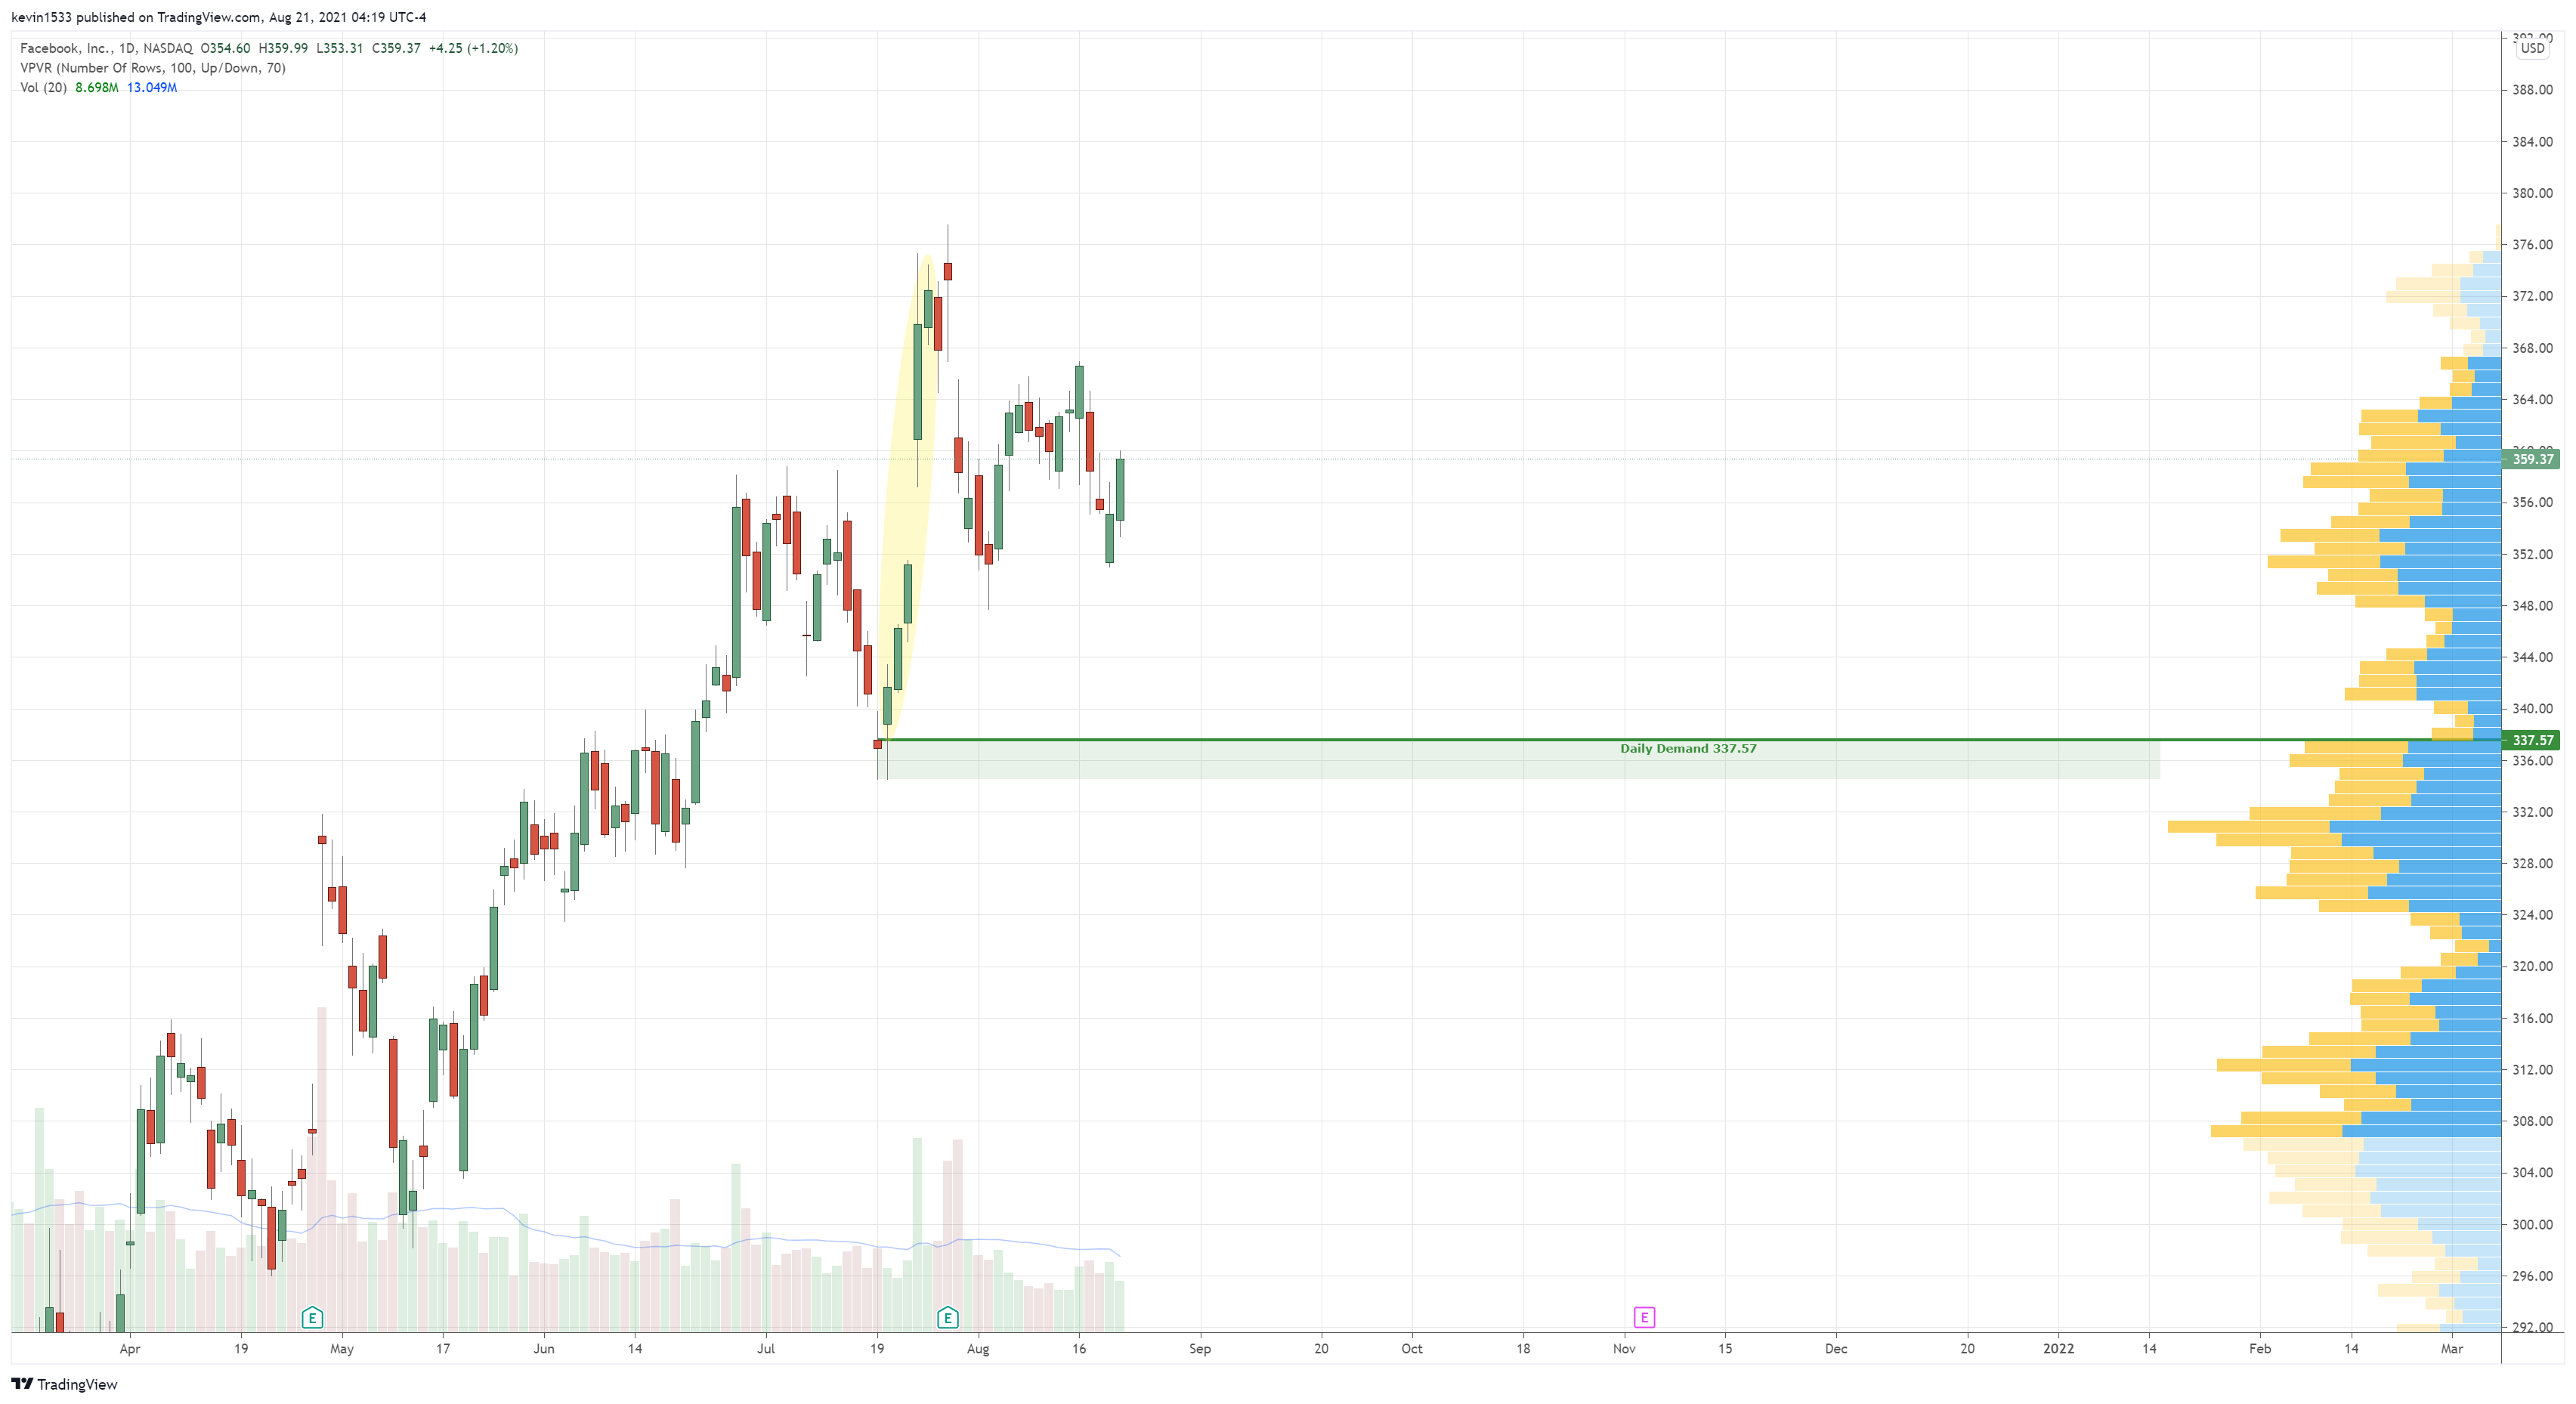
$FB (daily) long setup at 337.57
$FDX (daily) long setup at 242.60

$FUBO (daily) long setup at 21.62

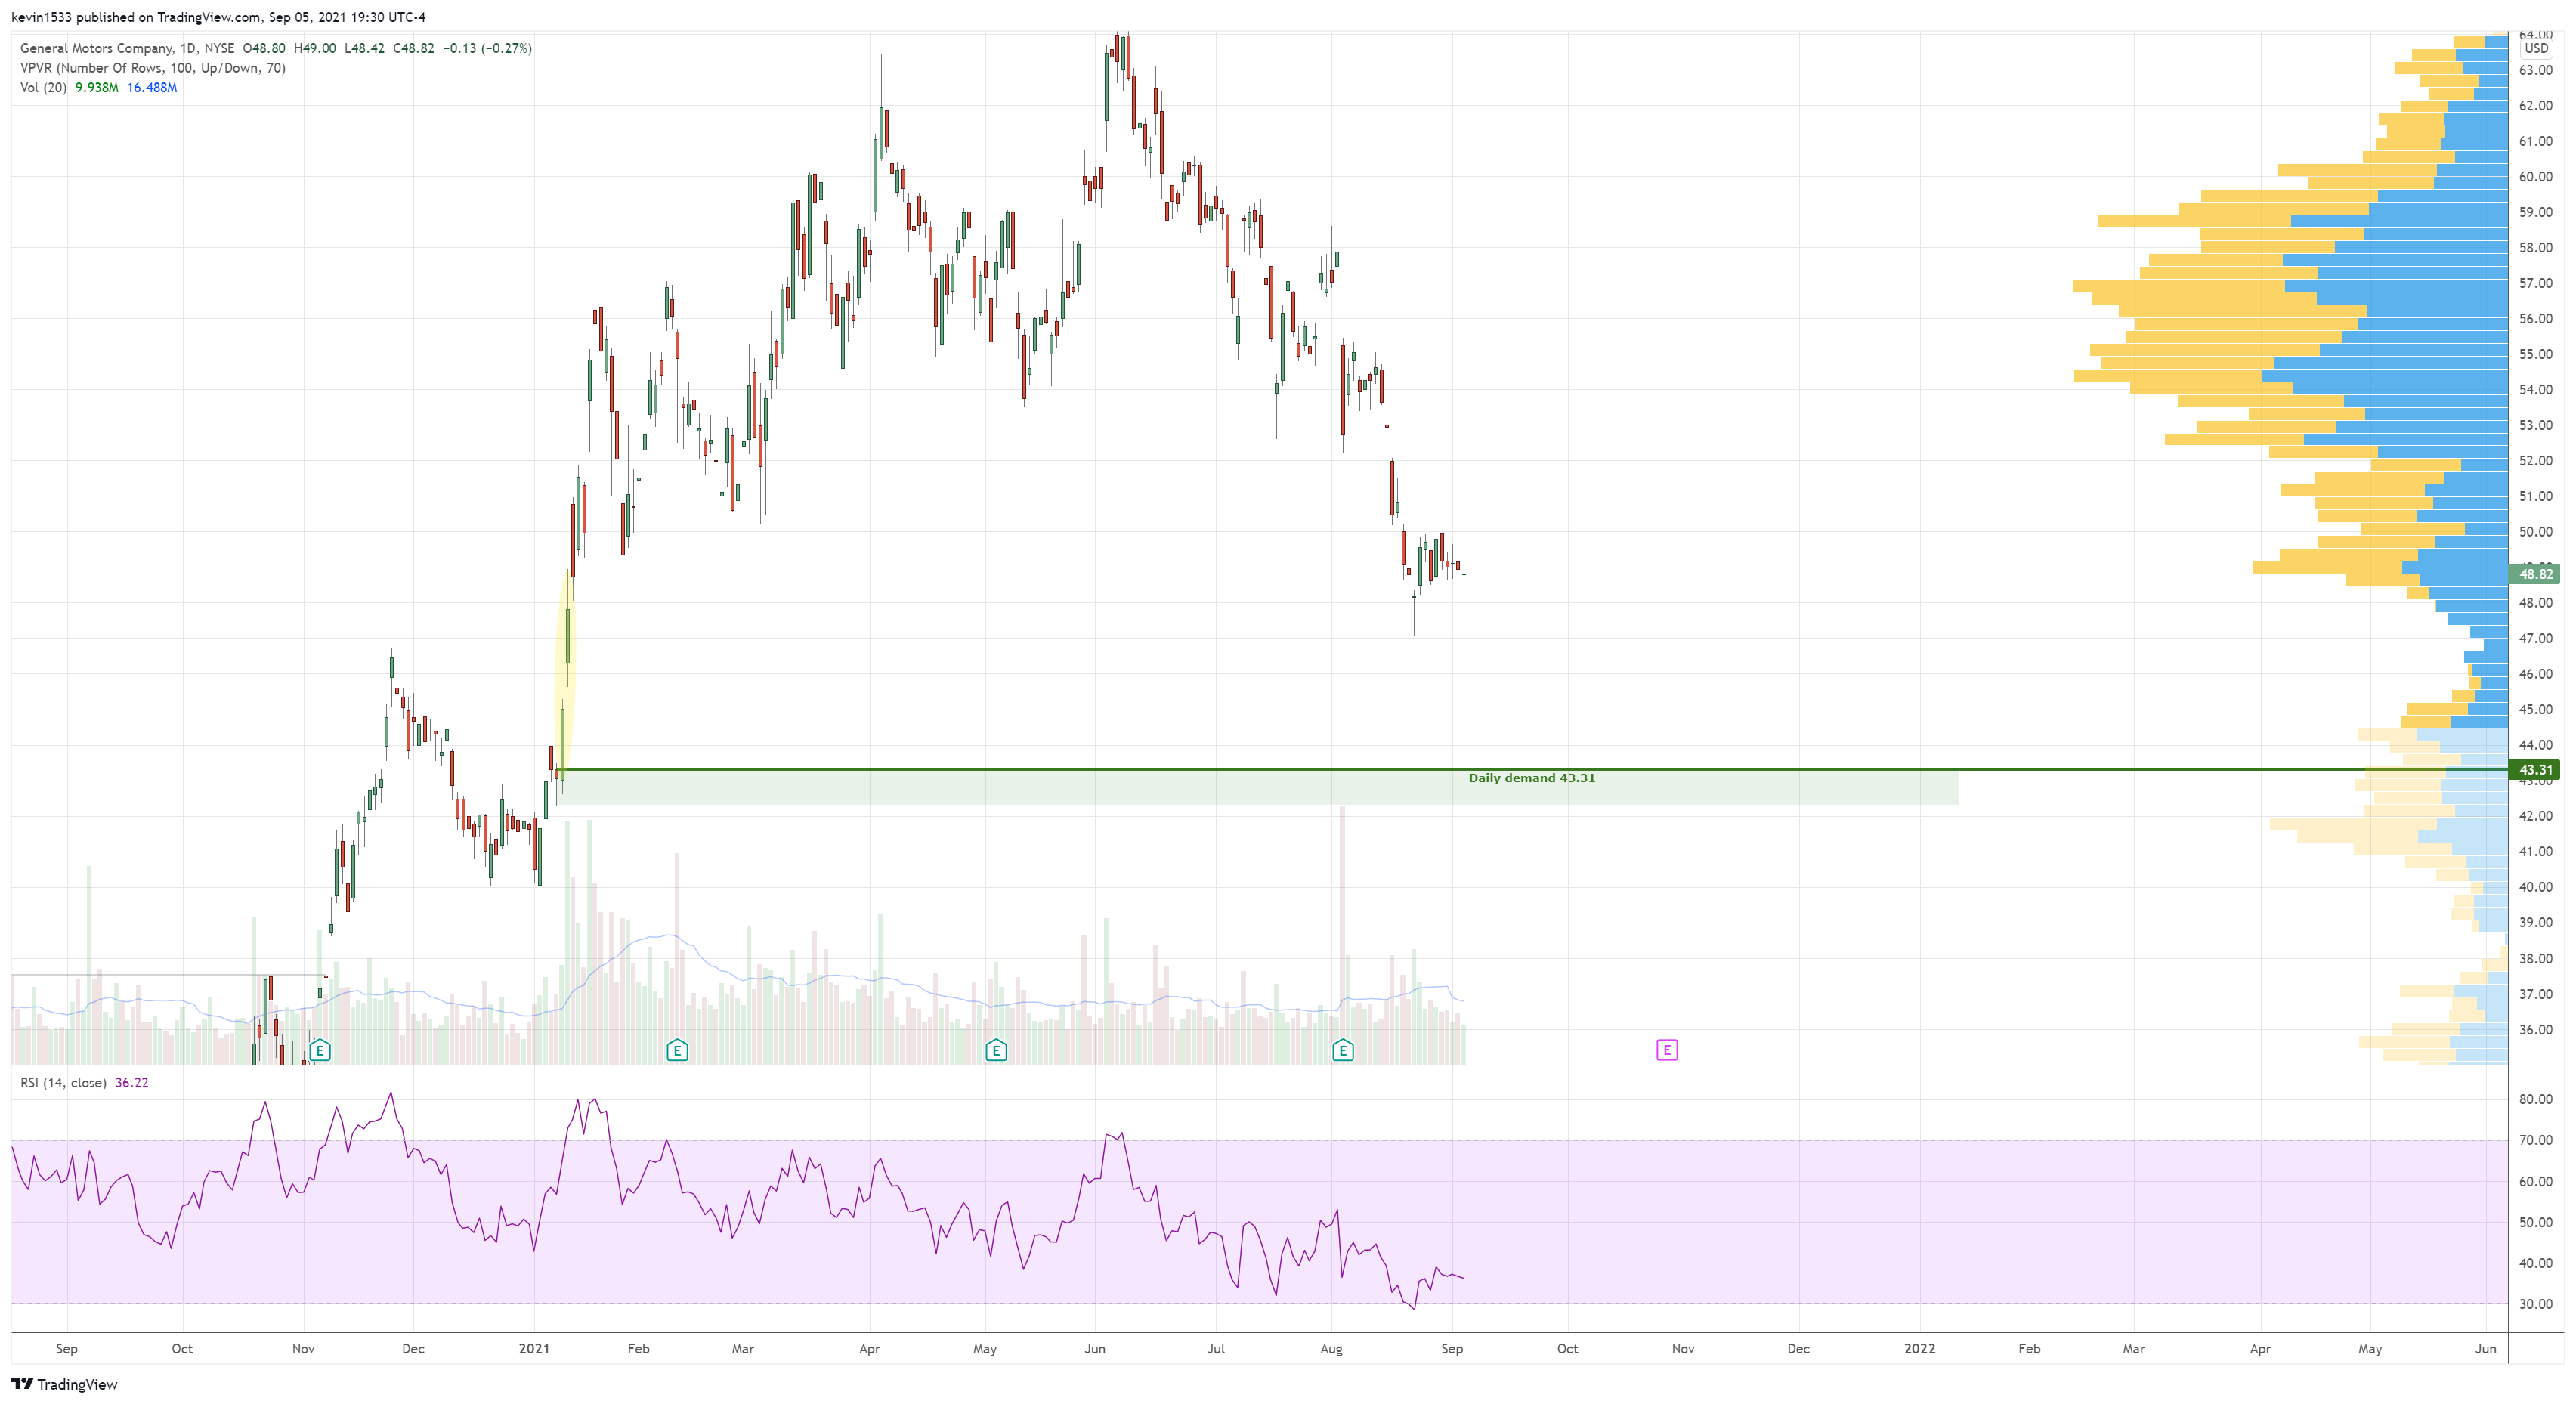
$GM (daily) long setup at 43.31
$GME (4H) long setup at 167.29

$HOOD (4H) Long setup at 36.78

$IBM (daily) long setup at 133.6

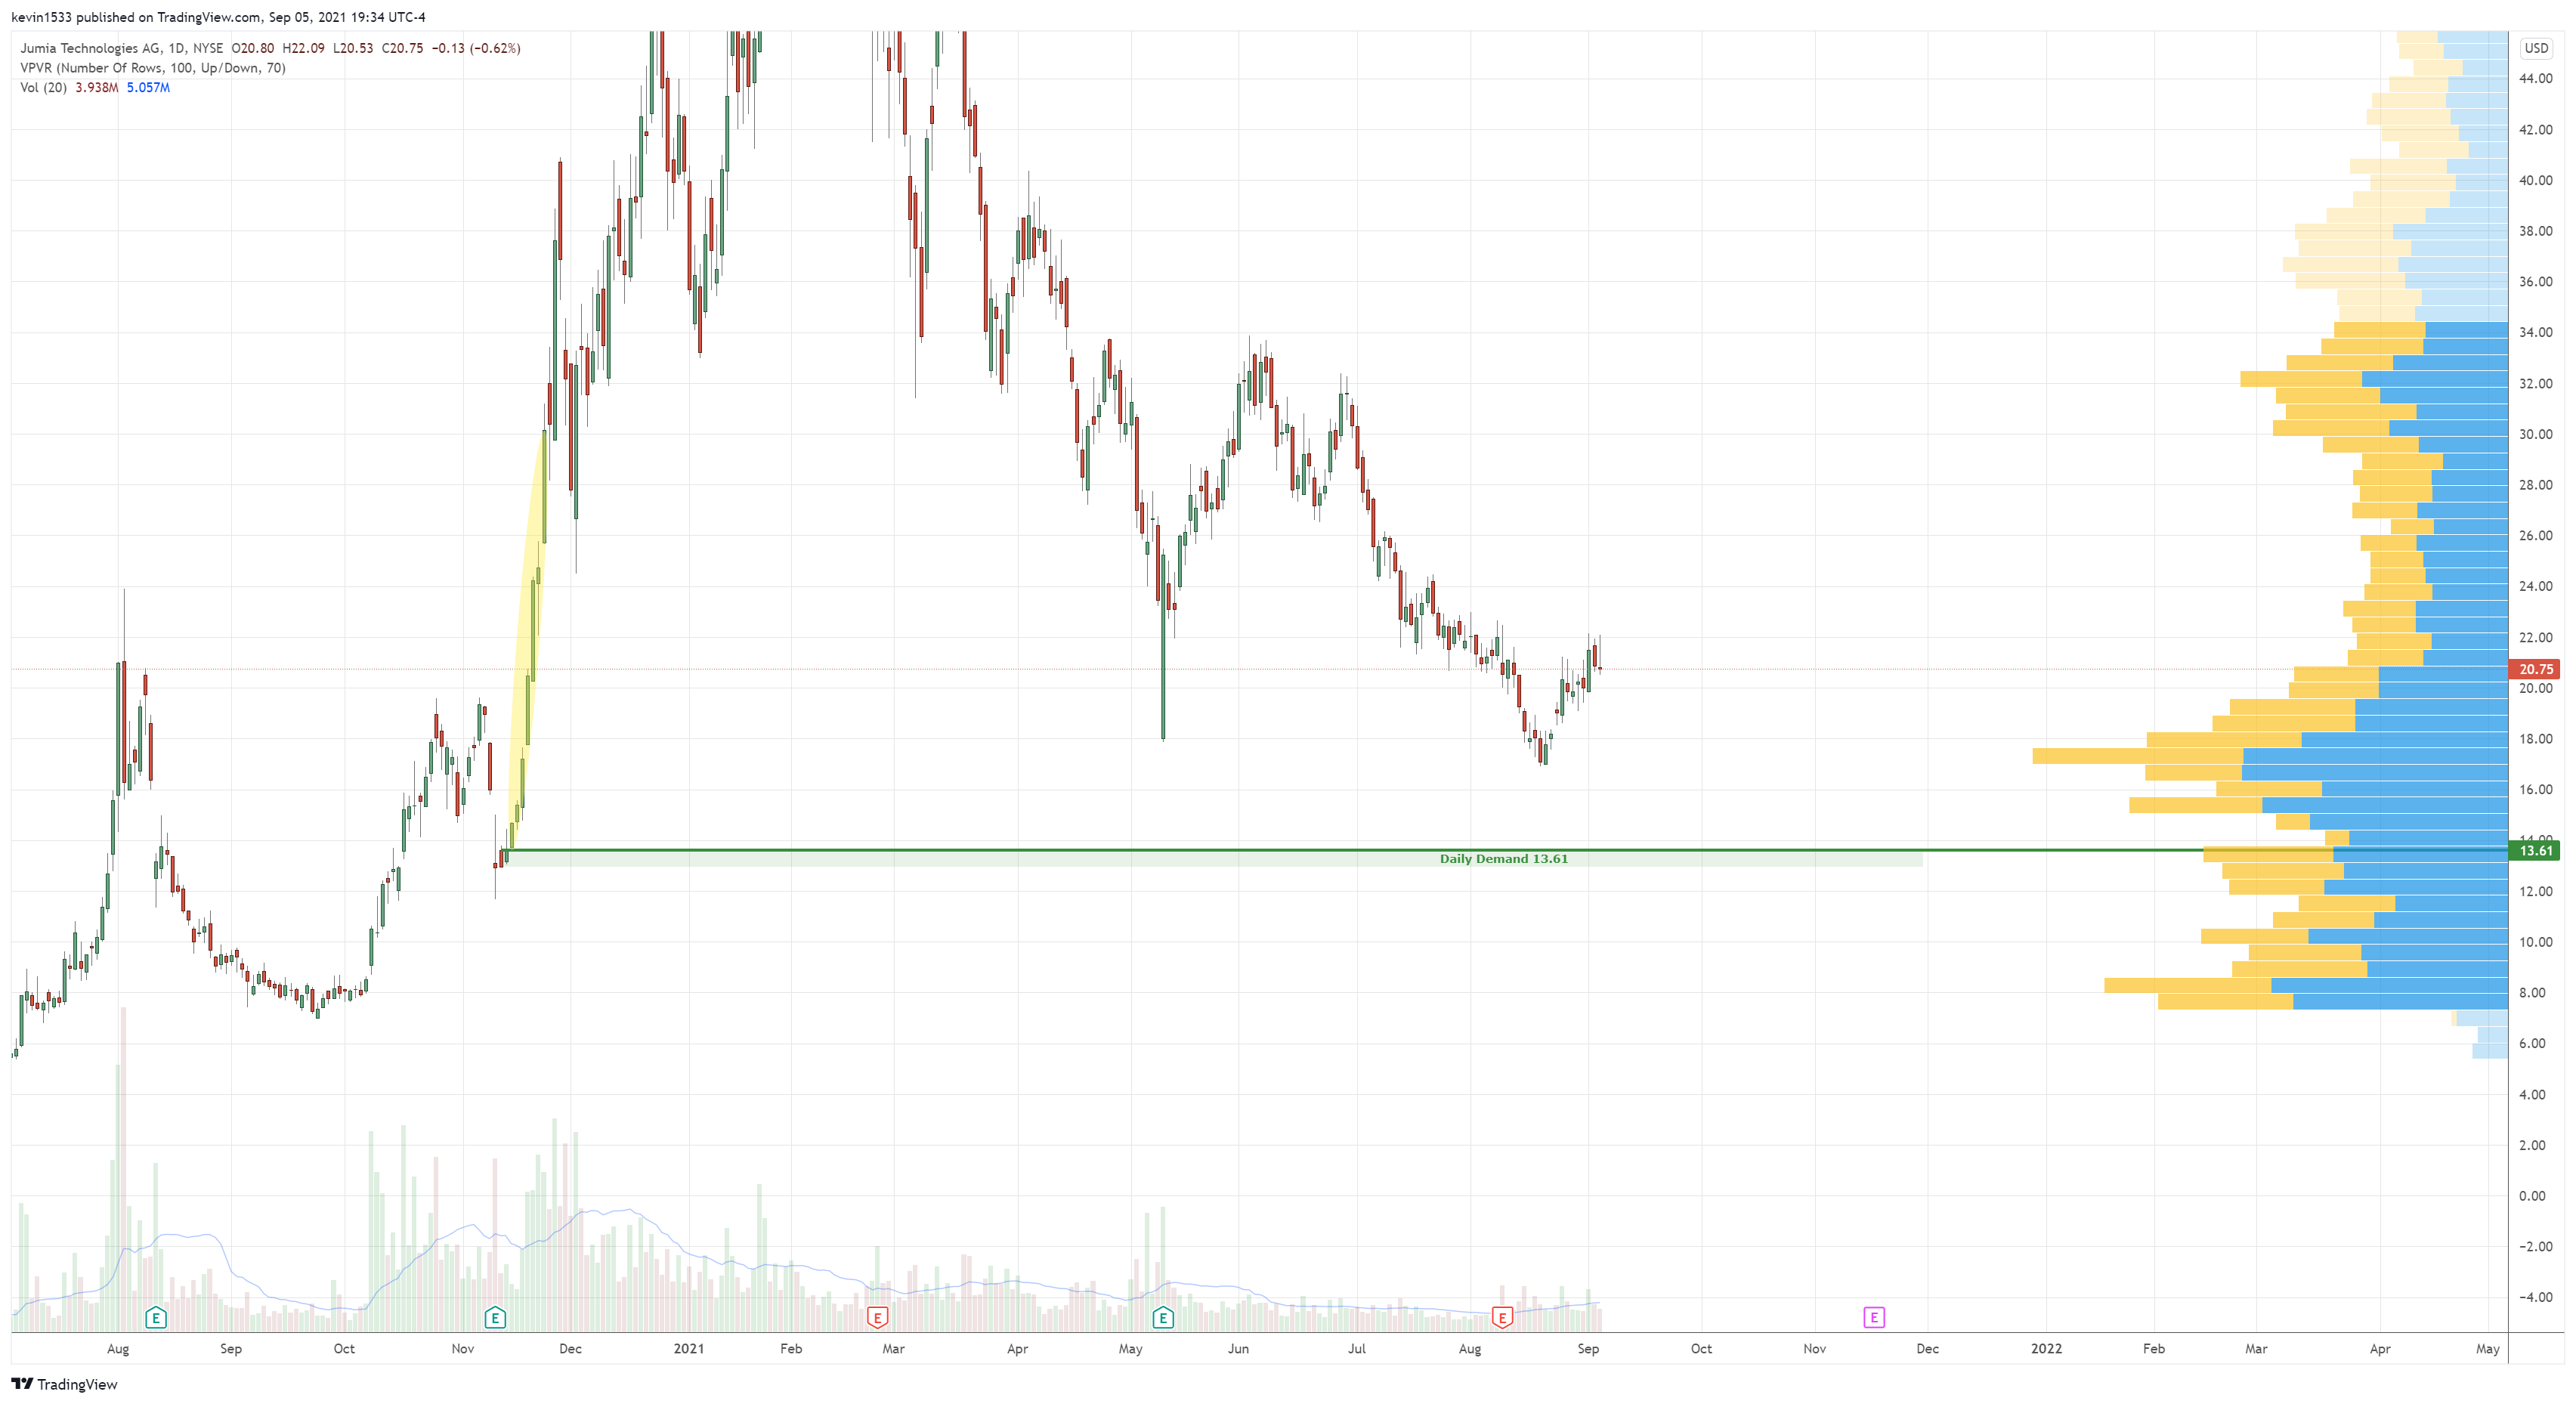
$JMIA (daily) long setup at 13.61
$KR (daily) long setup at 42.92

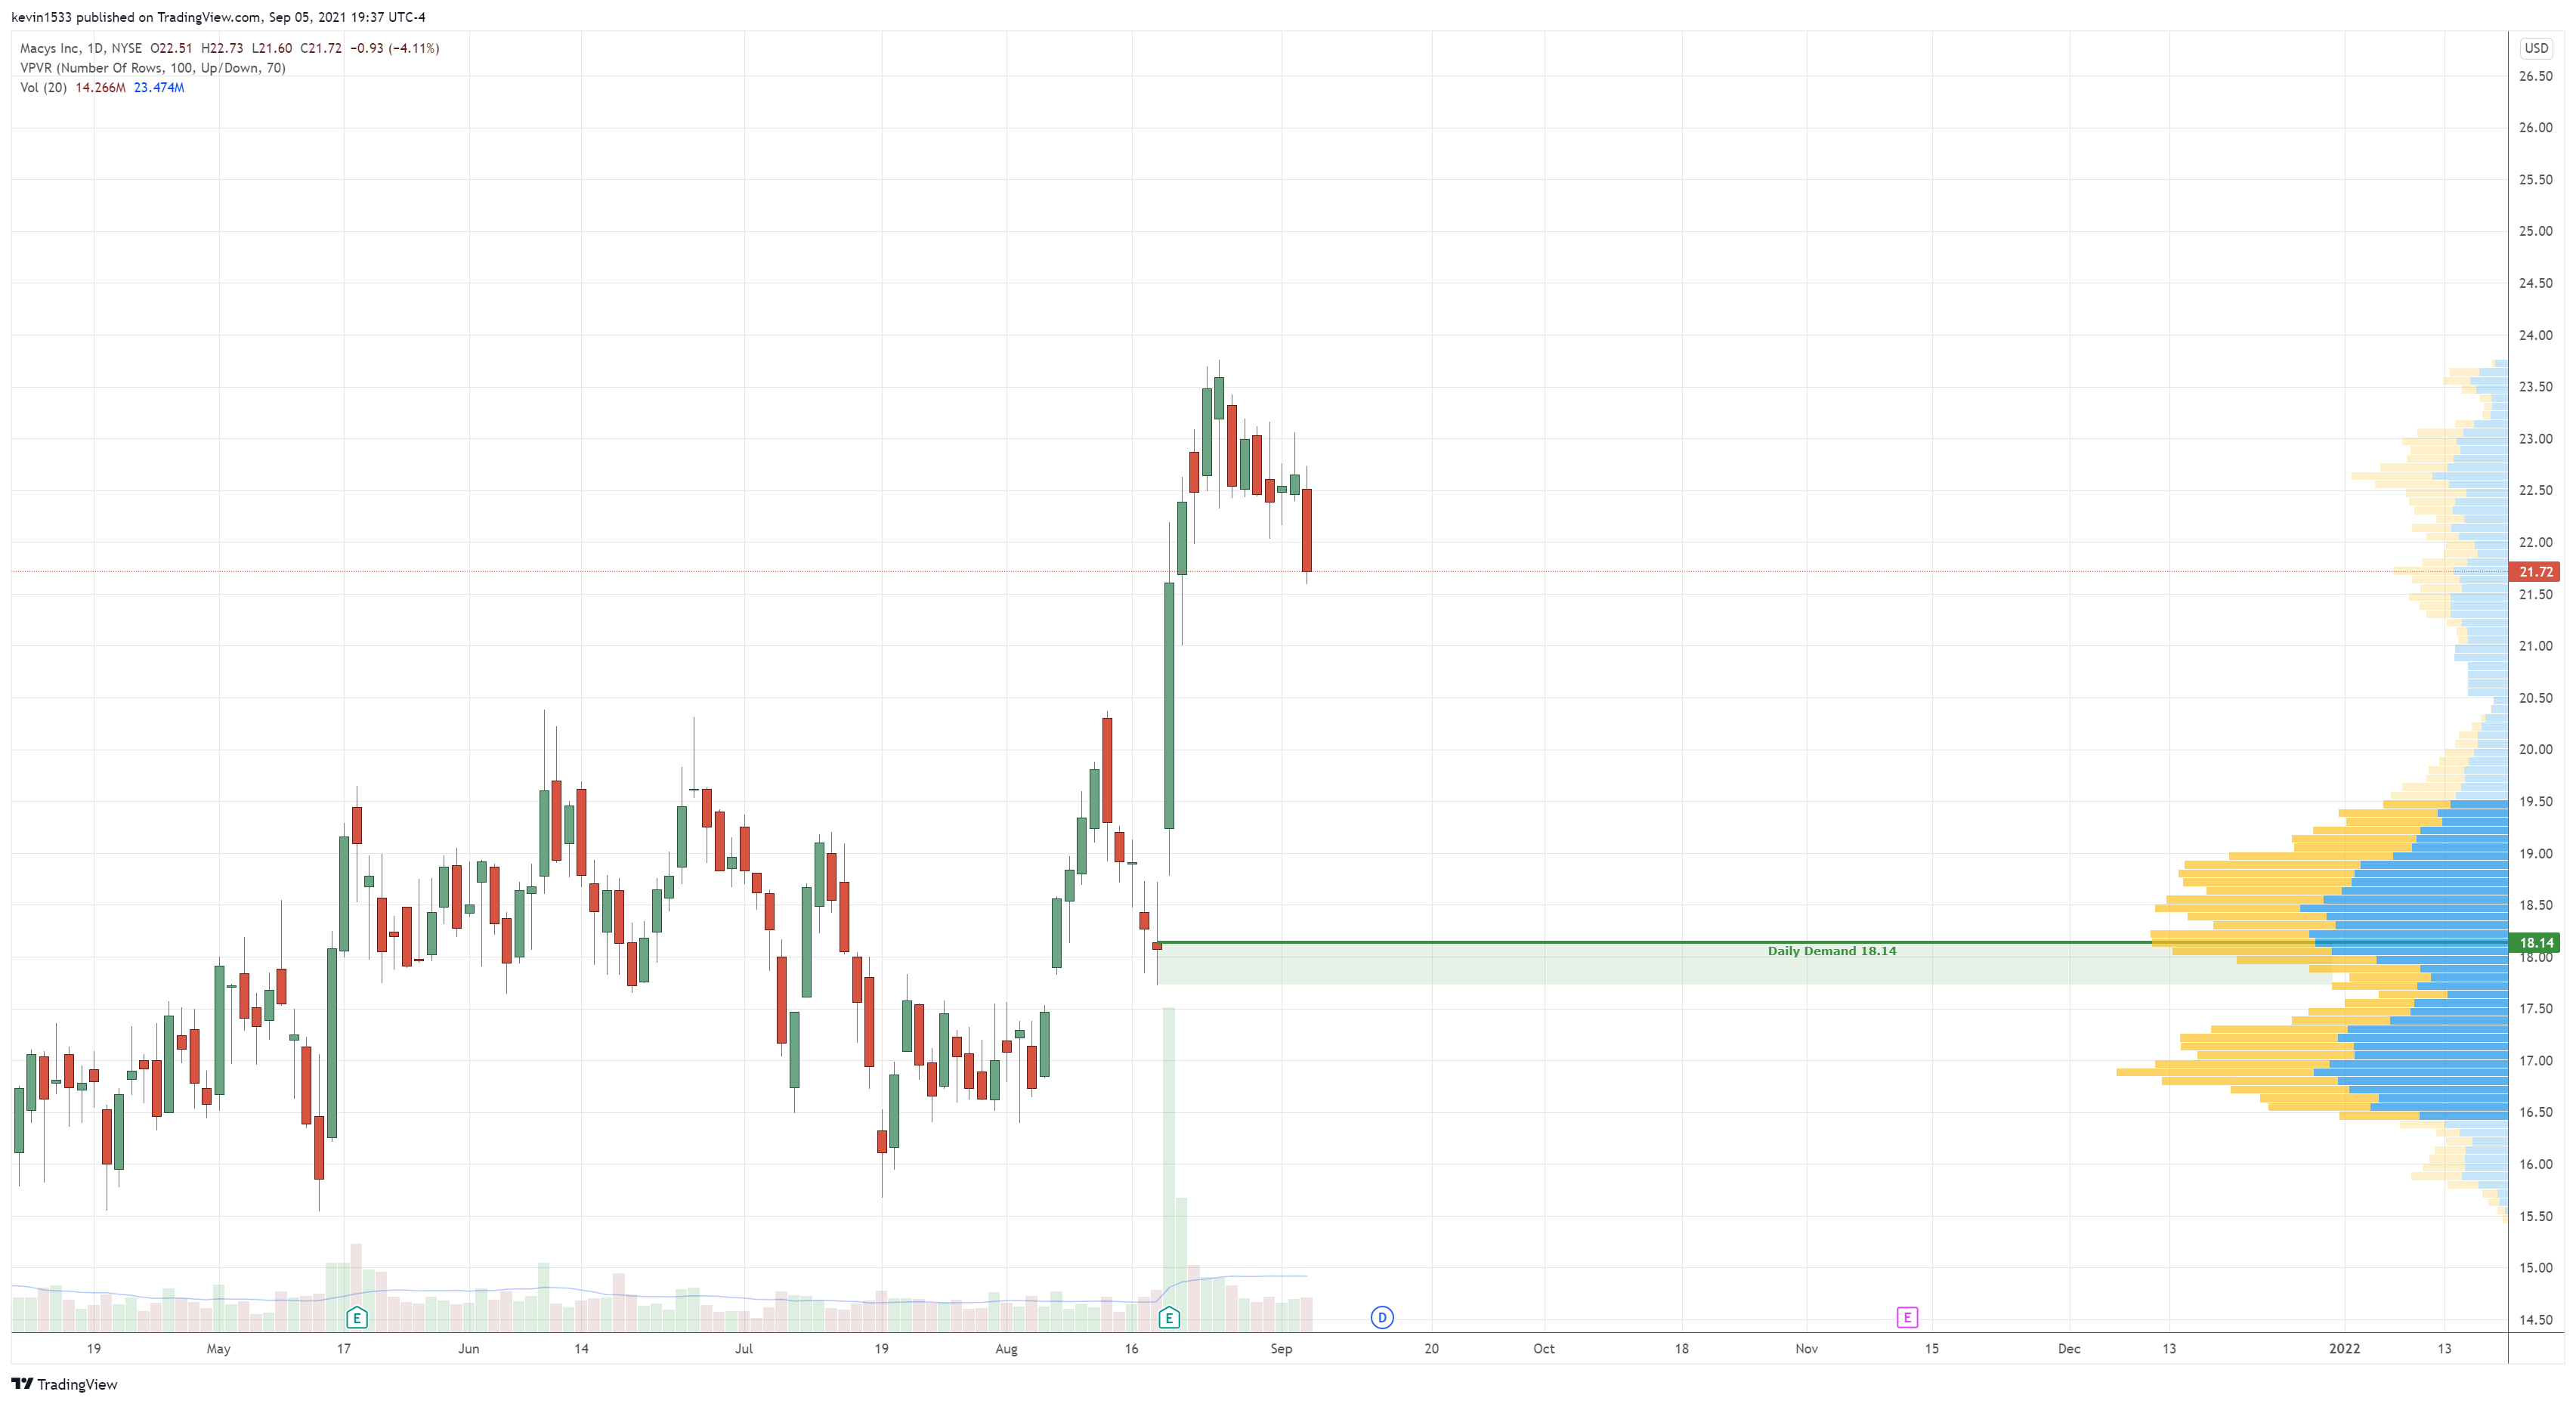
$M (daily) long setup at 18.14
$NFLX (daily) long setup at 550.16
$NKE (daily) long setup at 158.15

$NTES (daily) Long setup at 80.74

$NVDA (4H) long setup at 200

$PFE (daily) long setup at 42.88

$SBUX (daily) long setup at 112.34

$SNAP (daily) long setup at 62.82

$TLRY (daily) long setup at 11.38

$TRIP (daily) long setup at 29.21

$UBER (daily) long setup at 38.35 and 33.91

$UPS (daily) long setup at 179.78

$V (daily) long setup at 212.55

$WW (daily) long setup at 18.41

$WYNN (daily) long setup at 88.71

You mean monthly and weekly TF? I chart them but they arent as actionable for daytrading, one example being the $TLT monthly demand I posted a while ago where it based off it for weeks before moving up.
Gotcha. Thank you Sir.
Great analysis! Thank you Kevin!
Great analysis on SPX!. Like clock work.