We’ve had a significant pullback in the market of close to 10% in $SPY in less than 3 weeks. We were fortunate enough to capitalize on most of the move while sticking to the newsletter plan without emotion. I posted a timeline of each steps of the trade corresponding newsletter updates in a twitter thread. Make sure to review and study that along with the previous newsletter plans at major reversals.
When the market is on an extended move – rally or sell-off, it is tempting to jump back into a trade due to FOMO. However, ideal entry and setup for the short is no longer there and we are extremely oversold as we can see from the $NYMO McClellan Oscilator below which shows that we are at the most oversold level since Feb 2020 during the market crash. Does this mean we can’t go any lower? No, we can become more oversold or even stay oversold without necessarily having a strong rally. Therefore its important not to try to “catch a falling knife” and randomly go long based off oversold condition alone. Also you do not have to catch every move up and down. Only trade the setups you recognize and are comfortable with. My preference now is to stay patient and wait for a rally to set up another potential short swing entry. (what if we dont get a rally? well then I will assess the situation then as we move along to see other possible opportunities)

$SPX (monthly, log scale) as we anticipated, the August monthly candle rejected off the box consolidation and the long term purple trend line backtest.

$SPX (monthly) closer look. After initially pushing above monthly 5/9/20ema, we printed a long upper wick rejection candle in August and closed below the moving averages which should now be consider the downward trend resistance until proven otherwise. Momentum is clearly downward as we are coming off box consolidation backtest rejection which is the prefered method of entry for most traders rather than entering on the intial breakdown back in April. Long term outlook, the path of least resistance is toward the black channel support and the pre-Feb 2020 crash levels.

$SPY (weekly) we completed our short swing trade which we started near the top of the more recent descending channel resistance and now we are at potential support (previous base breakout backtest and short term uptrend line). Although, monthly picture is bearish, shorter timeframe can consolidate or even rally before resuming downward. As a rule, I do not enter short right at support (especially after an extended move) – you cannot assume that it will be breached. You either wait for the breakdown confirmation close below the supports or wait for a rally to possibly look to reshort. (Considering the oversold conditions as noted by McClellan oscillator, I would prefer more consolidation before a breakdown entry, or wait for entry higher after a relief rally.)

$SPY (daily) one option is to wait for a rally to happen and push into weekly 5/9/20ema cluster which should act as resistance from 405 to 409 range. If we get a daily reversal there, we can consider scaling into short swing position 1 month out. That would be the preferred setup right now as it will reset oversold conditions and then ride the downward trend.

$QQQ (weekly, log scale) below 5/9/20ema and closed right at the base backtest and uptrend line supports similar to $SPY.

$QQQ (daily) at base backtest and uptrend line support. Oversold conditions apply here as well. Will need to see some consolidation before considering a short entry. Similar idea to $SPY, ideally wait for further push into weekly 5/9/20ema resistance zone around 309 to 313 for lower high rejection.

$IWM (daily) at daily demand and uptrend line support could see a relief bounce. Support is support until proven otherwise.

$DJI (daily) at base breakout backtest and uptrend line support.

$VIX (daily) in between support and resistance.

$VIX (weekly) coiling up in tight consolidation and hanging around right below consolidation resistance. Likely will see a major breakout on the next market sell-0ff. The next market leg down in the market should be a strong one. MACD ready to bearcross


$AAPL (monthly, log scale) shooting star rejection at channel backtest and monthly/weekly supply. Currently sitting at 5/9ema converged and ready to turn downward upon further weakness.

$AAPL (weekly) weekly gravestone doji reversal at the weekly supply marked the recent lower highs and now closing below weekly 5/9/20ema. But we could potentially see some consolidation here with the ema’s converged if the rest of the market decides to reset oversold conditions.

$AAPL (daily) at horizontal support

$MSFT (weekly) nice follow-through after the false breakout reversal move back into the descending (black)channel. Now sitting at the ascending channel support but below weekly 5/9/20ema remains vulnerable for further downside.
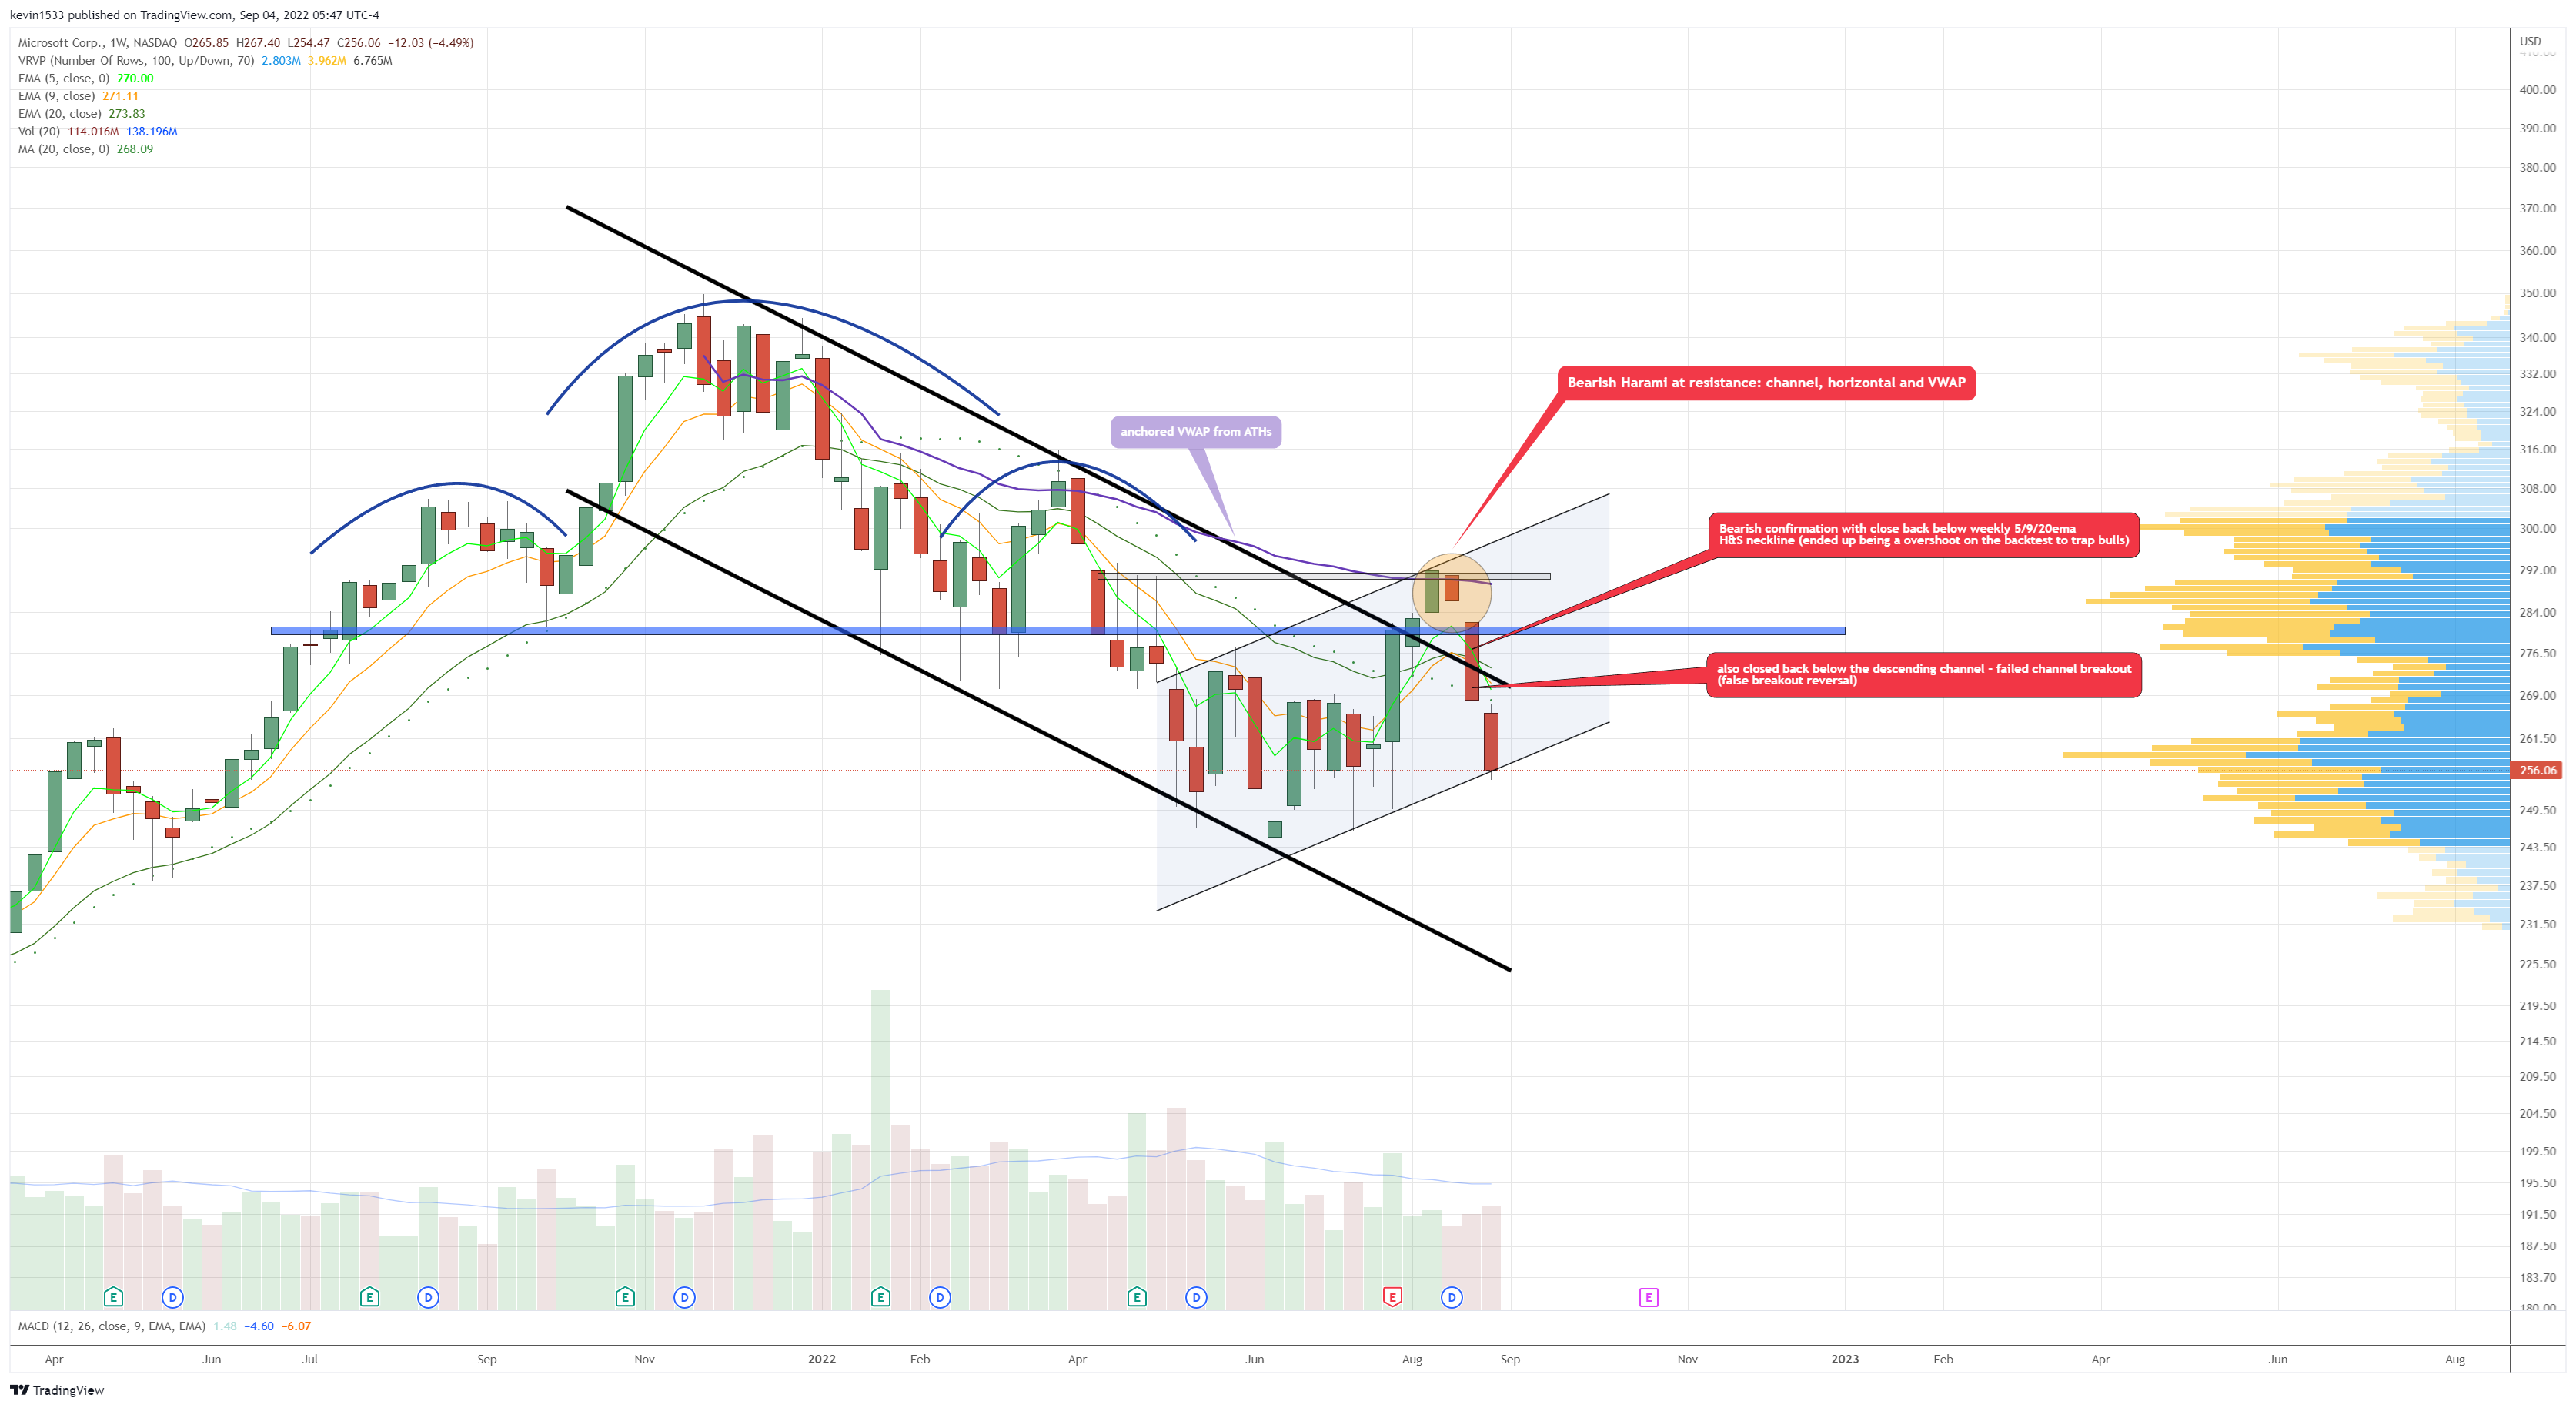
$MSFT (daily) at channel support following extensive move.

$GOOGL (daily) consolidating below 5/9ema with channel support and daily demand waiting right below.

$AMZN (weekly, log scale) holding at the base breakout backtest support. Weekly 5/9/20ema converged and acting as resistance now. If and when we close back below 125, it will be a false breakout reversal and could lead to a strong sell-off with the converged moving averages pushing from above.

$AMZN (daily) holding above support (backtest and uptrend line). Close below 125 would be a short signal.

$TSLA (weekly, log scale) Following the rejection at uptrend line backtest, channel, and anchored VWAP (from ATH) resistance, we had a bearish consolidation breakdown with close below 5/9/20ema. We now have the lower high for the right shoulder of the H&S.

$TSLA (daily) double top breakdown and riding below daily 5/9/20ema. Approaching the bearflag channel support. We should eventually see breakdown of channel and move toward the neckline support.

$BRK.A (weekly, log scale) bearflag channel breakdown with rejection at weekly 5/9ema.

$UNH (daily) strong rejection at 5/9ema but horizontal backtest and channel support.

$META (weekly, log scale) rejected at weekly 20sma and uptrend line backtest and then followed by false breakout reversal back below the base resistance. Path of least resistance is now down and should accelerate once we lose current base support at 156.

$JNJ (monthly, log scale) false breakout reversal plus ascending wedge breakdown with close below converged monthly 5/9/20ema.
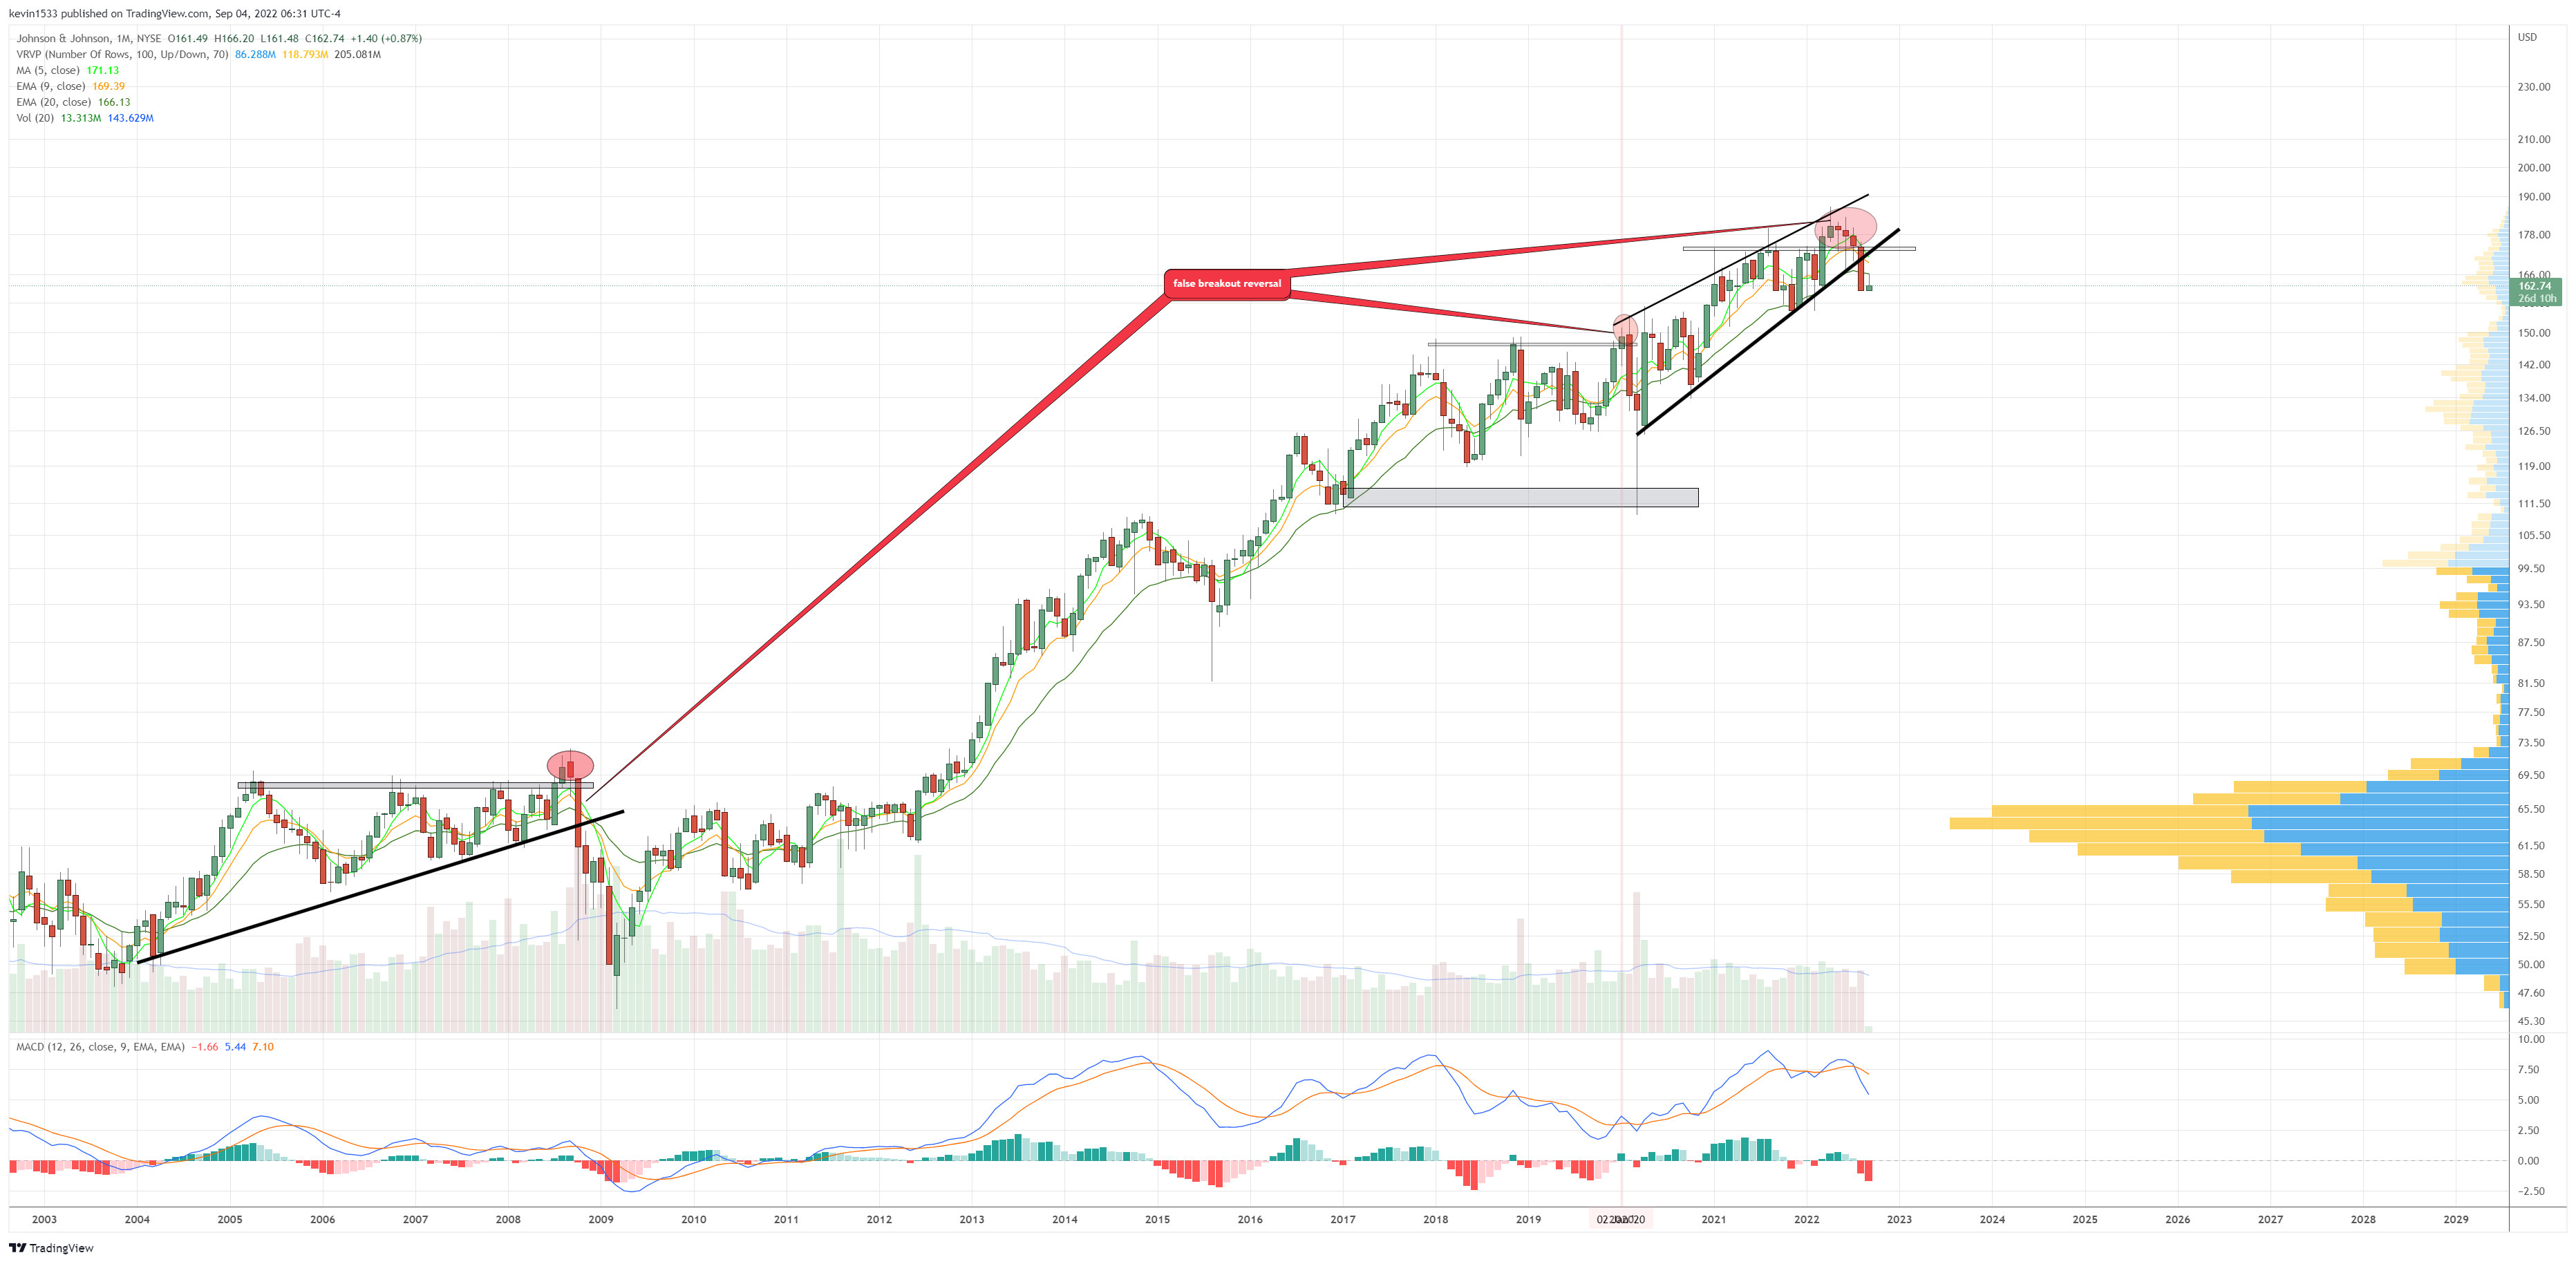
$JNJ (daily) backtest and downtrend line rejection with close below converged daily 5/9/20ema.

$V (monthly, log scale) rejected at the uptrend line backtest and downtrend line as well as monthly 5/9/20ema converged. Compact descending triangle top. If and when this breaks horizontal support, it has potential to carry strong downward force. However as long as we remain above, we could continue to chop and consolidate.

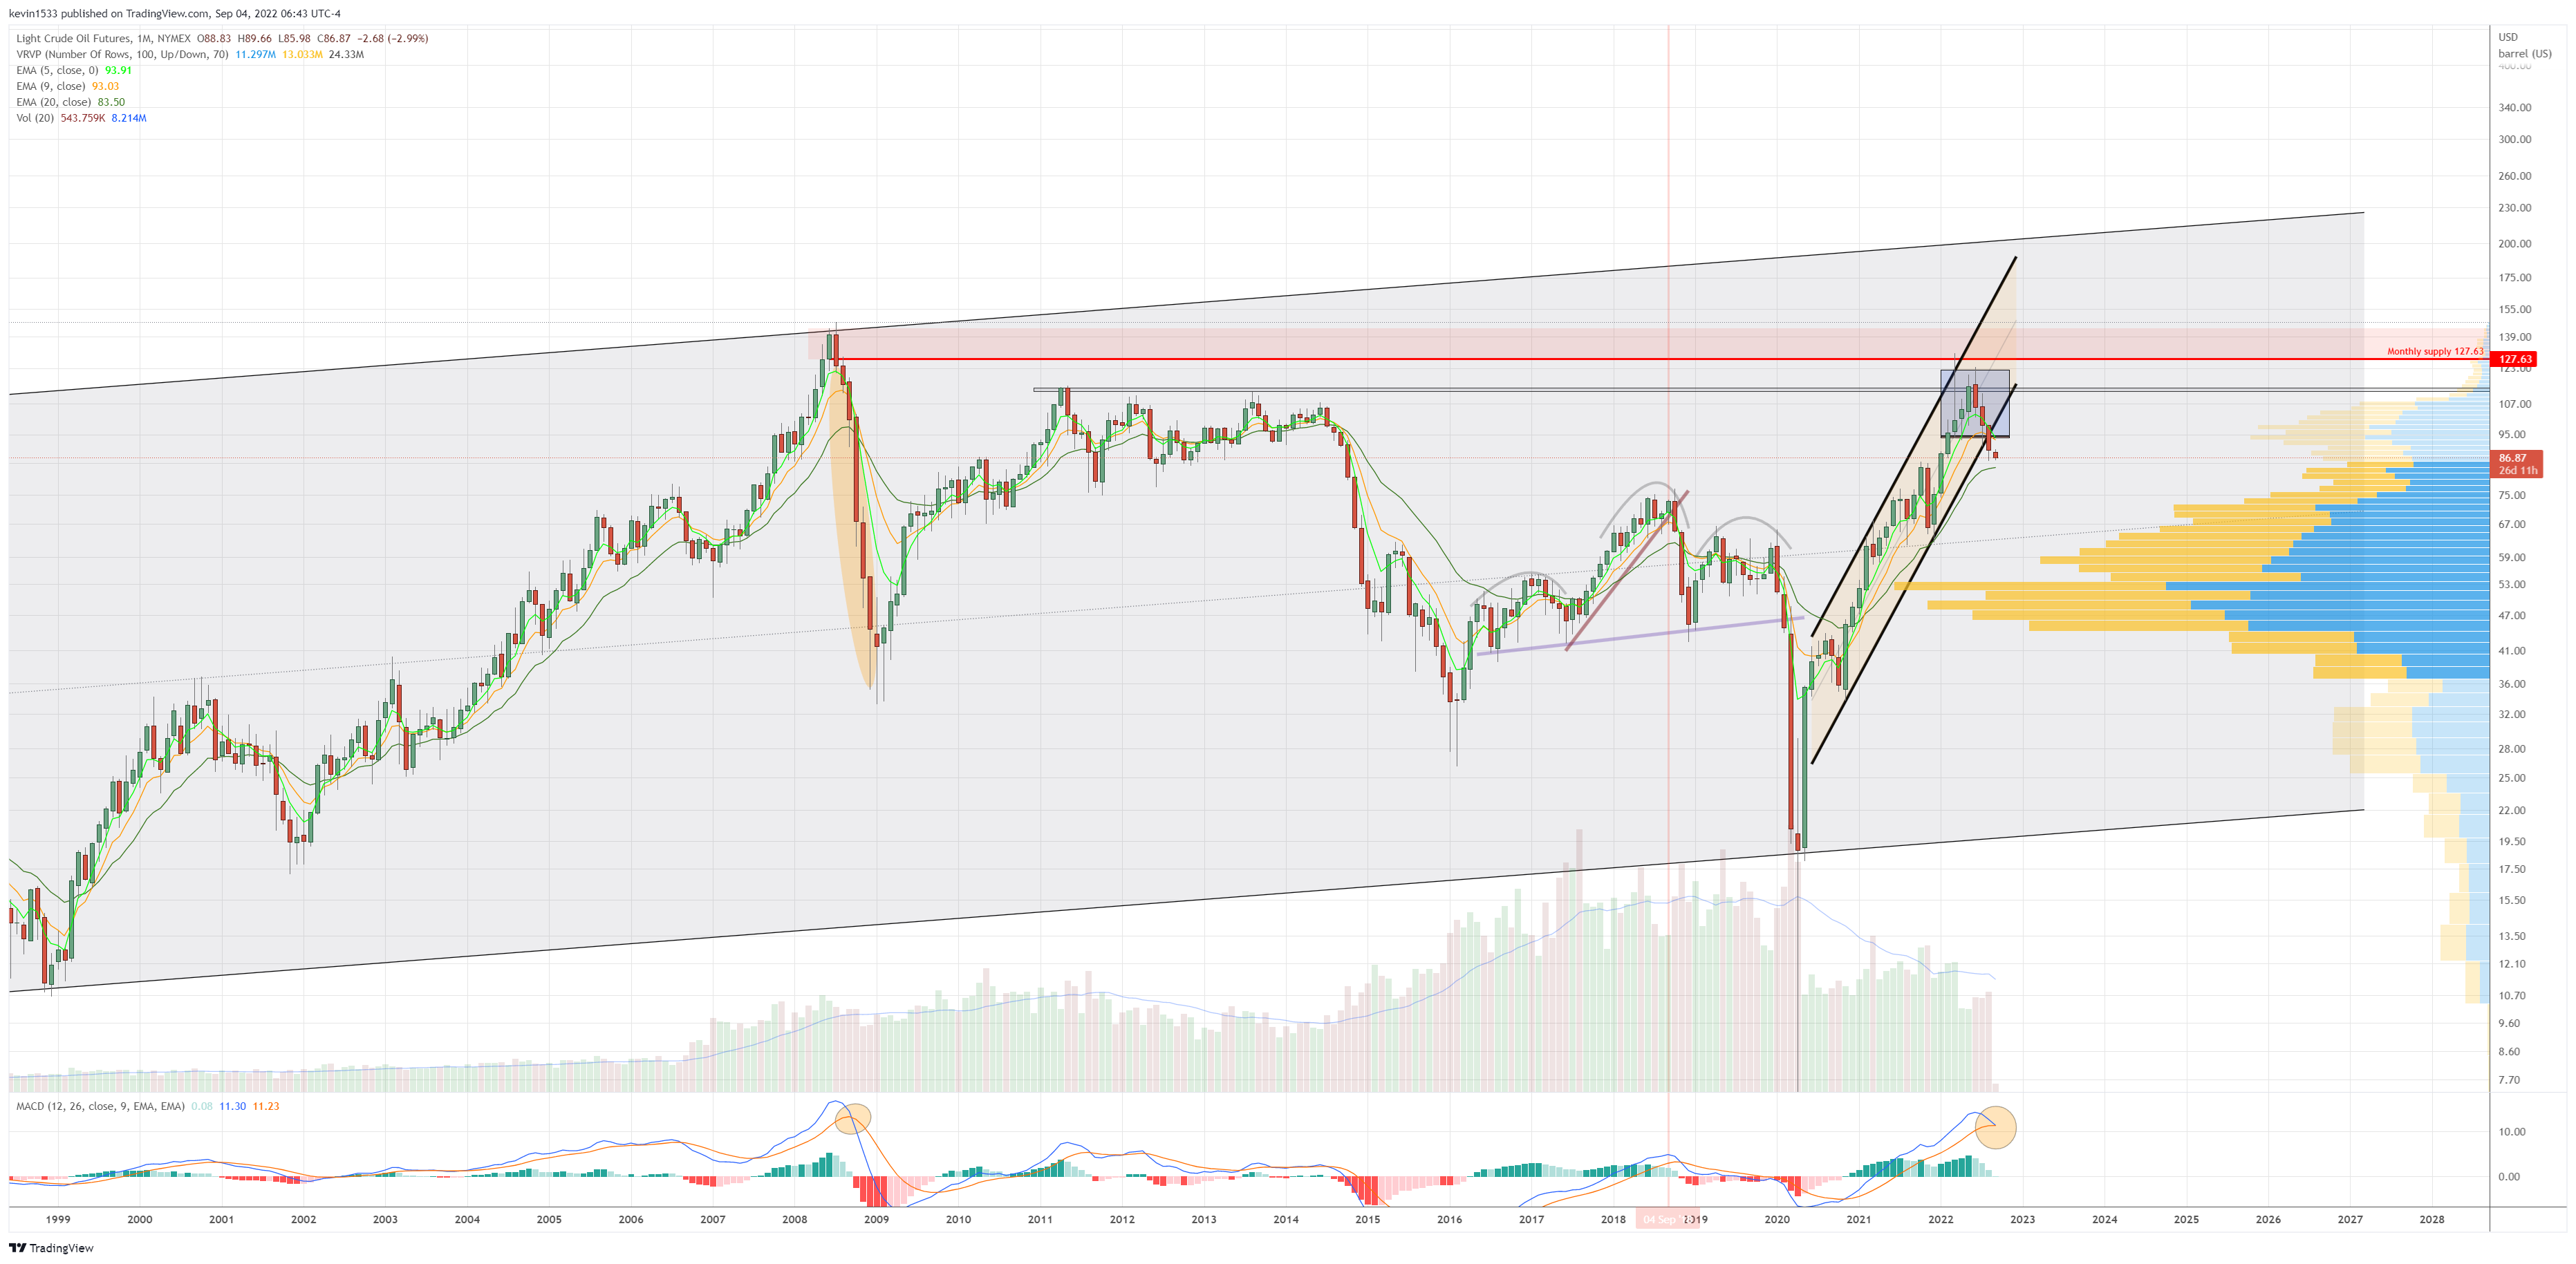
$CL_F crude oil future (monthly, log scale) So far we rejected off the major monthly supply from the 2008 crash followed by bearish channel breakdown. Currently below monthly 5/9ema along with MACD ready about to bearcross on further weakness. Historically, major market corrections involved oil participation and this could be a major warning sign of things to come.
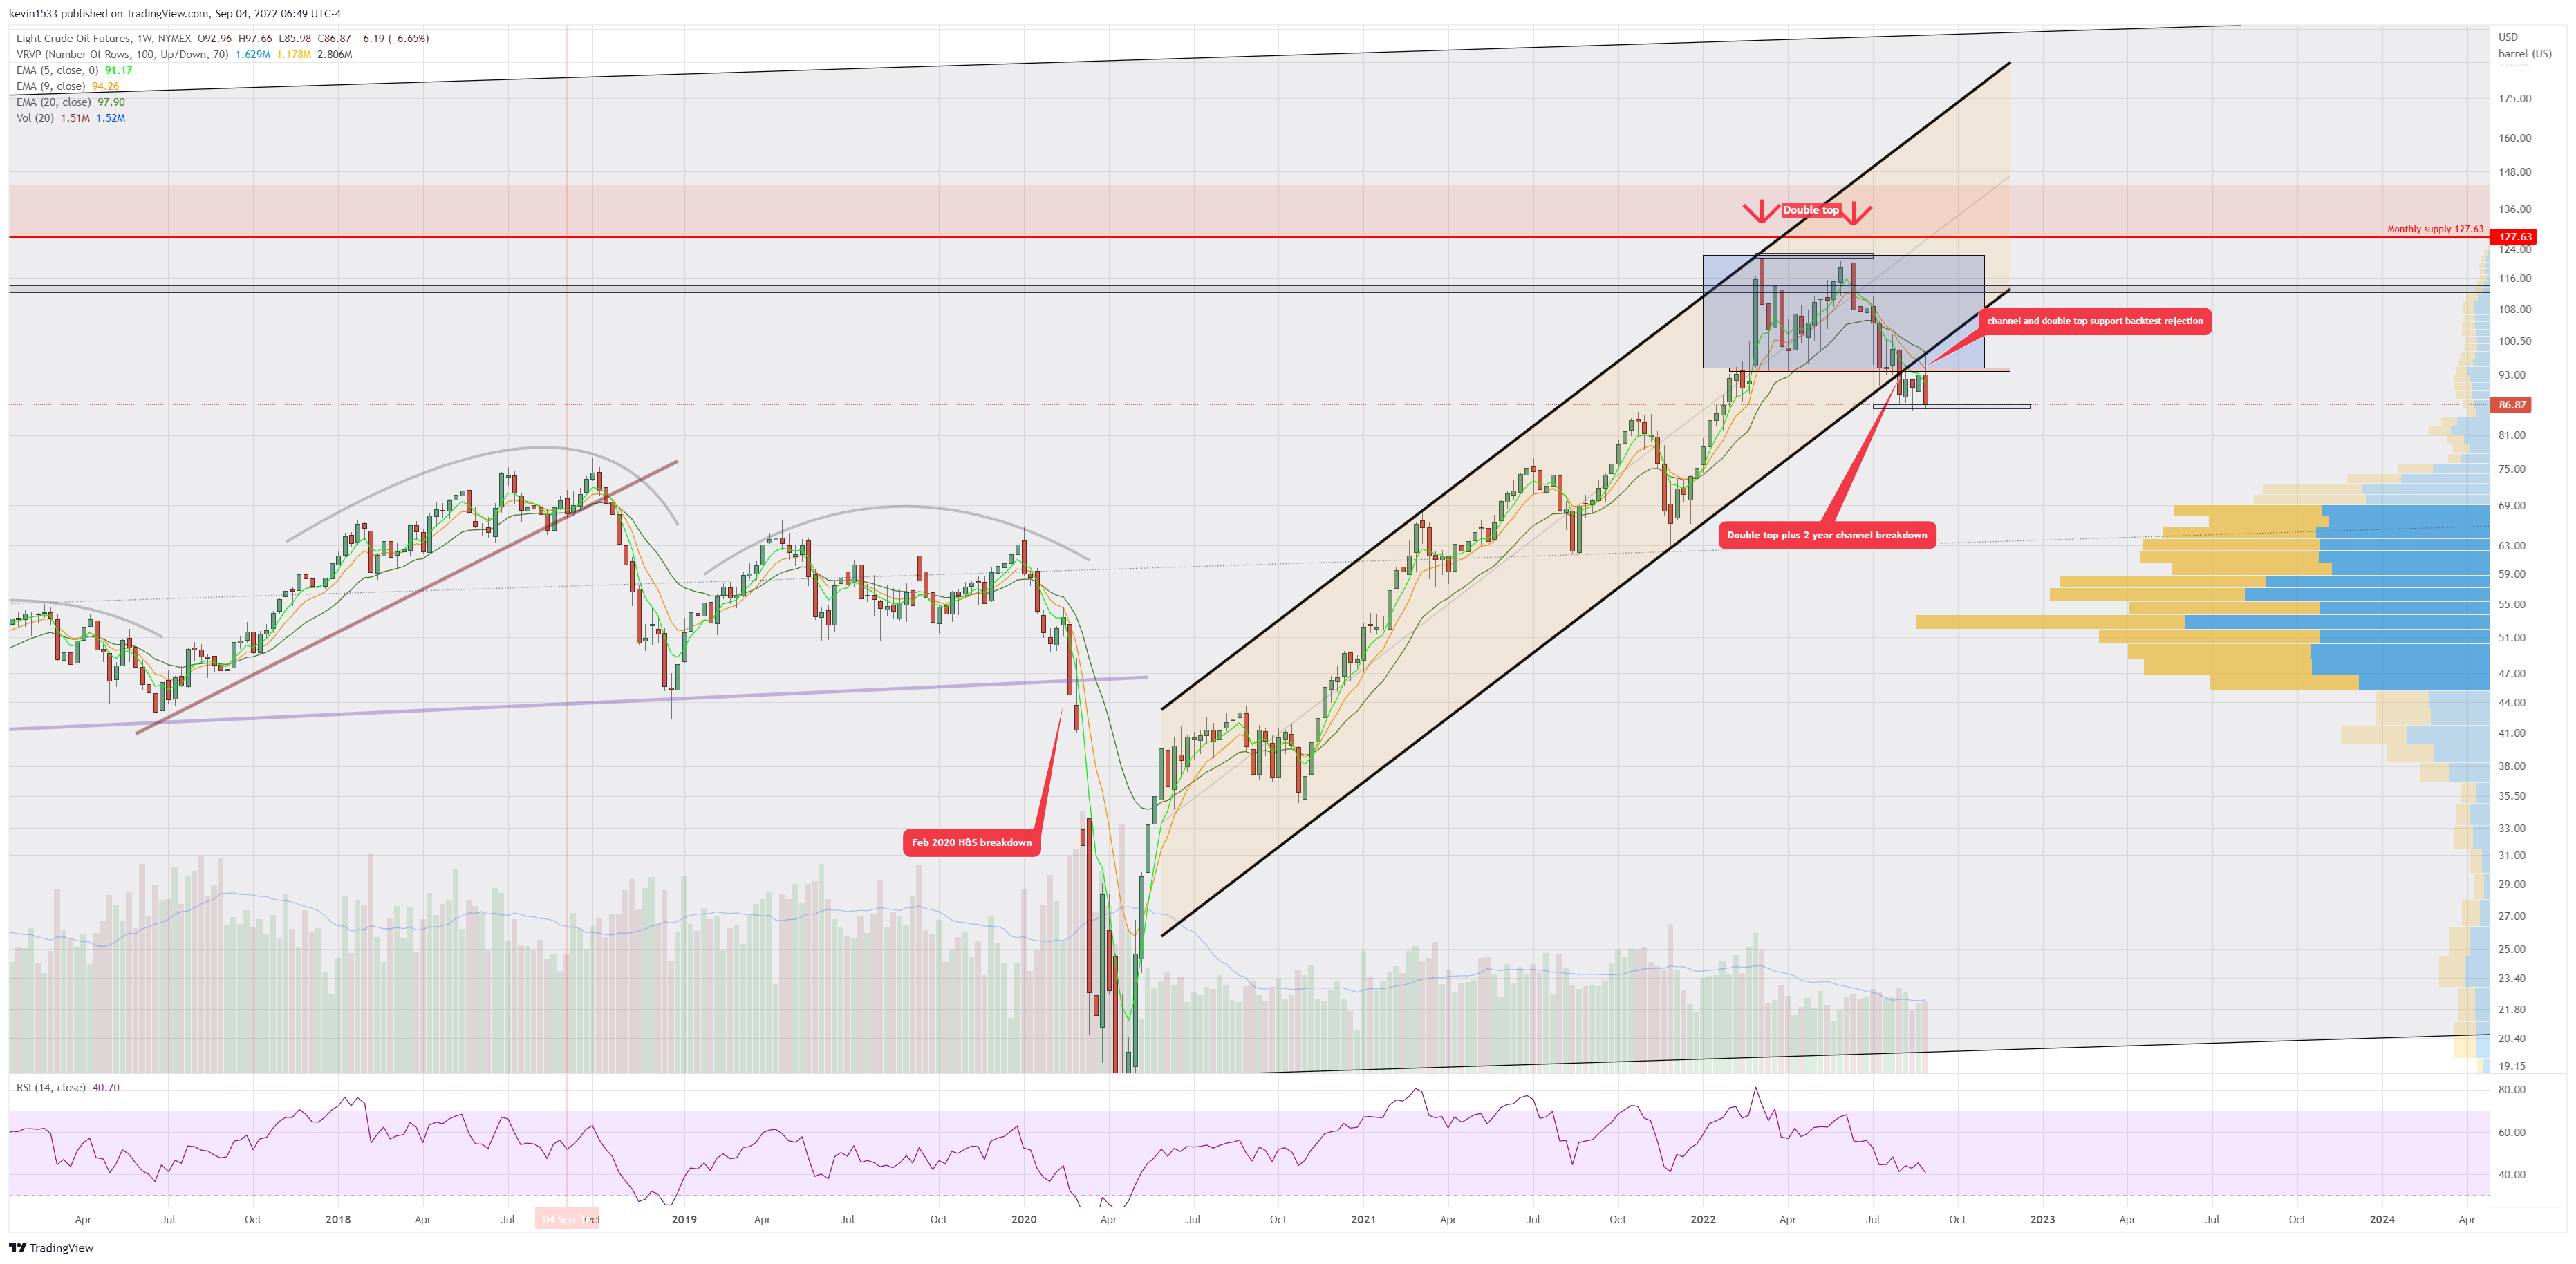
$CL_F (weekly) after the 2 year channel and double top breakdown, we’ve been chopping sideways and now bearish rejection candle after backtesting the double top neckline and channel with weekly 5/9/20ema pushing downward. Looks ready to dump once it breaches current base support.
$XLE (monthly, log scale) Following rejection at short term channel resistance, August candle closed with a spinning top (indecision) so the bearish engulfing candle reversal remains valid and we should expect price to resolve downward and back below the horizontal resistance.

$XLE (weekly) Bearish Harami rejection at channel resistance and .618fib. Watch for bearish confirmation with close back below the horizontal resistance and then uptrend line support below that.

$IBB Biotech (weekly, log scale) Ascending wedge breakdown below weekly converged 5/9/20ema. Now approaching backtest of the base breakout level where we could find support. For things to get really bearish, will need to close below 119.50 support.

$HGX Housing sector (monthly, arithmetic scale) After initially pushing above the purple trendline resistance, rejected off monthly 5/9/20ema and wicked back below the trendline which has been a key inflection point in the past. Consider it a strong resistance with bears in control as long as we are below it.

$HGX (weekly) Previously had the false breakout reversal with close back below horizontal resistance and weekly 5/9/20ema, and now bearish follow-through.

$IYR real estate (weekly, arithmetic scale) Following the H&S backtest rejection, now below weekly 5/9/20ema and sliding below backtest support.

$IYR (daily) closed below horizontal backtest support.

$IYT transportation (monthly, Log scale) inverted hammer rejection at monthly at the box backtest with close below 5/9/20ema.

$IYT (weekly) bearish harami reversal at horizontal backtest and now close below weekly 5/9/20ema.

$SMH semiconductor (monthly, log scale) rejected at monthly 5/9/20ema and currently holding at major channel support.

$SMH (weekly) Following the backtest of the horizontal level which we overshot and came back below, now bears have the control. However we are at the monthly channel support area so it’ll be interesting to see how we close the monthly candle here.

$XLF (weekly) Following the shooting star and Bearish Harami at H&S neckline backtest, we are now at the base breakout backtest support. Closed below 5/9/20ema.

$XLP (weekly, arithmetic scale) closed back below the horizontal resistance where we had breakout previously (false breakout reversal).

$XLV health care (monthly, log scale) closed below the horizontal support zone which has held for over a year, and also close below monthly 5/9/20ema converged which could swing momentum downward soon. This is a major change in character in a sector that has remained stable and could be foreshadowing major market weakness in the near future. Potential is there.

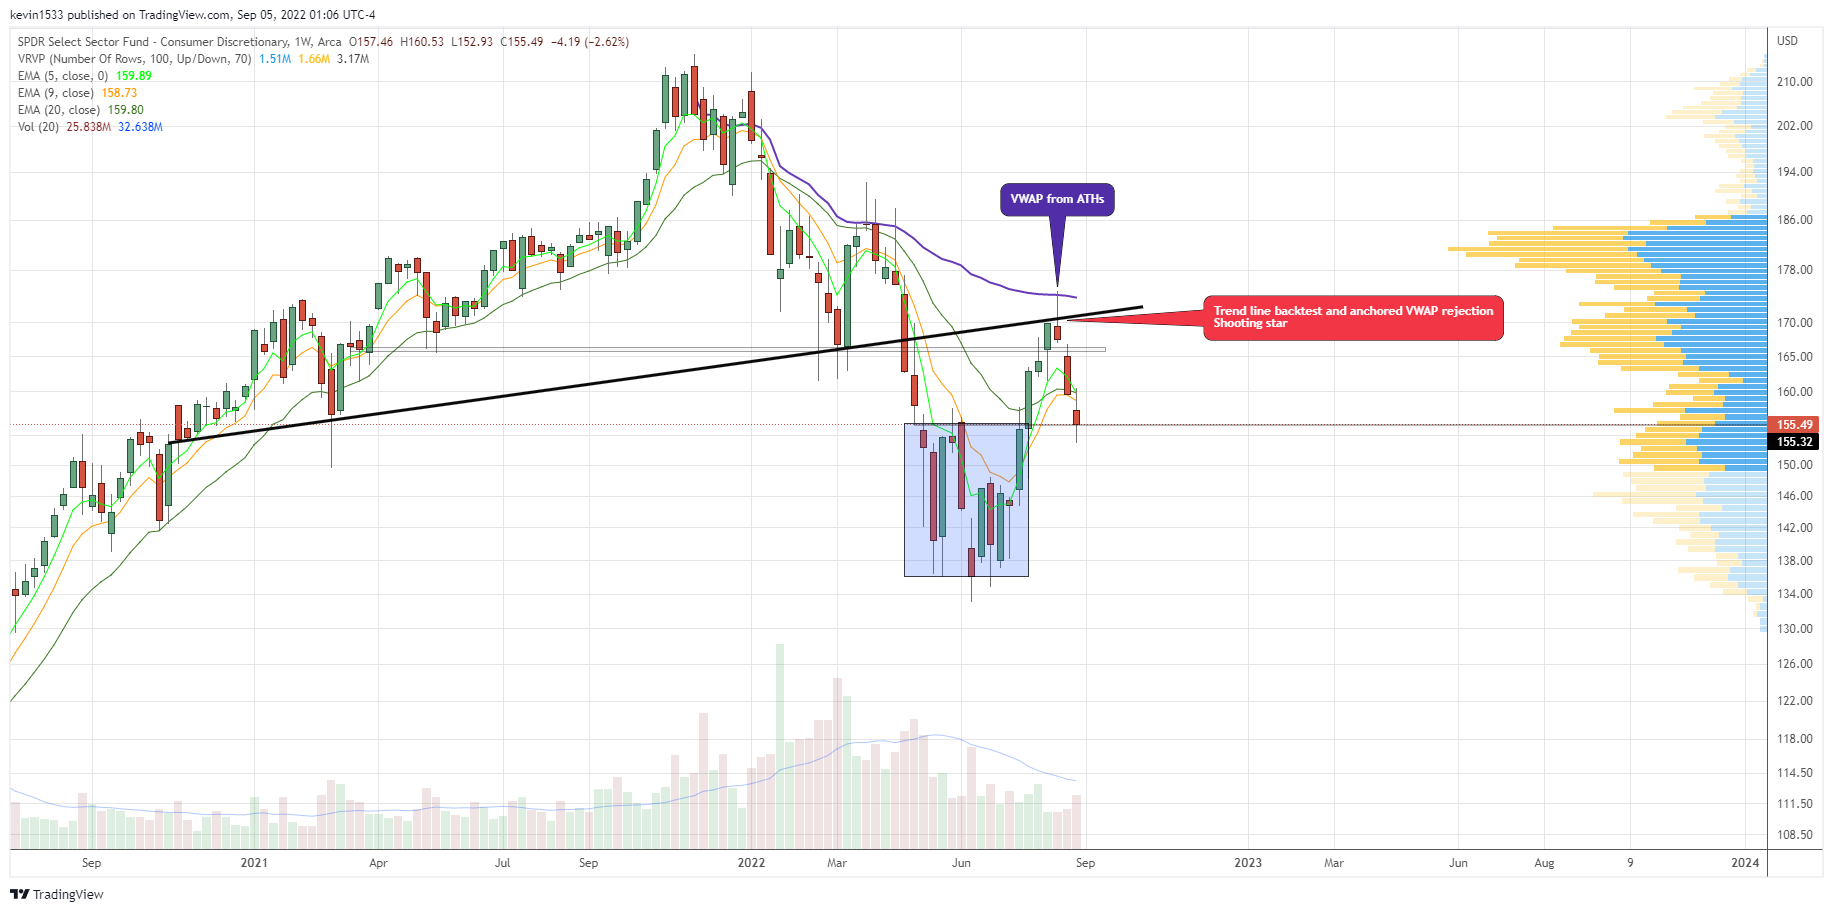
$XLY consumer discretionary (weekly, log scale) Currently holding base breakout backtest support. Below weekly 5/9/20ema.
$KWEB (weekly, log scale) rejecting at the bearflag backtest with weekly 5/9/20ema converged. As long as price does not break back above the bearflag, we could see price start the measured move of the bearflag breakdown.

$HYG high yield corp bond (monthly, log scale) Bulls could not capitalize on the inside up move above the July candle highs and failed back below and closed below the mid point of the July candle body. It was also a backtest rejection at the red uptrend line. Now we are looking to test the major blue channel support. If we get further weakness in the market this month, then we could see this support breach and that would be a major warning for potential sell-off in the market.

$BTC (weekly, log scale) bearflag breakdown and consolidating sideways. Prior ATH resistance where we found support will likely be tested again and likely does not hold for long.

Most of the setups are demand/long setups. Remember you can have a higher time frame bearish/bullish outlook in the market and still daytrade these levels in the opposite direction when they trigger for intraday gains. Remember you don’t have take every setup but knowing that you have plenty of solid setups to fall back on will make you more disciplined and avoid chop/weak/boredom trades. (Do not waste time looking for a trade or watching intraday 5/15min candles hoping for something to happen. Find a setup, set alerts, and forget about it until it triggers) Make sure to review prior triggered setups and see how they react. Also, if $SPY and the rest of the market is selling off aggressively and you are uncertain/confused – BEST to pass on long plays (or short plays if market is on an aggressive rally) or narrow focus onto just trading $SPY or sitting on hands . 1st Goal is to not lose money.
$BABA (daily) long setup at 83.72

$BAC (4H) long setup at 30.09

$BIDU (daily) long setup at 120.15

$BLNK (daily) long setup at 18.15

$C (daily) long setup at 44.48

$CCL (daily) long setup at 8.01

$CMG (daily) short setup at 1746

$COST (4h) long setup at 514.09

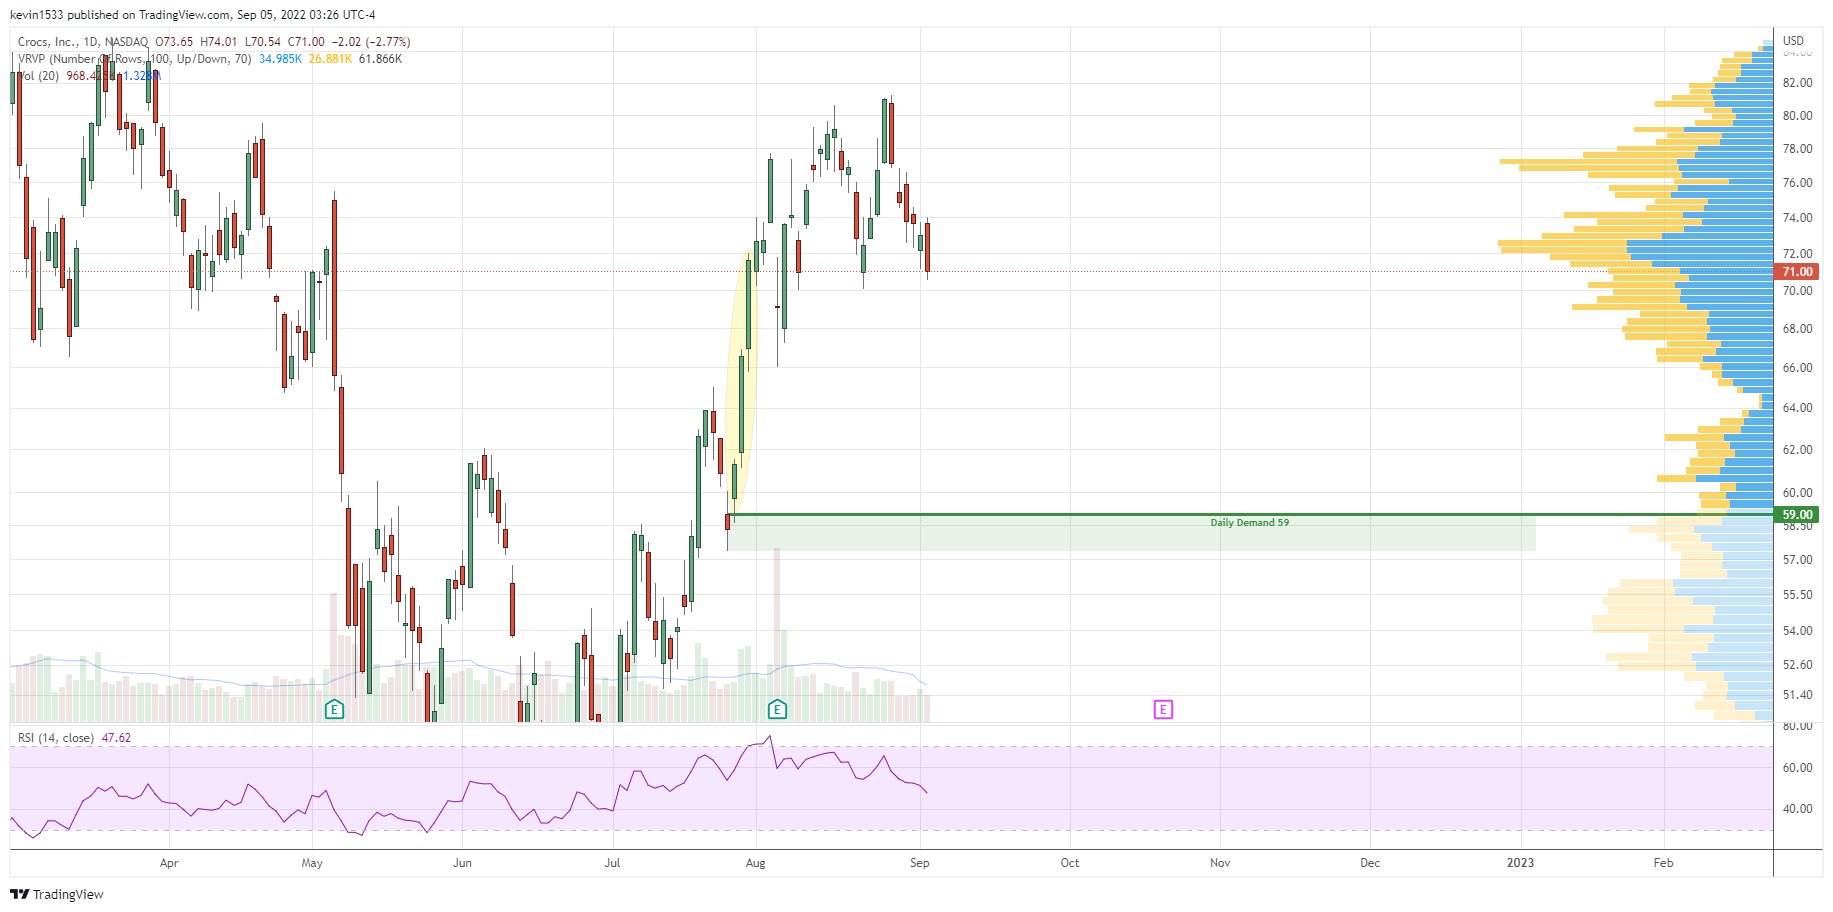
$CROX (daily) long setup at 59
$CVS (daily) long setup at 96.21

$DDOG (daily) long setup at 89.35

$DOCU (daily) long setup at 47.48

$F (daily) long setup at 12.68

$FDX (daily) long setup at 201.50

$GM (daily) long setup at 34.03

$GME (daily) long setup at 23.51

$GOOGL (daily) long setup at 106.60

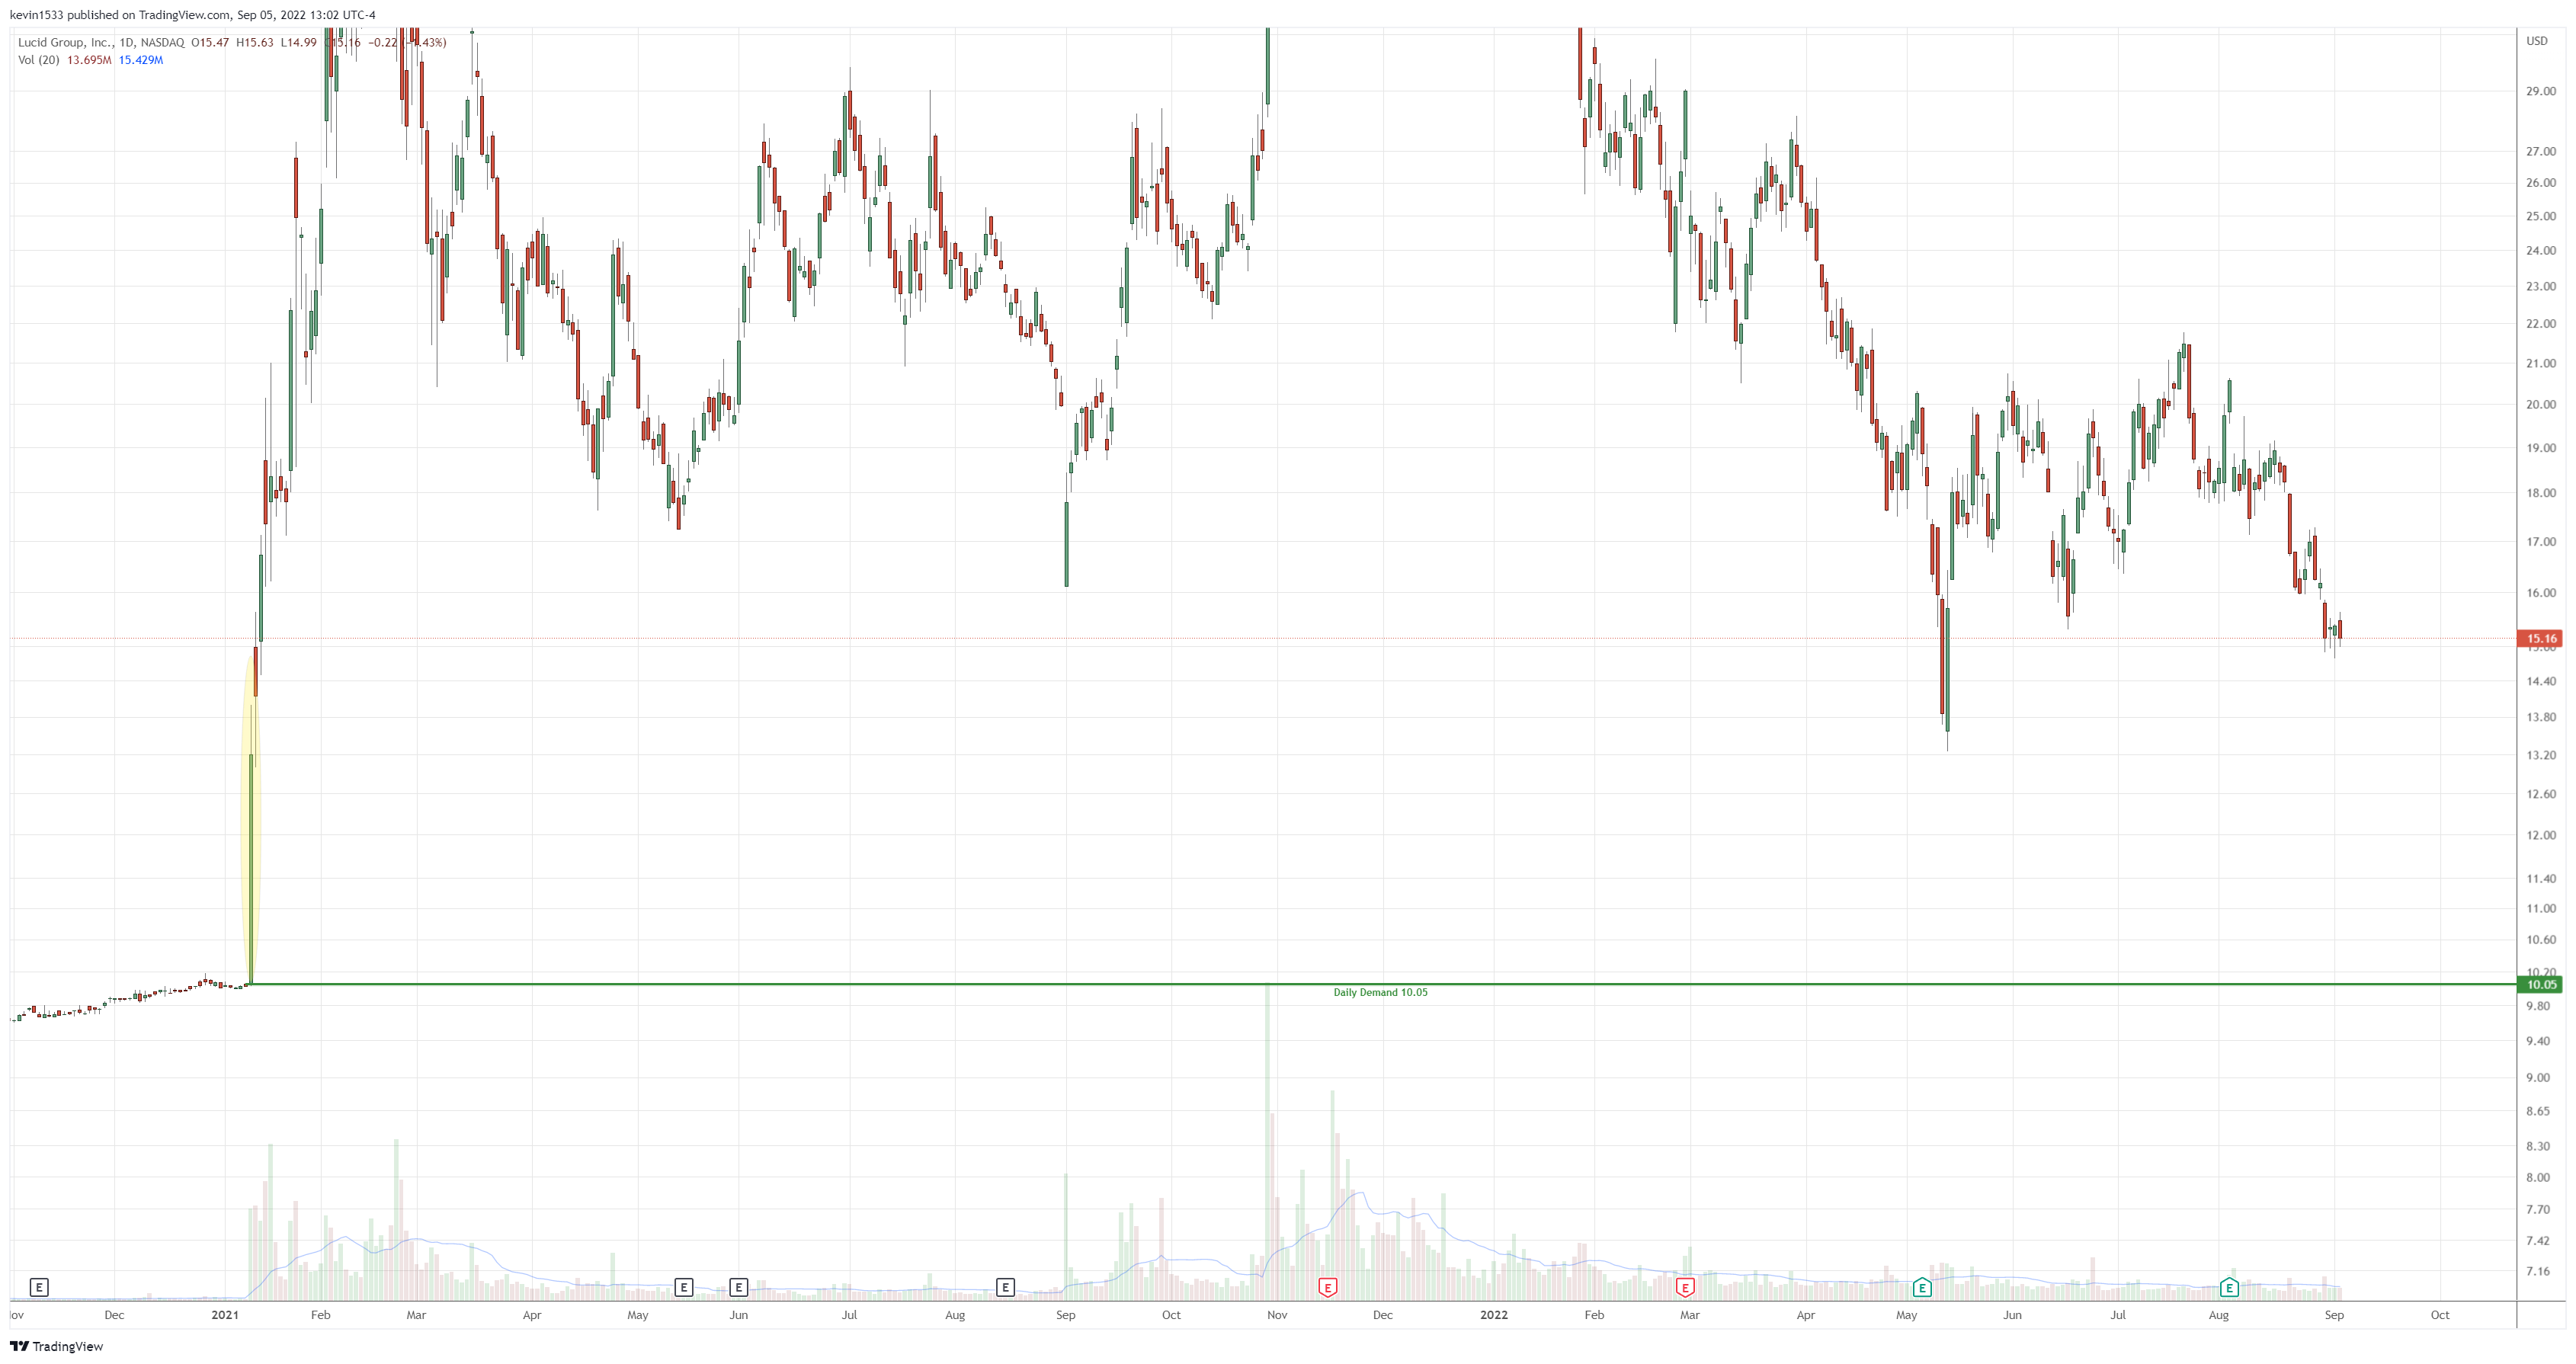
$LCID (daily) long setup at 10.05
$LMT (daily) long setup at 400.18

$LULU (daily) short setup at 352.78

$LVS (daily) long setup at 34.92

$MGM (daily) long setup at 30.59

$MTCH (daily) short setup at 64.50

$NFLX (daily) long setup at 192.50

$OSTK (daily) long setup at 22.46

$PFE (daily) short setup at 47.52 and long setup at 44.29

$PINS (daily) long setup at 21.11 and 17.53

$STX (daily) long setup at 60.51

$TDOC (daily) long setup at 23.10

$TLRY (daily) Long setup at 2.80

All the images are in high resolution. If they appear small, try right clicking on the image and open in new tab or window to expand fully.