$SPY weekly bearish engulfing of prior 2 candles (hanging man and doji) so reversal signal is confirmed. And considering it just rejected off multiple layers of channel resistances, this should be short-term top. Weekly 5/9ema and MACD ready to bearcross so there is potential for strong follow-through if bears decide to take advantage.

$SPY (daily) so far we got the double top rejection at the channel resistances with bearish engulfing down to double top breakdown Friday. Below short term moving averages (5/10/20dma and ema) which many traders will use as support and means to stay in a long position. So these moving averages “should” now act as resistance to sell into on rallies just as we saw during the September pullback.

$SPY Monthly as expected wicked back below the 12 year channel resistance as well spanning from 2009. Currently a shooting star with negative RSI divergence. Monthly candle closes on Tuesday and if it holds current shooting star, that would be a potential top reversal signal. MACD has potential to cross on further downside in December and that could lead to strong momentum to the downside. Last time MACD bear crossed was during the Feb 2020 crash.

$QQQ (daily) from failed breakout reversal to follow-through to the downside. 5/9/20ema converged so momentum is there for the bears to push strong.

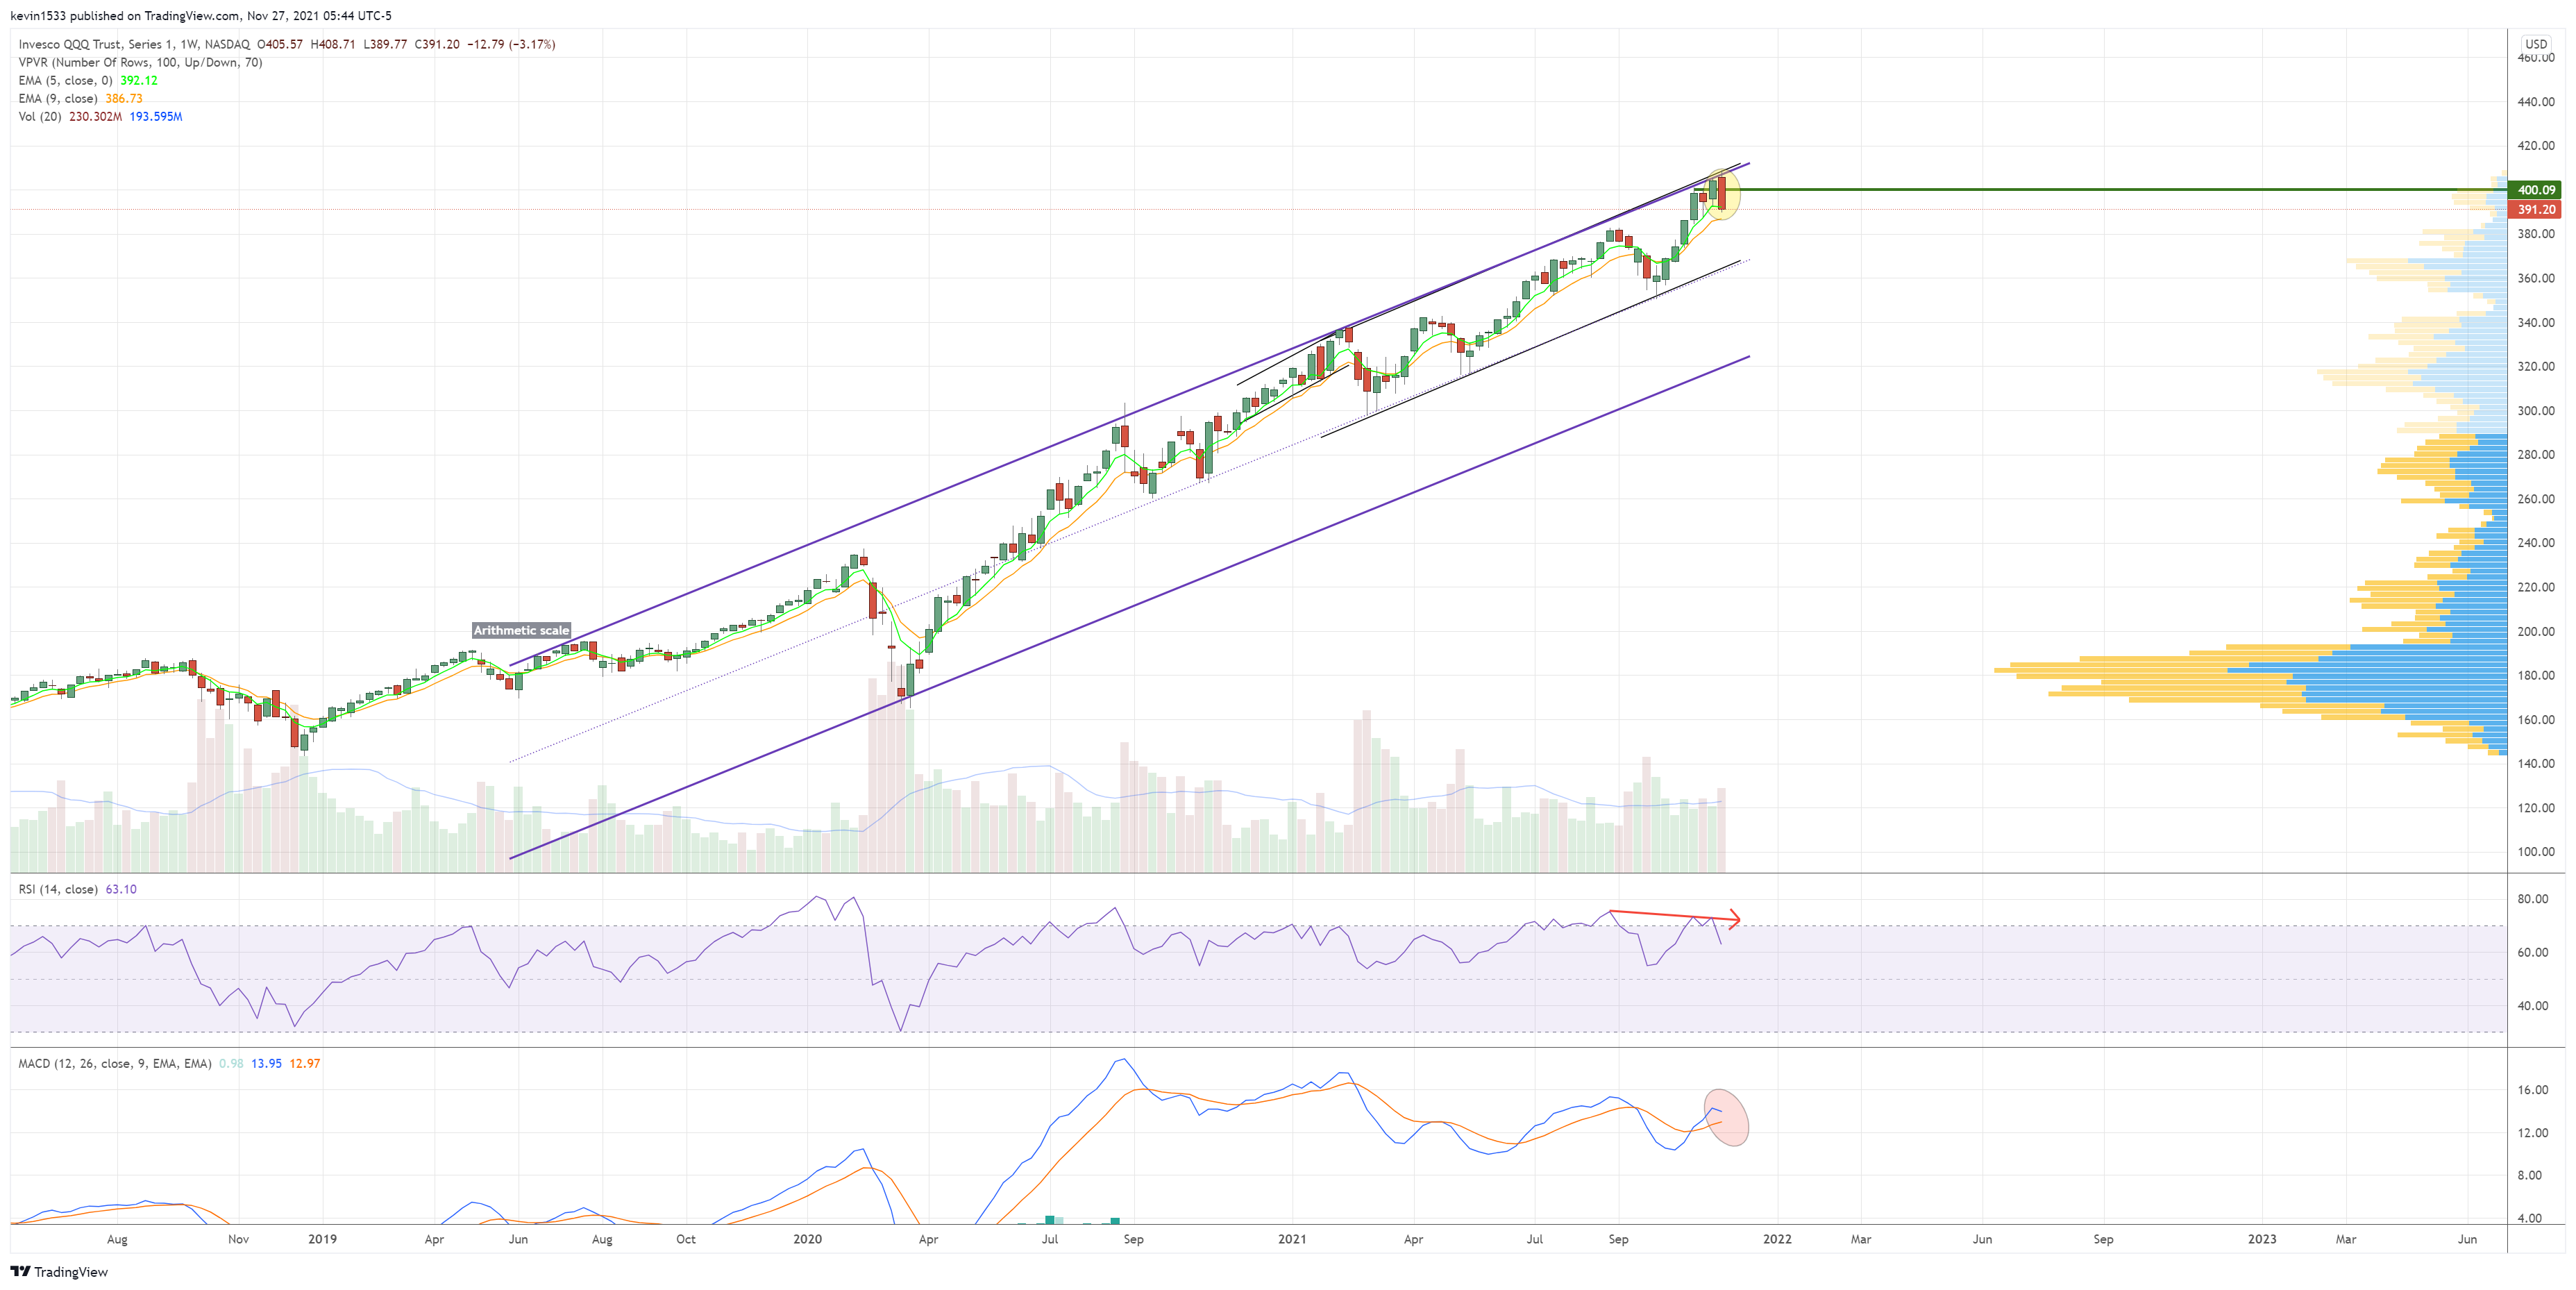
$QQQ (weekly) bearish engulfing at ATHs following rejection at major channel with negative RSI divergence. MACD ready to bearcross so there is strong potential for follow-through
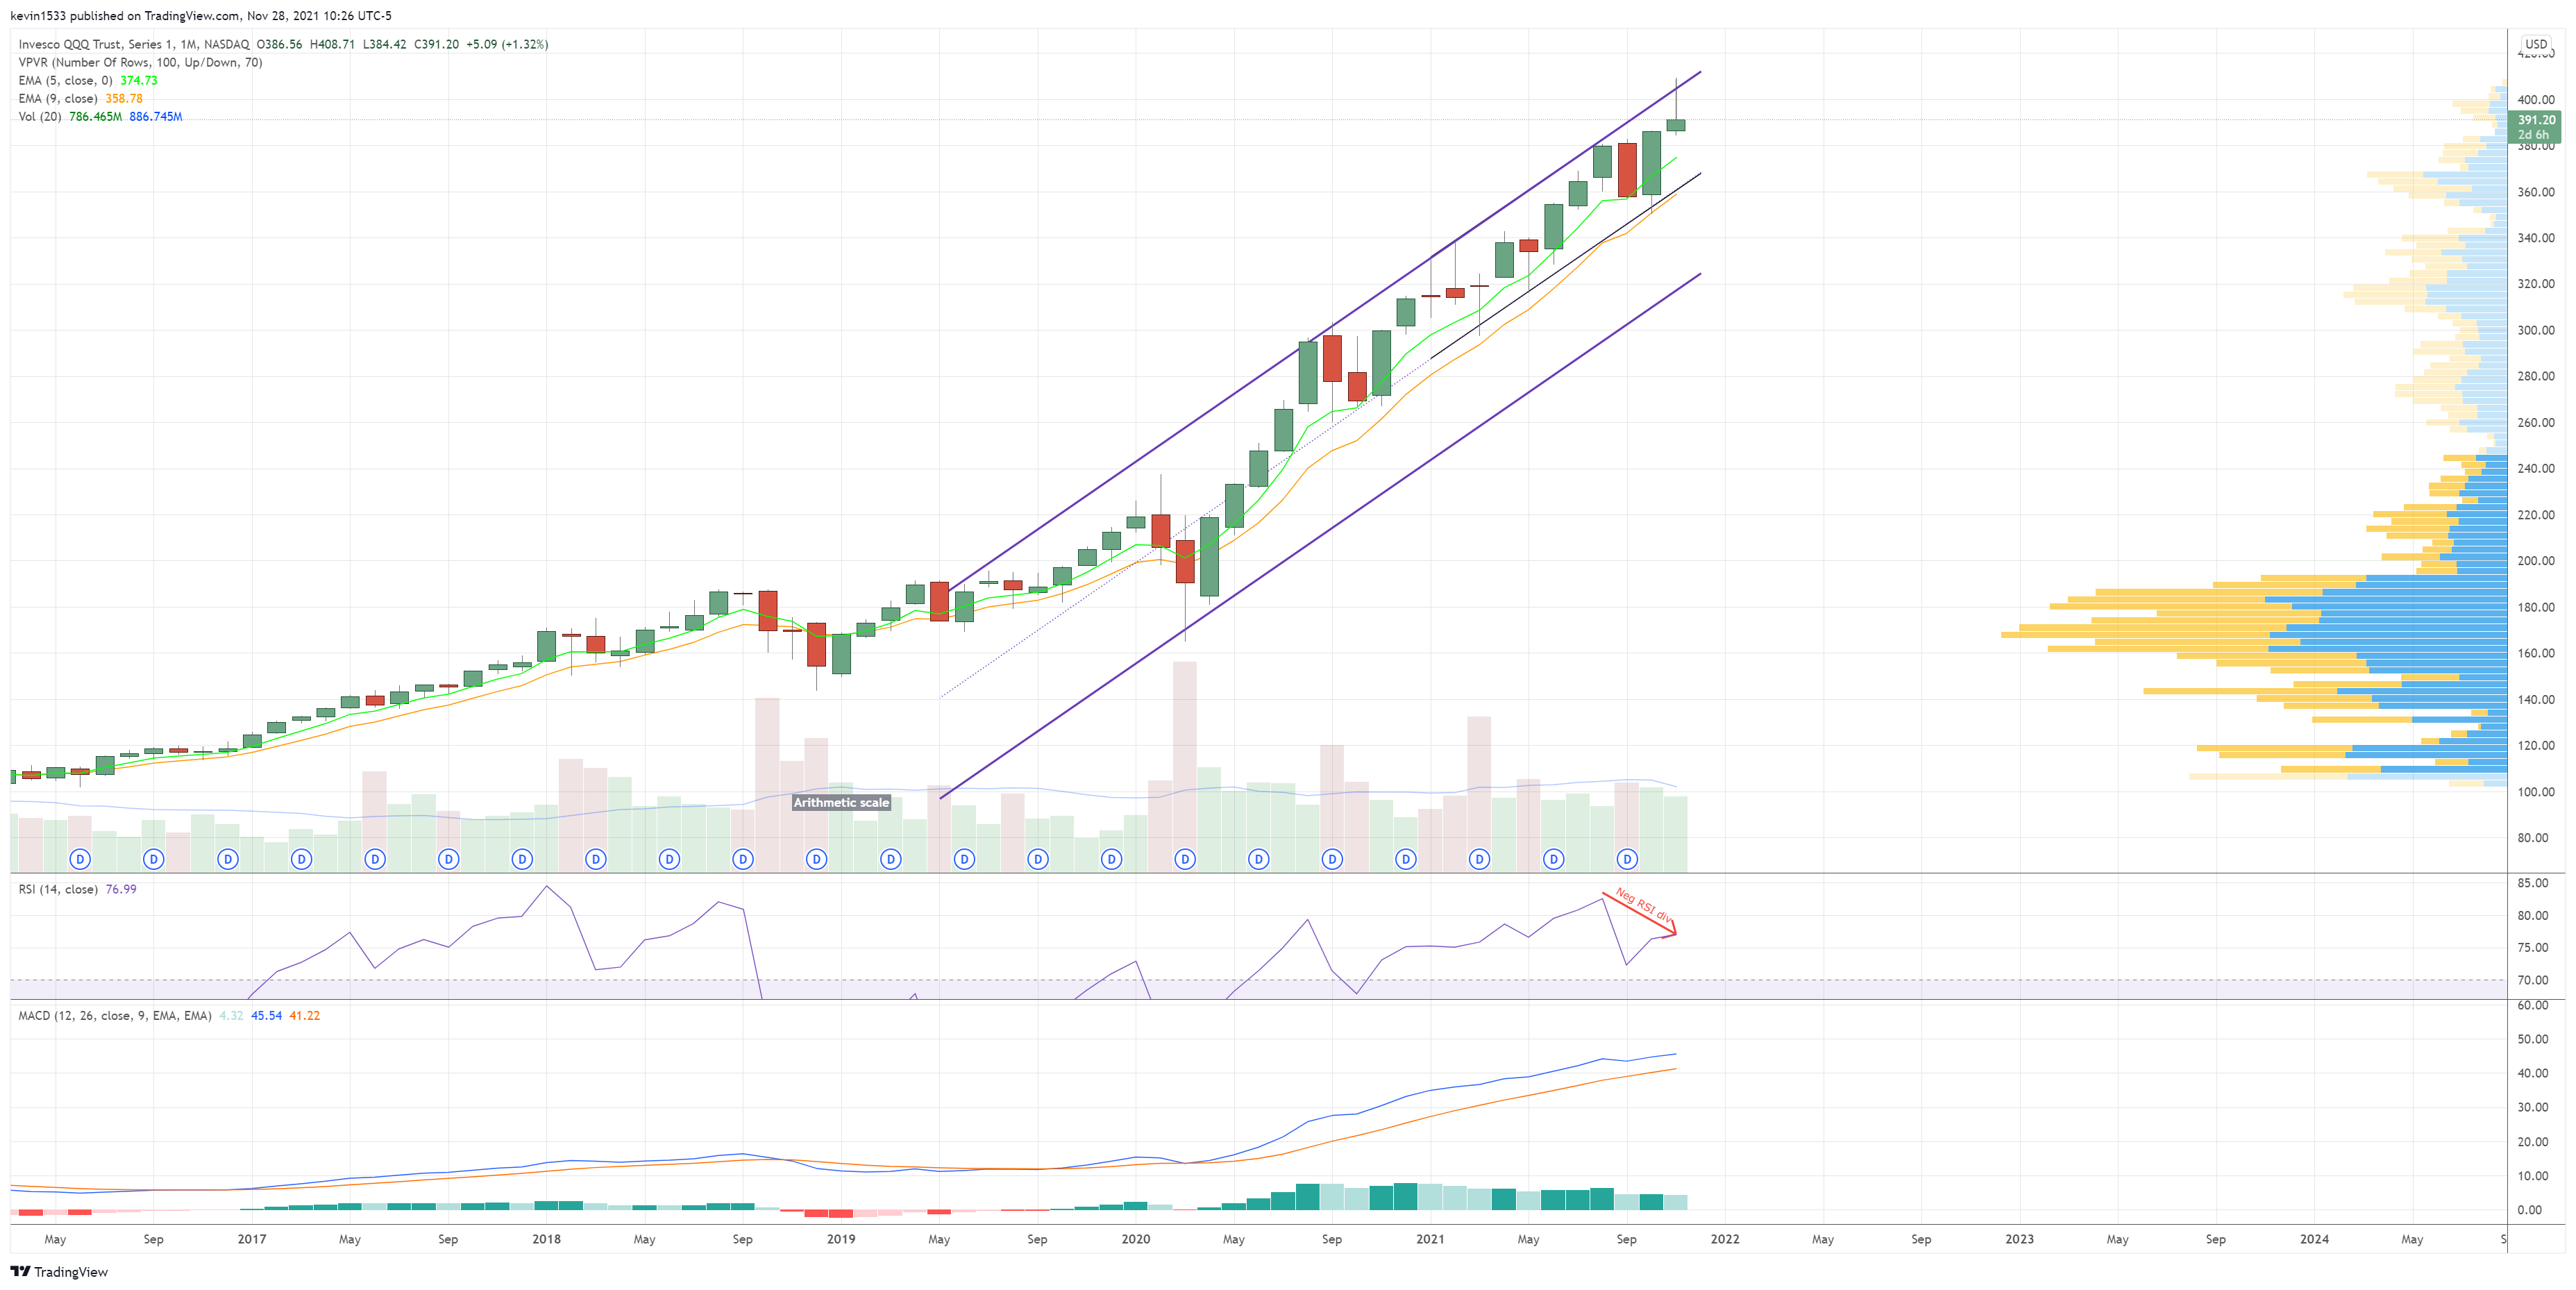
$QQQ monthly shooting star atm. Monthly candles close on tuesday
$IWM (monthly) at lifetime channel resistance. Neg RSI divergence. MACD ready to bearcross.

$IWM (weekly) false breakout reversal

$DJI (weekly) false breakout reversal following channel rejection 3 weeks. Closed below weekly 5/9/20ema converged.

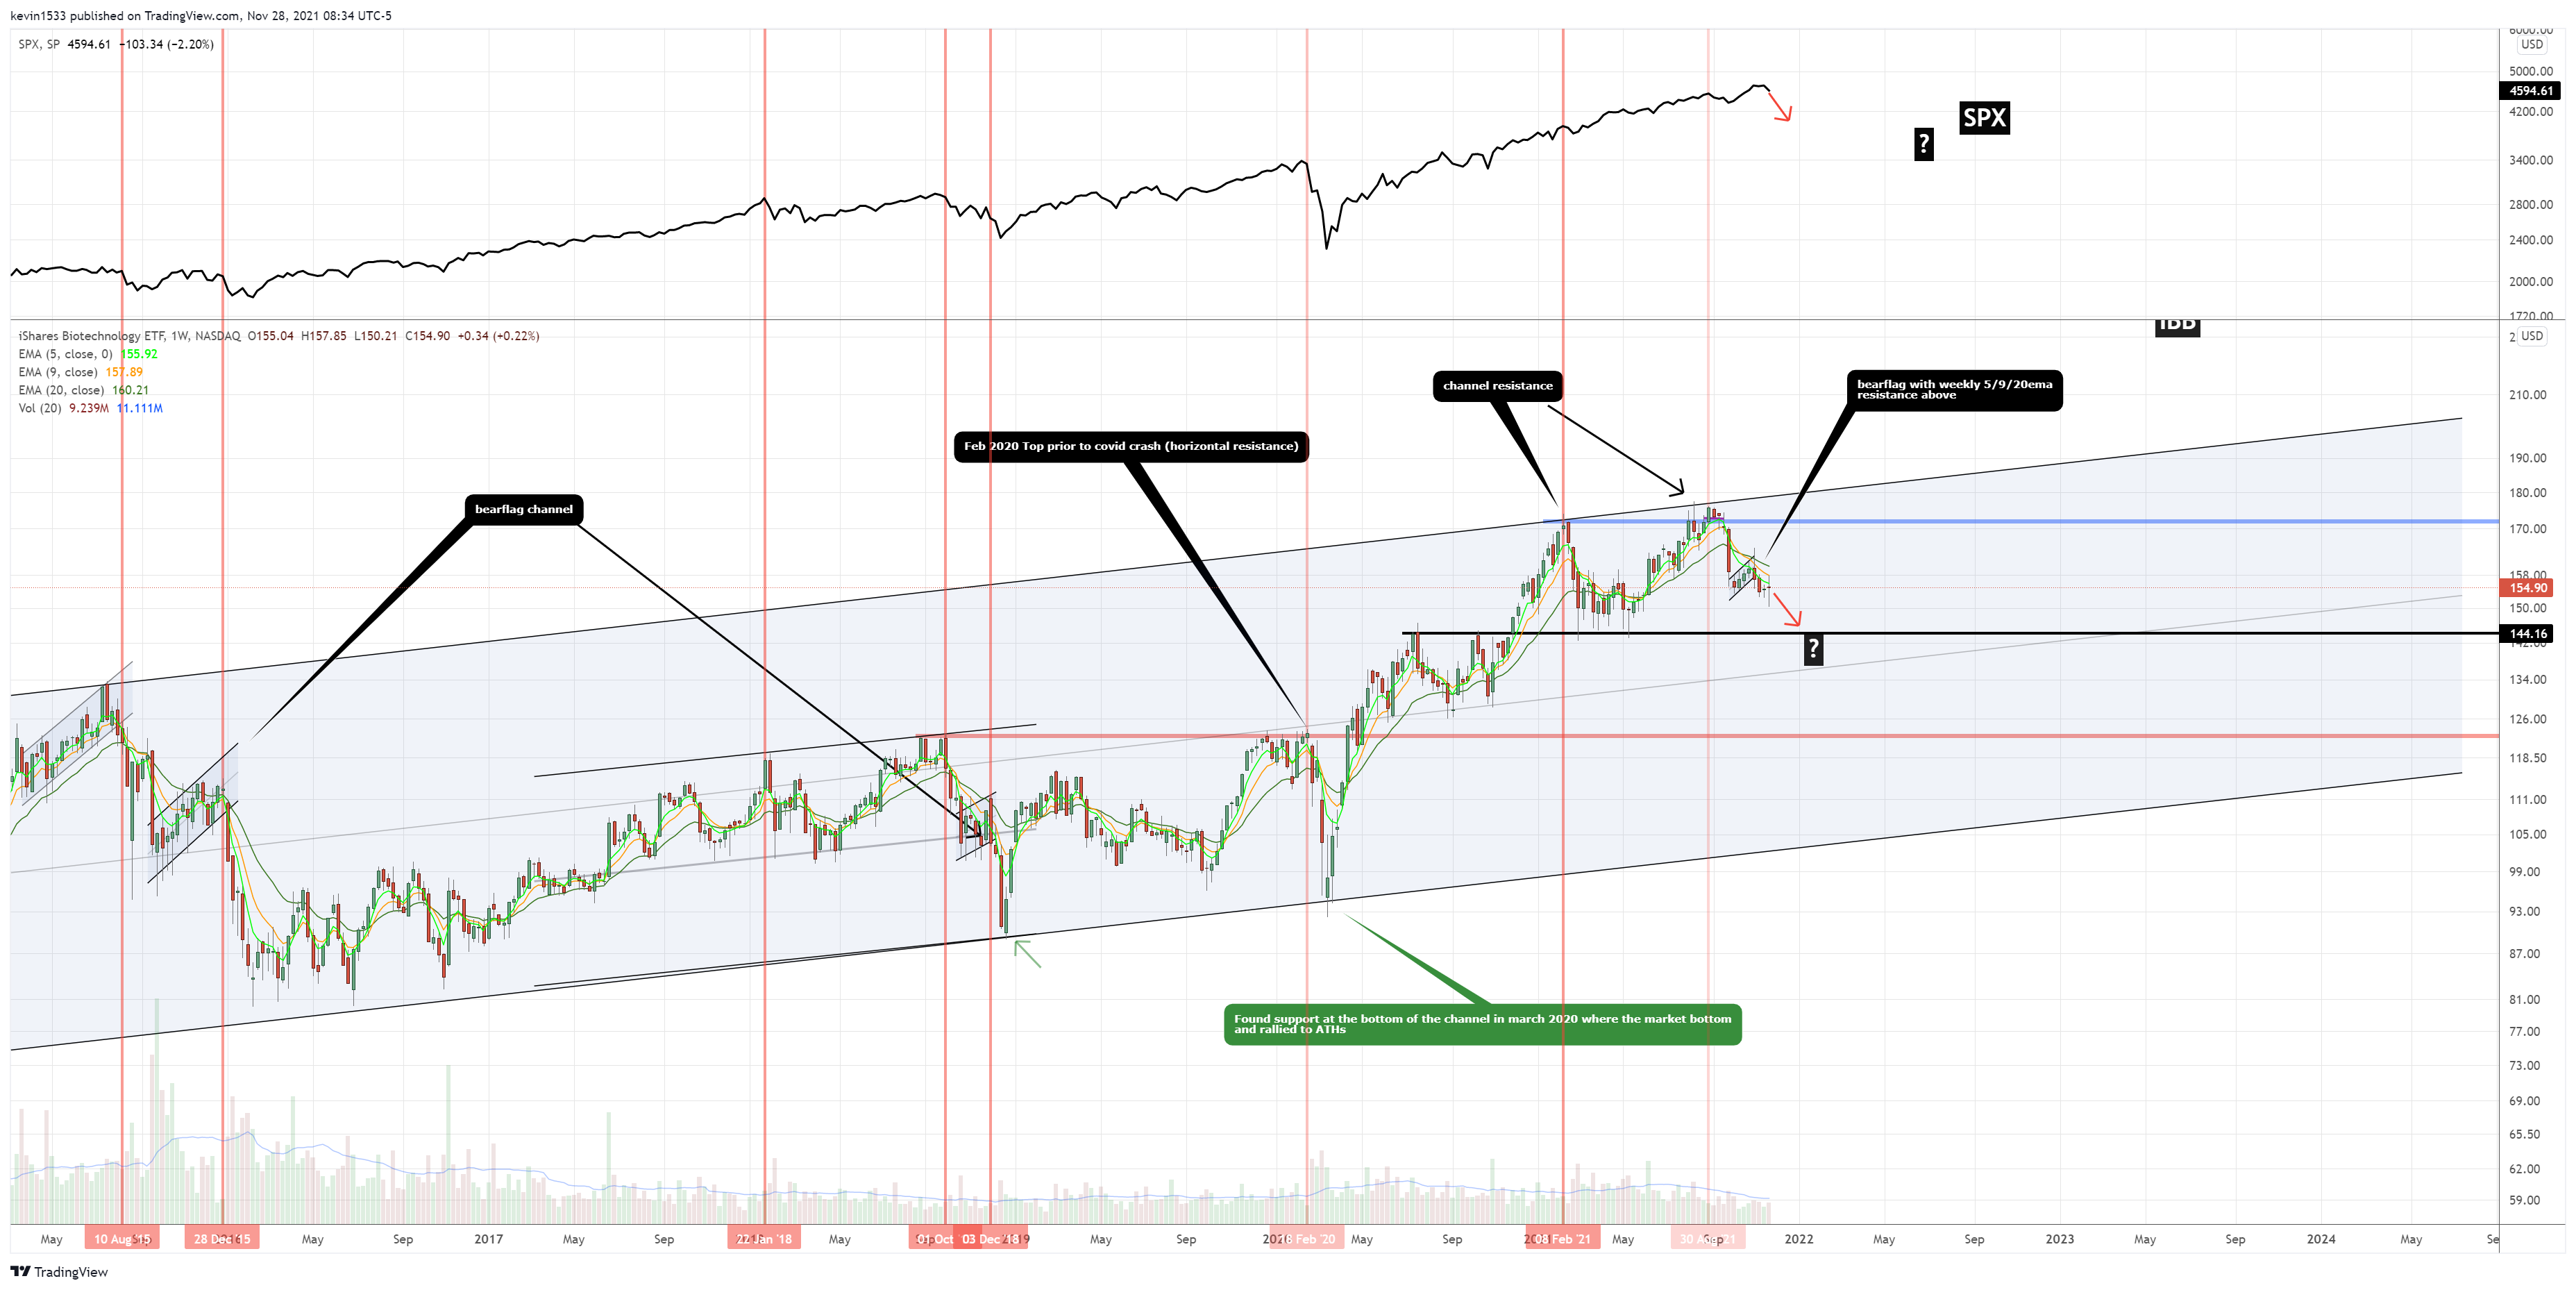
$IBB biotech (daily) bearflag breakdown and consolidating below.
$IYR Real estate (weekly) double top at channel + channel resistance. Following 4 weeks of mostly doji (indecision) candles, finally bearish red candle closing near the lows

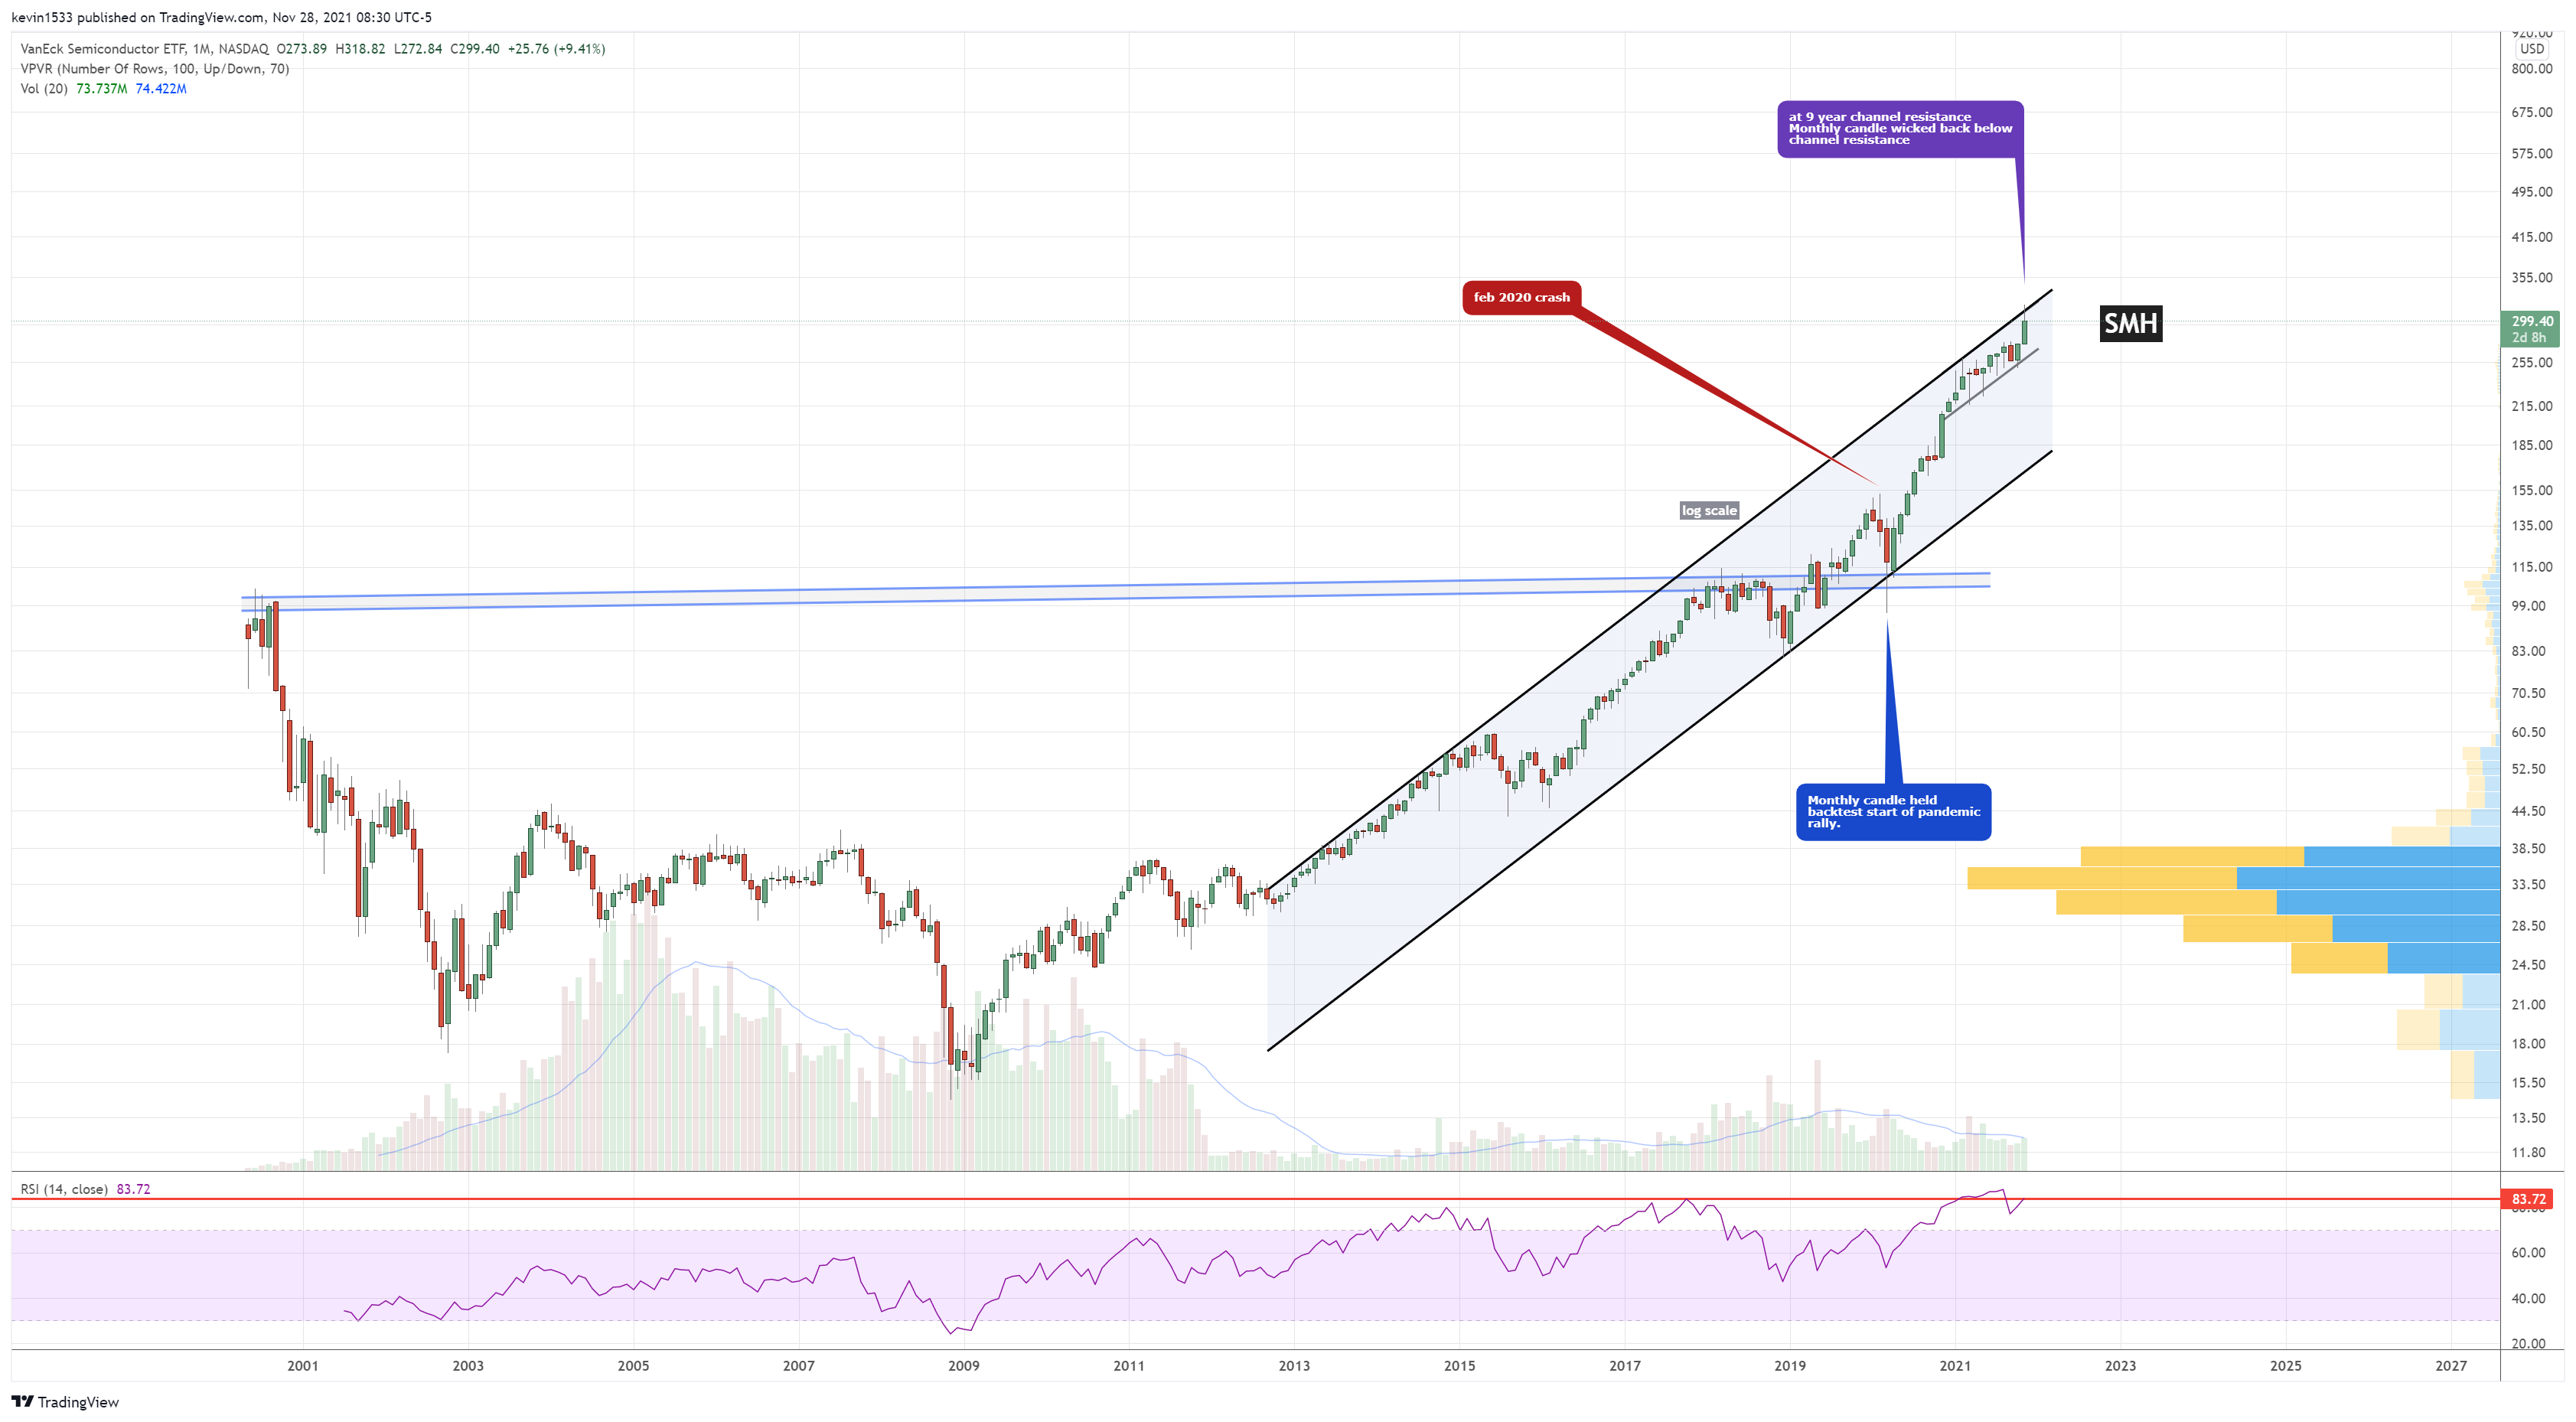
$SMH semiconductor (monthly) Mentioned last week that we were sitting at 9 year channel resistance with RSI still at historic highs. Wicked back below channel with RSI divergence in play.
$SMH (weekly) Bearish engulfing reversal signal.

$XLE Energy(monthly) one of the hottest sectors last month, respecting and rejecting at dual resistance.

$XLF financial (weekly) following breakout, we had the rejection at channel. And now back to back weeks confirming false breakout reversal.

$XLP consumer staples (weekly) double top. Hanging man to bearish confirmation

$XLY (weekly) Bearish engulfing at channel resistance

$CL from previous Sunday newsletter

$CL (weekly) with the false out reversal and not surprisingly the $SPY finally showed weakness with a solid pullback.

$HYG High yield corp bonds (weekly) breakdown from wedge prior week and now follow-through.

$HYG (weekly) going back in history

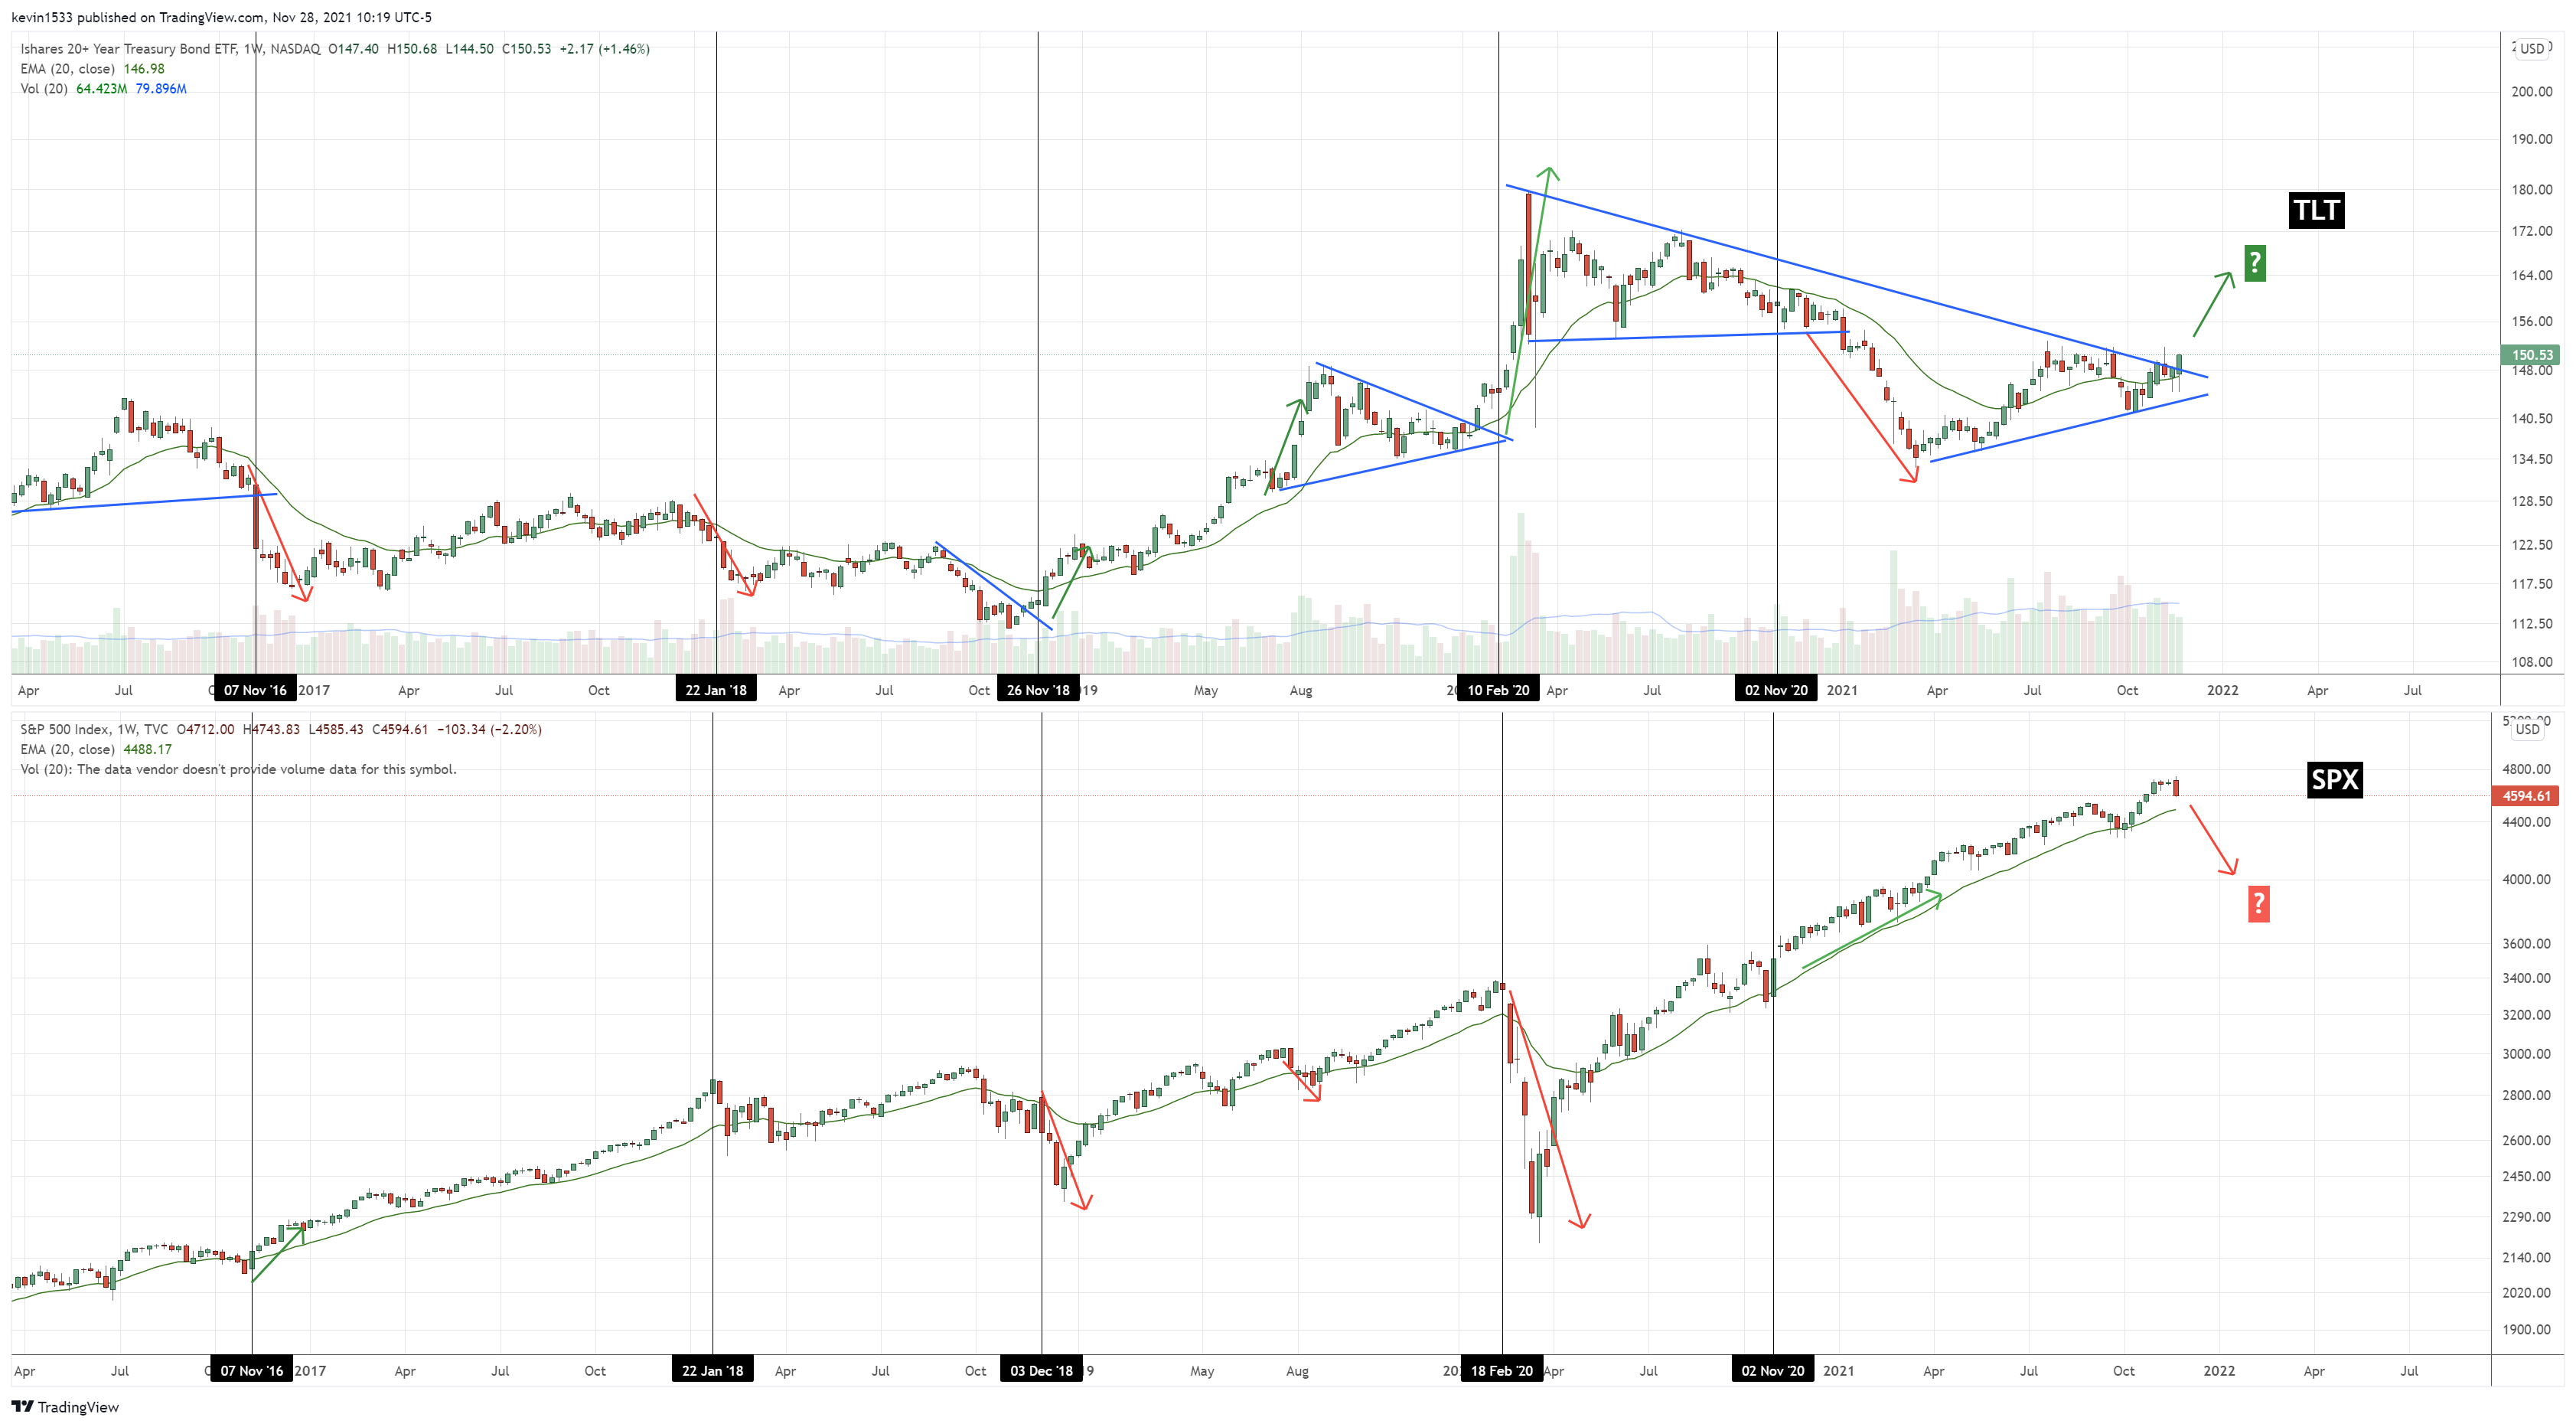
$TLT Weekly breakout of downtrend line and coil. May be flight to safety while the market finally reverses downward.
$DXY (weekly) closed with a doji but held above the resistance level for now.

$VIX (weekly) potential breakout. Considering all the charts that are bearishly align following the recent melt up, its only fitting. There is potential for a very bearish month.


$AAPL (daily) shooting star reversal at channel resistance with follow-though close down below prior ATHs.

$MSFT (weekly) bearish engulfing at channel resistance

$GOOGL (weekly) following 3 weeks of toppy candles (hanging man x2, doji), Bearish confirmation off channel resistance and RSI

$AMZN (weekly) Bearish engulfing reversal following double top.

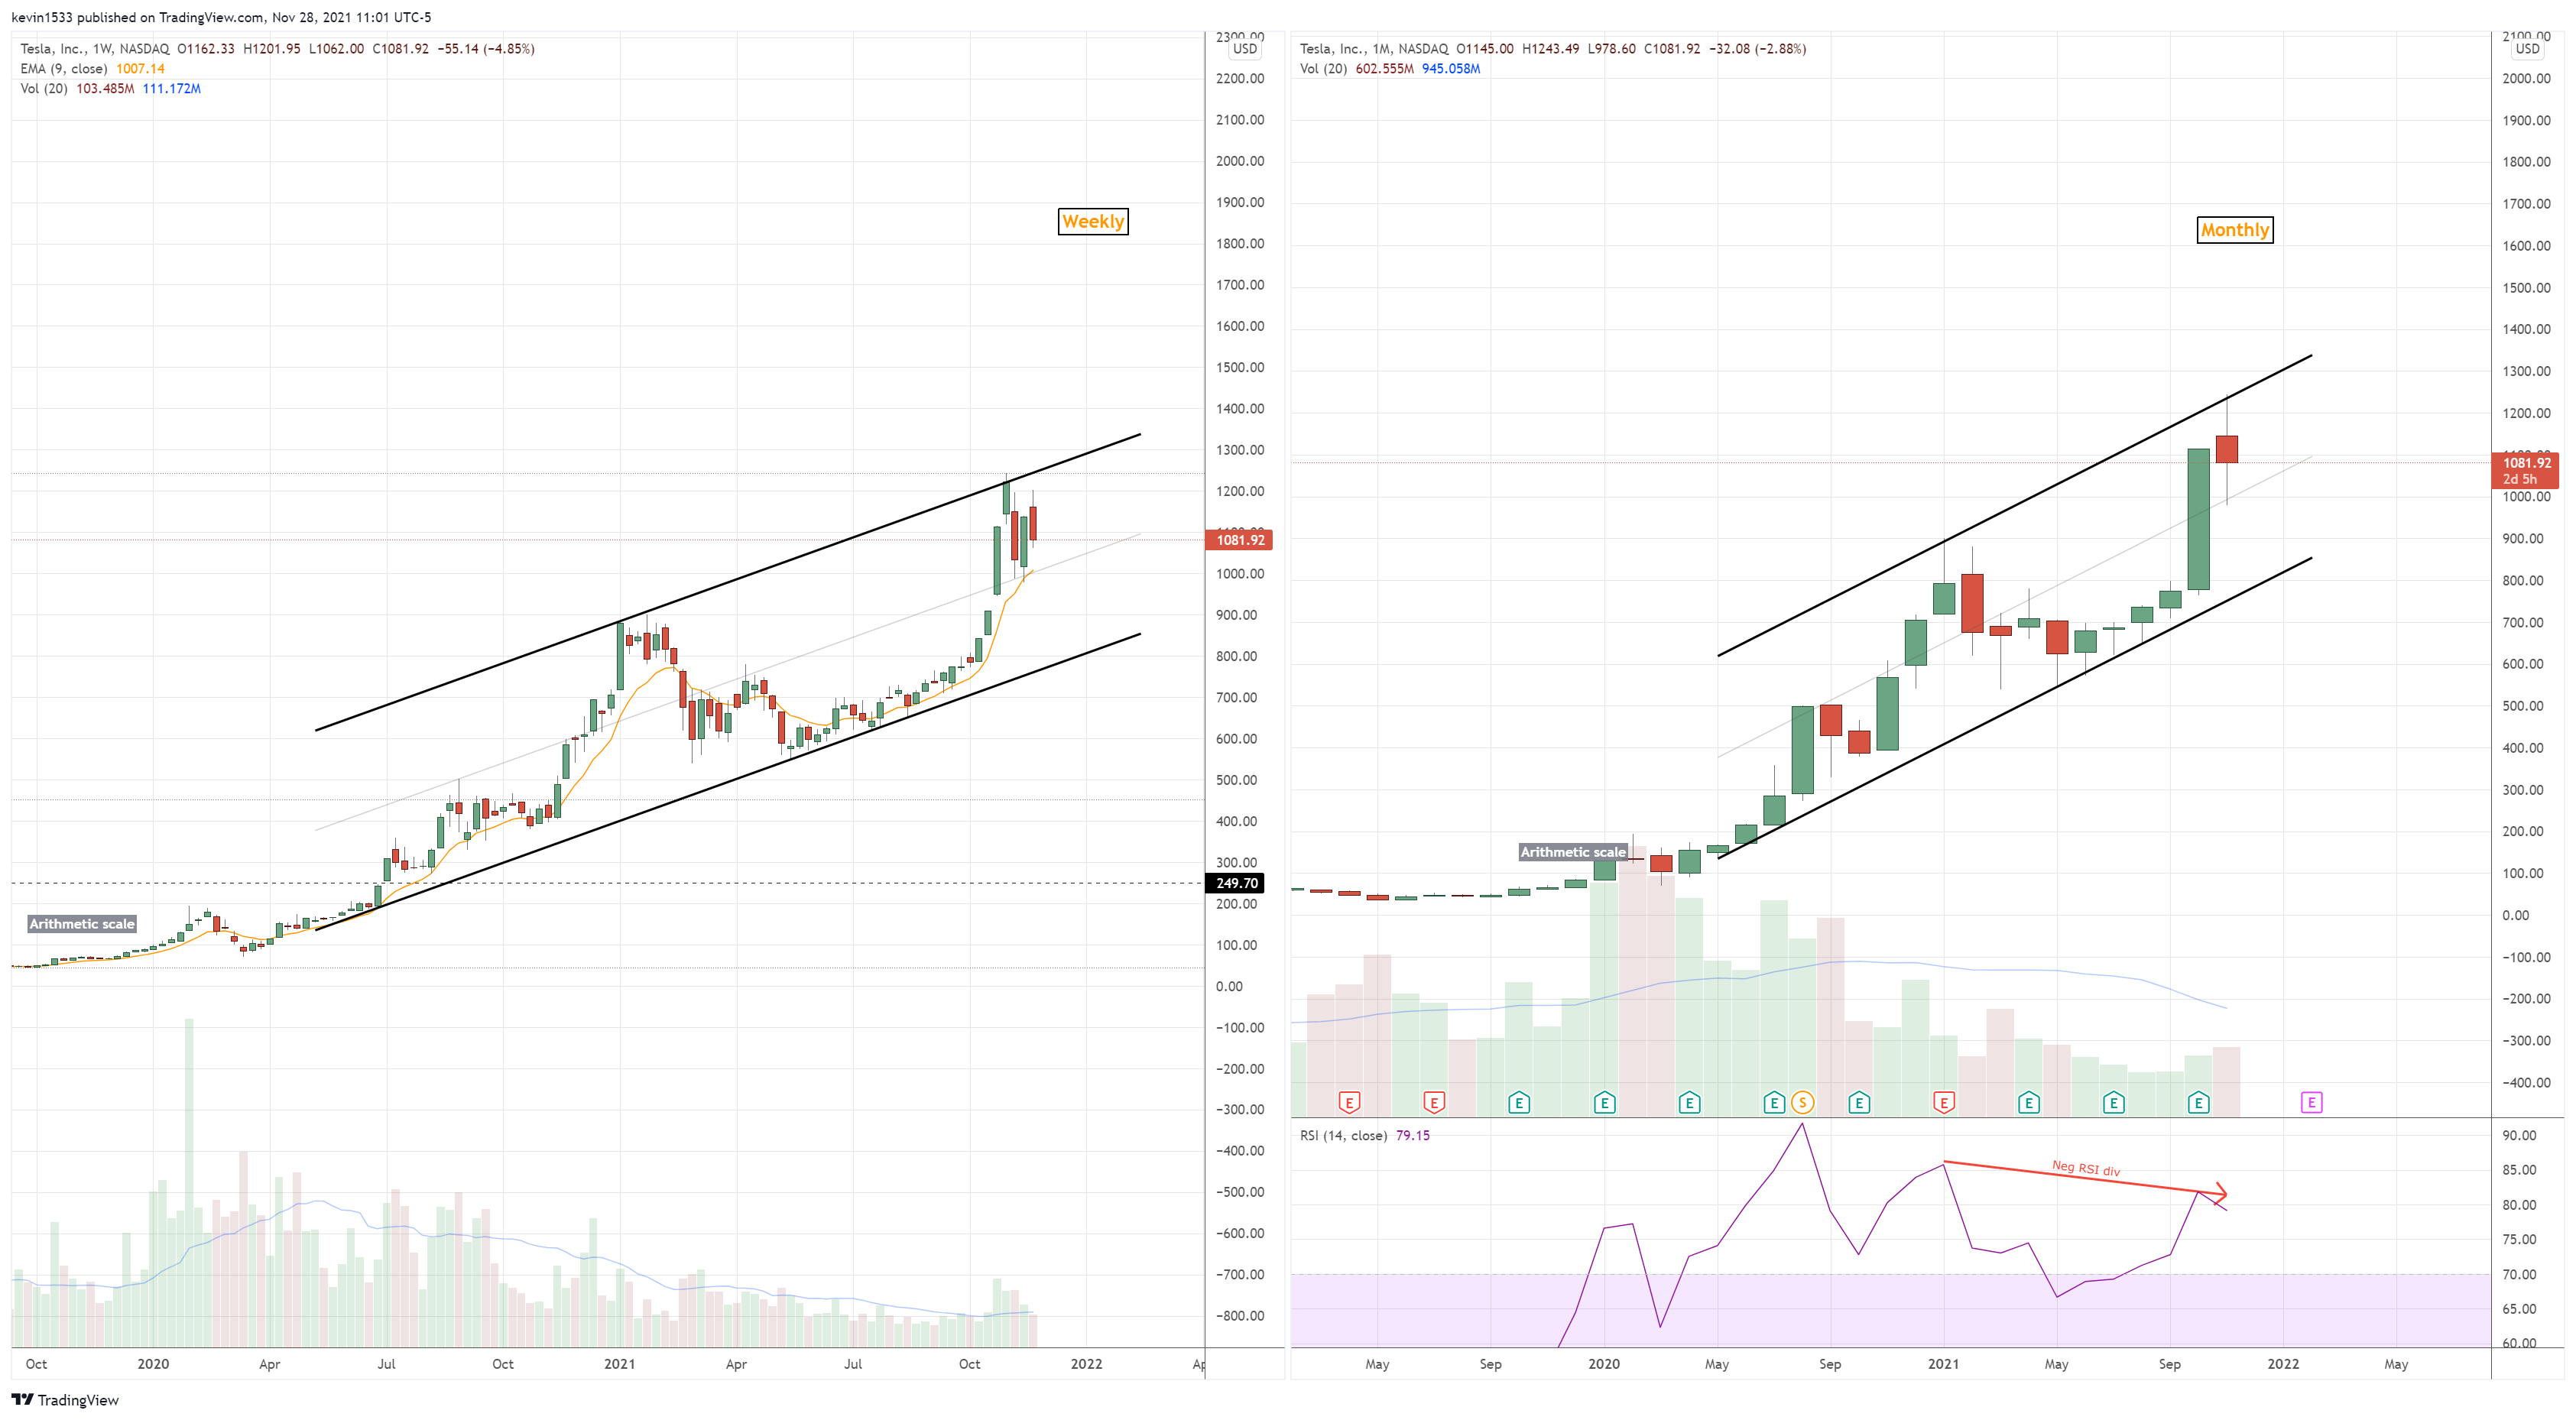
$TSLA (weekly) did not follow-through bullishly after the prior week reversal candle. Monthly RSI divergence at the channel resistance so good chance we resume downward next month.
$FB weekly bearish engulfing at channel resistance. Monthly signaled the top reversal with the bearish engulfing in September and that’s the dominant signal until invalidated.

$NVDA (monthly) at dual major channel resistance

$NVDA (weekly) Dark cloud cover reversal signal at dual channel resistance. Very high probability that this is the top.


$BRK.A (daily) held trendline support for now but still below 5/10/20dma resistance above and 50dma converged as well, this could shift hard downward if it loses the trendline support

$JPM (weekly) at dual support (backtest+ uptrendline) but bearish reaction this week as it tried but failed after breaking above prior weeks candle and closing back below 5/9/20ema weekly. If it breaks the support lines, it could get ugly.

$V (monthly) all signs point to a close below monthly 20ema following false breakout reversal.

$JPM (monthly) bearish engulfing at major channel resistance with candle close on tuesday. If this holds it will be potential top reversal signal with negative RSI divergence.

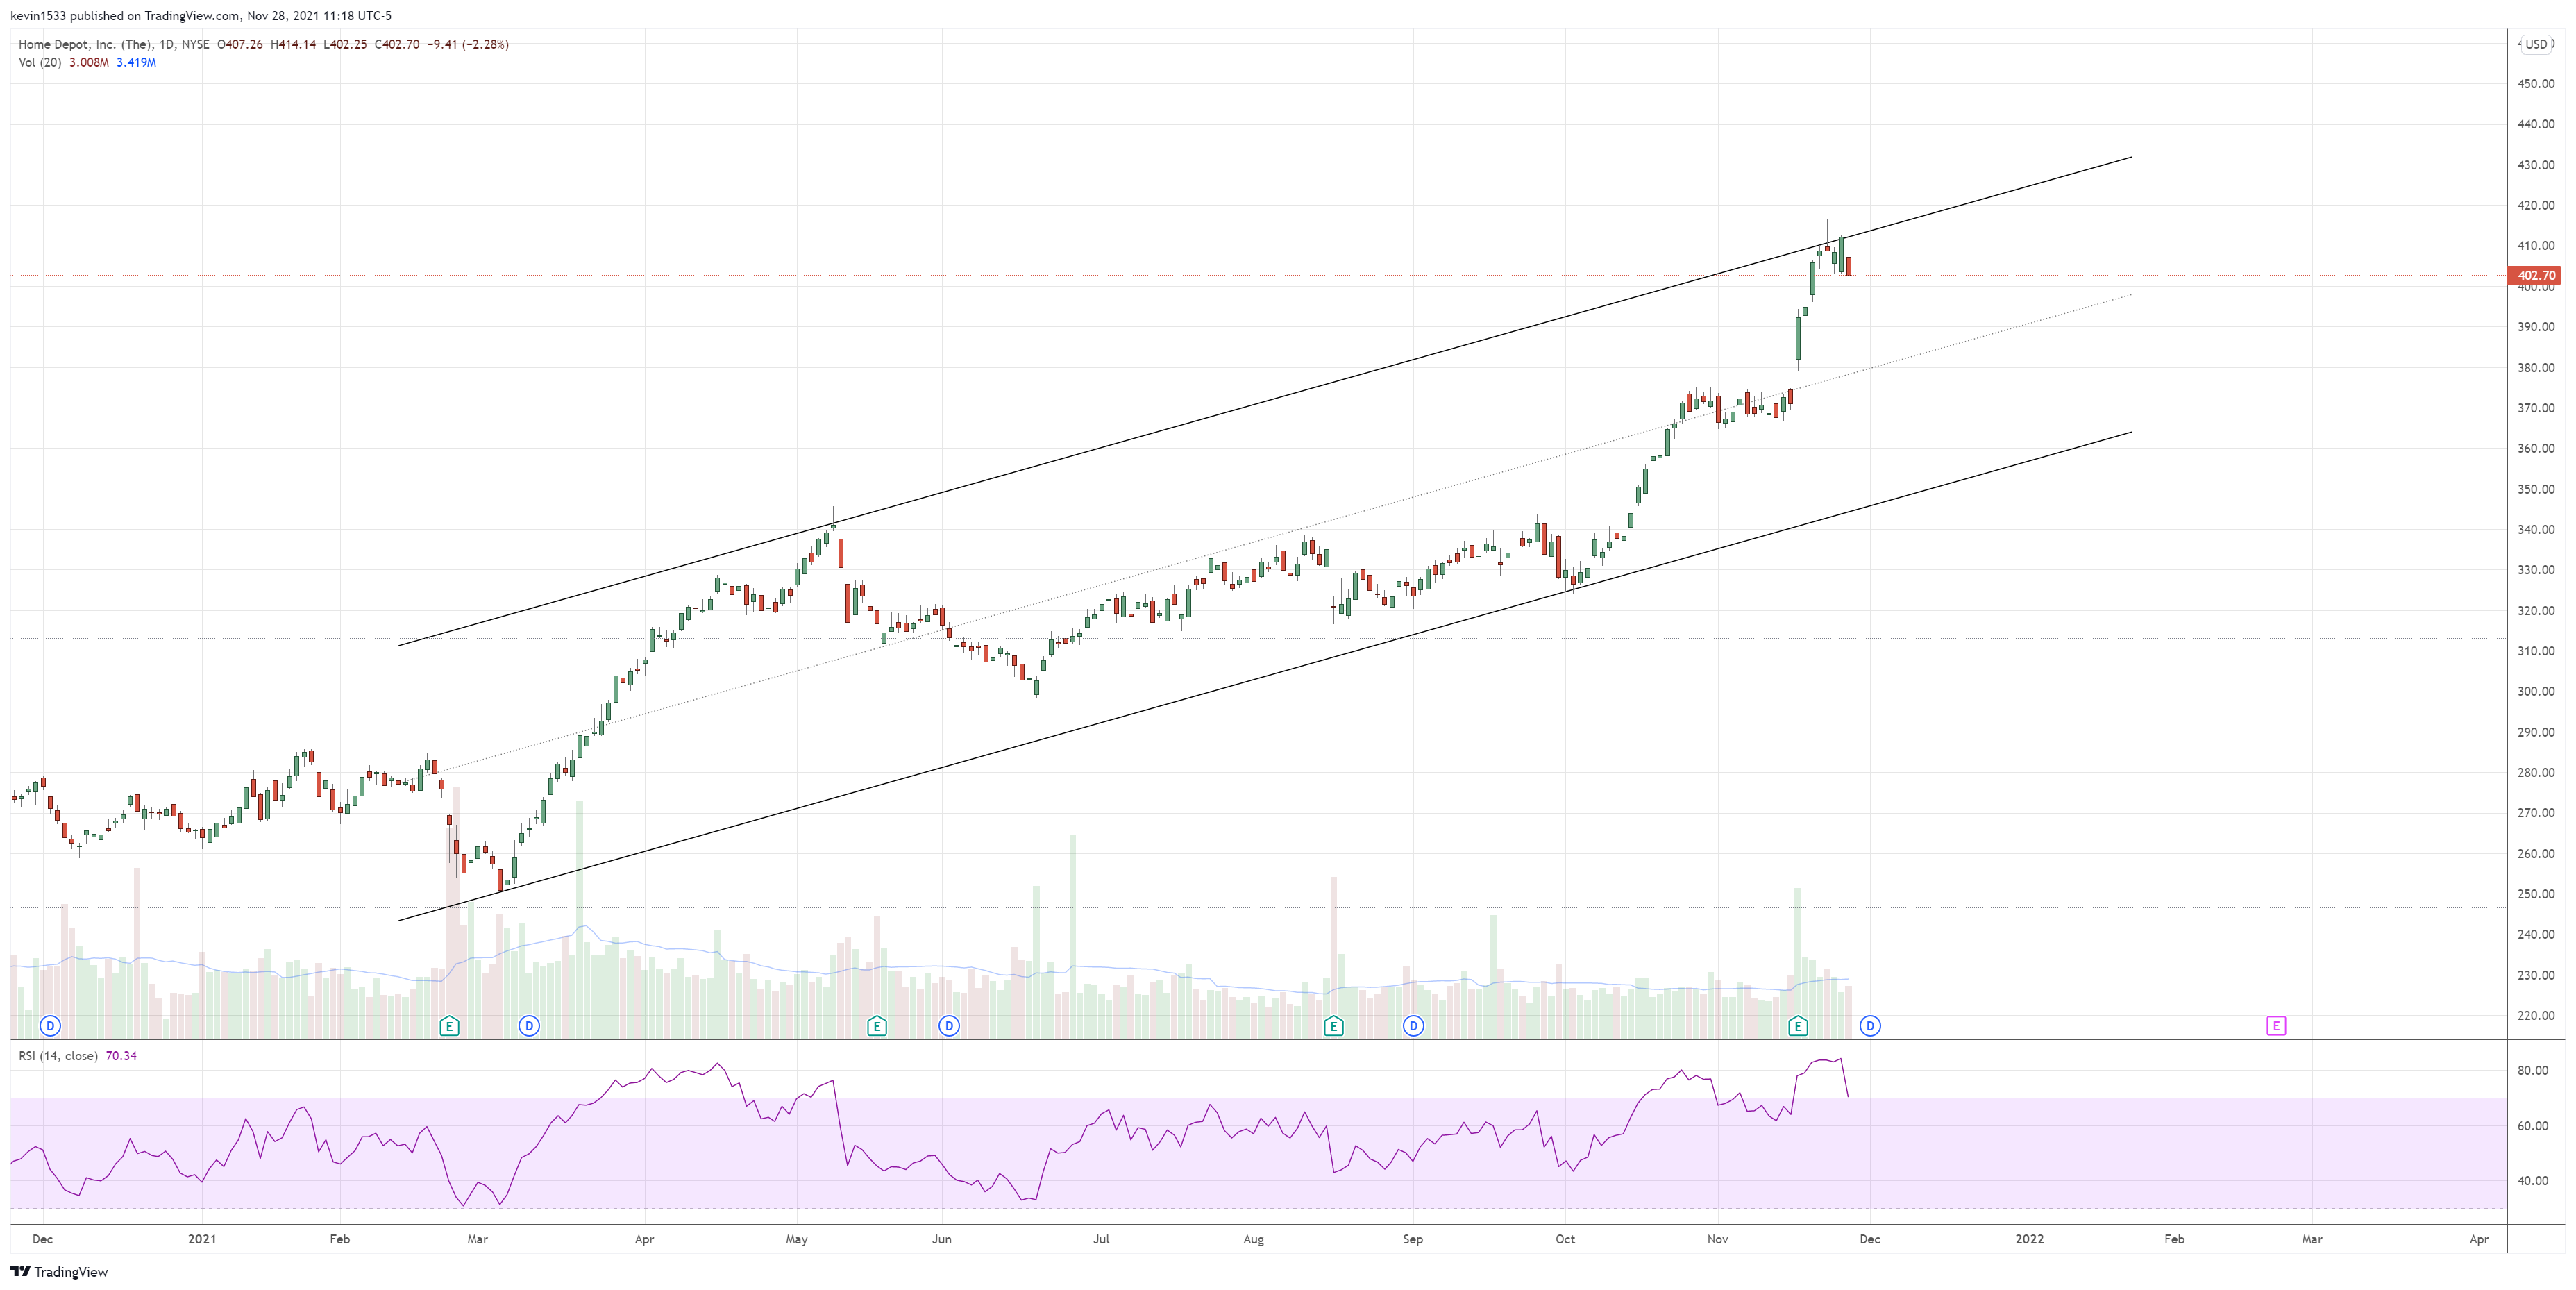
$HD (daily) rejection at channel resistance
Most of the setups are demand/long setups. Remember you can be a bearish outlook in the market and still daytrade these levels when they trigger for intraday gains. Remember to always review prior triggered setups and see how they react.
$AAPL (daily) long setup at 150.37 (could also line up with the backtest of channel)

$AFRM (4h) Long setup at 112.89 Short setup at 151.72

$AMAT (4h) long setup at 136.80

$AMD (daily) long setup at 120.95

$AMZN (daily) long setup at 3565 and 3315

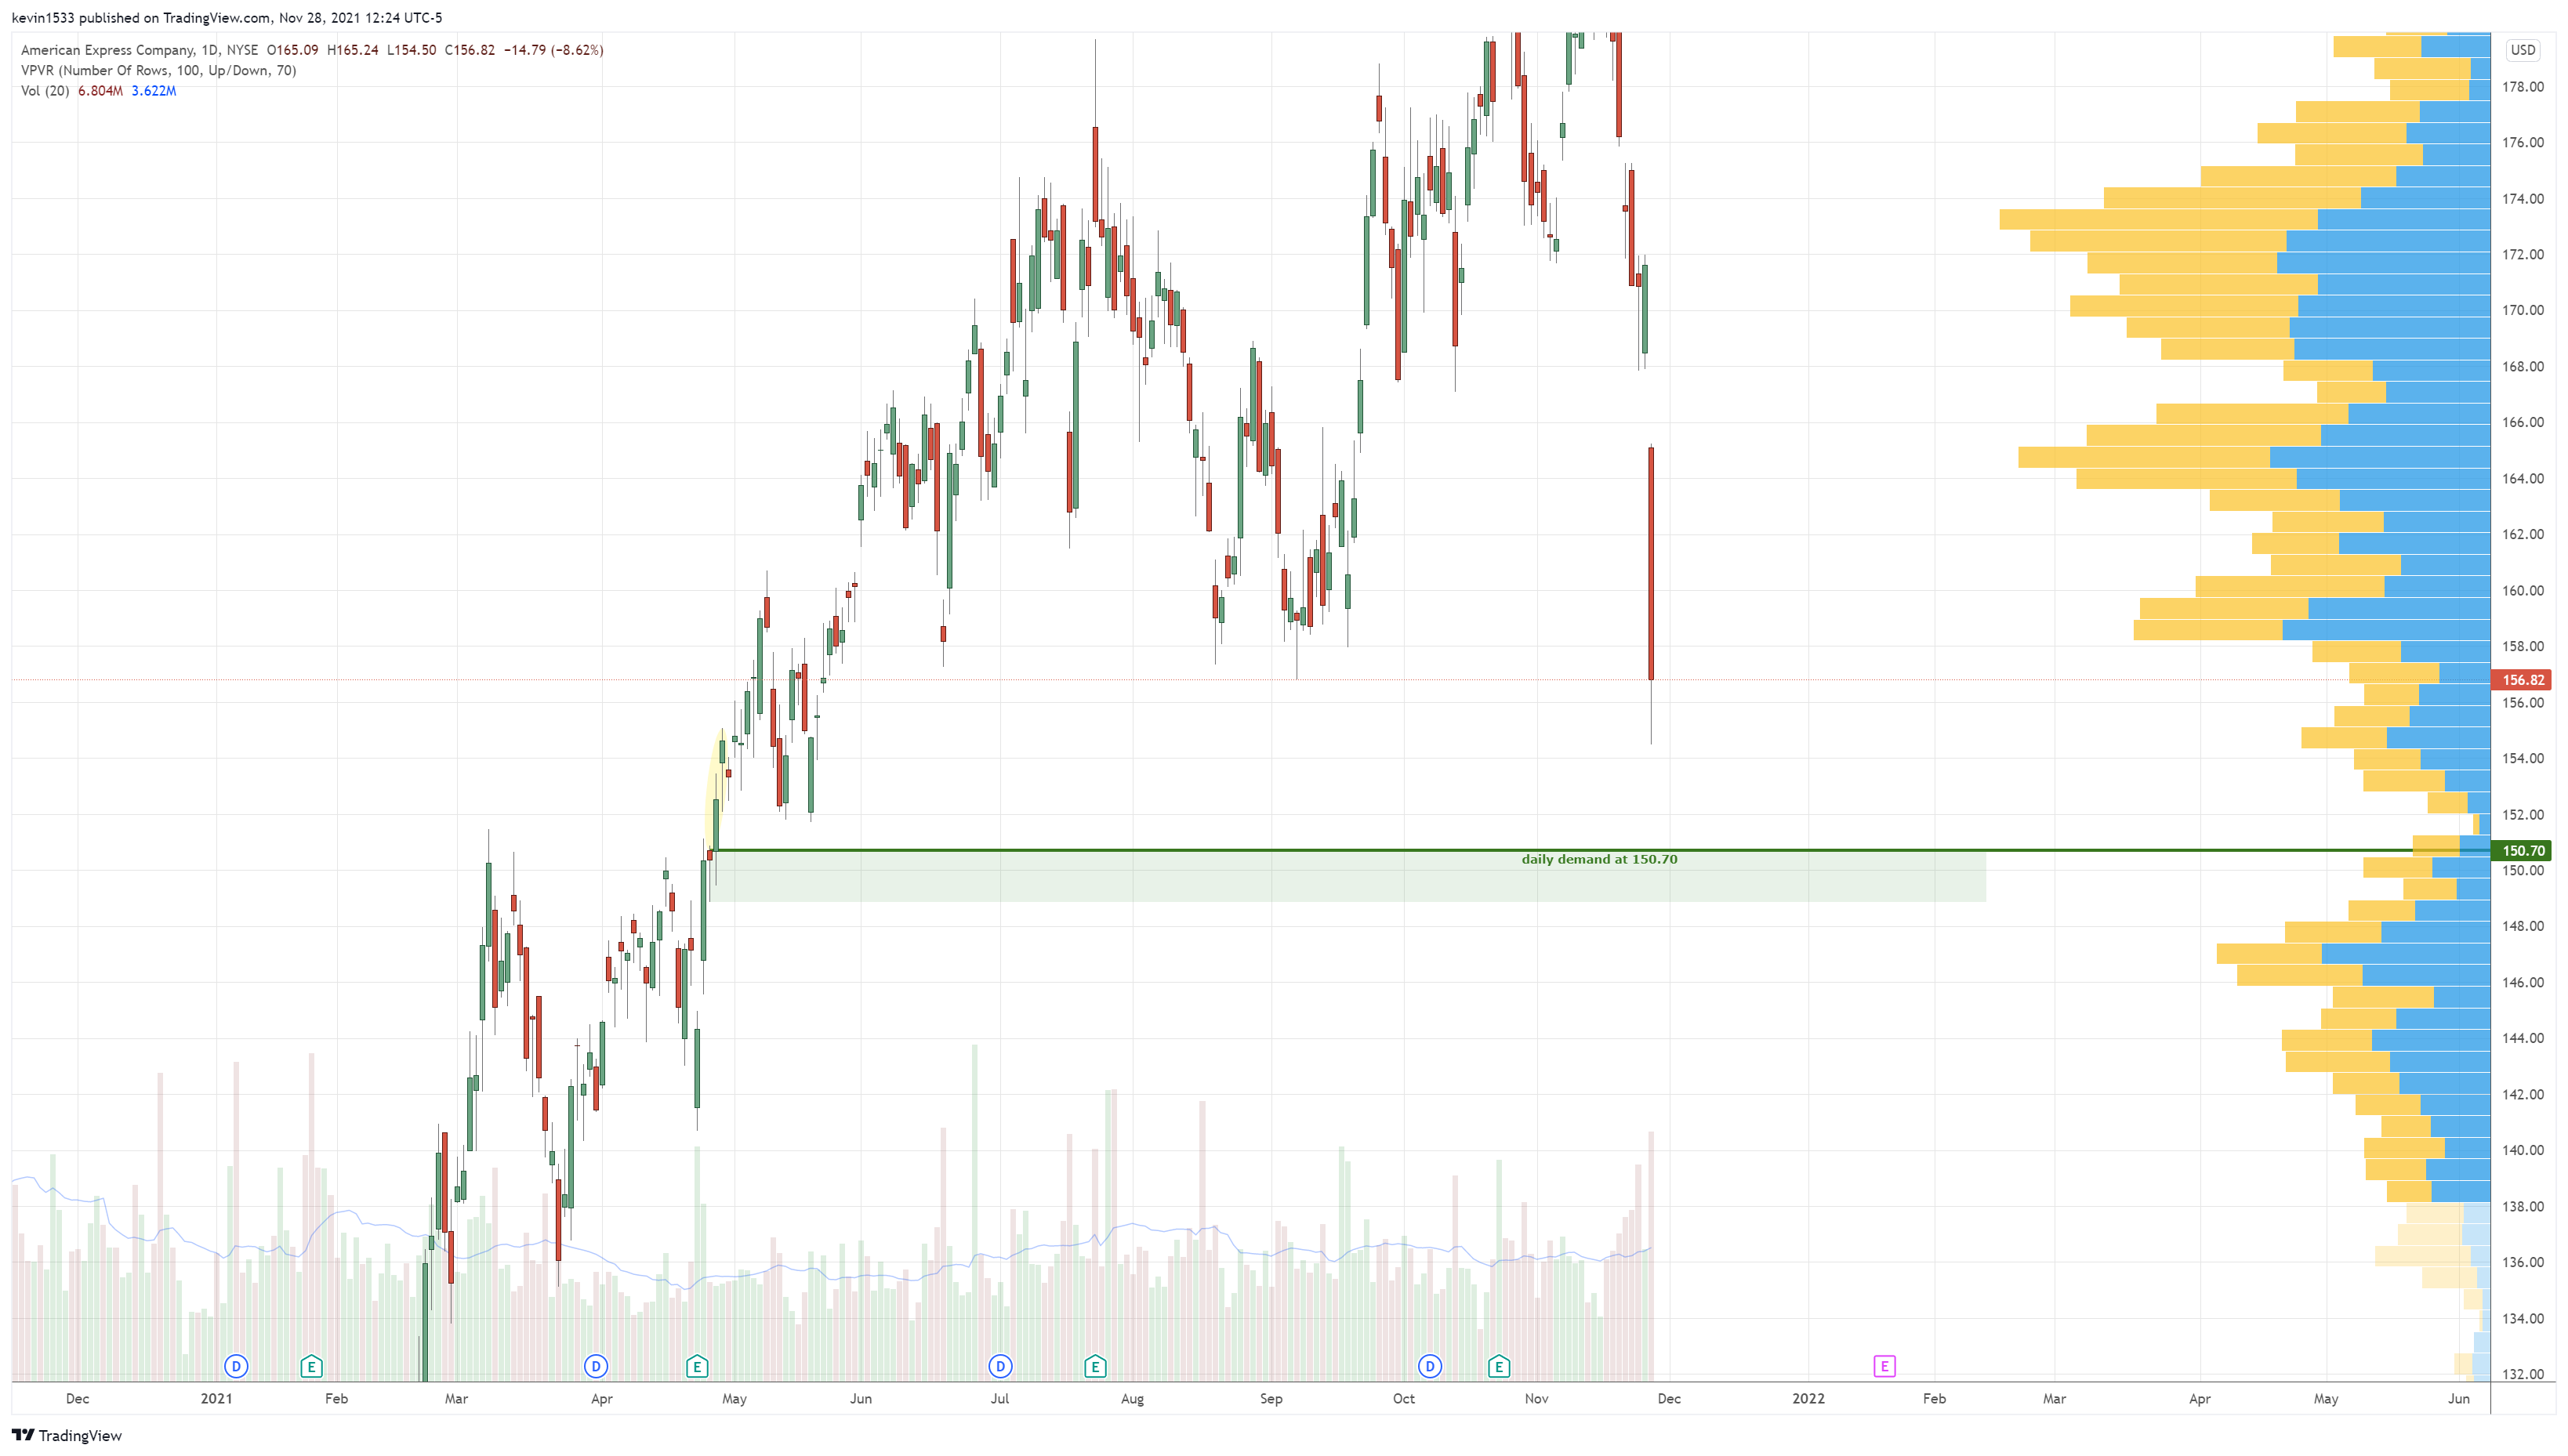
$AXP (4h) long setup at 163.83
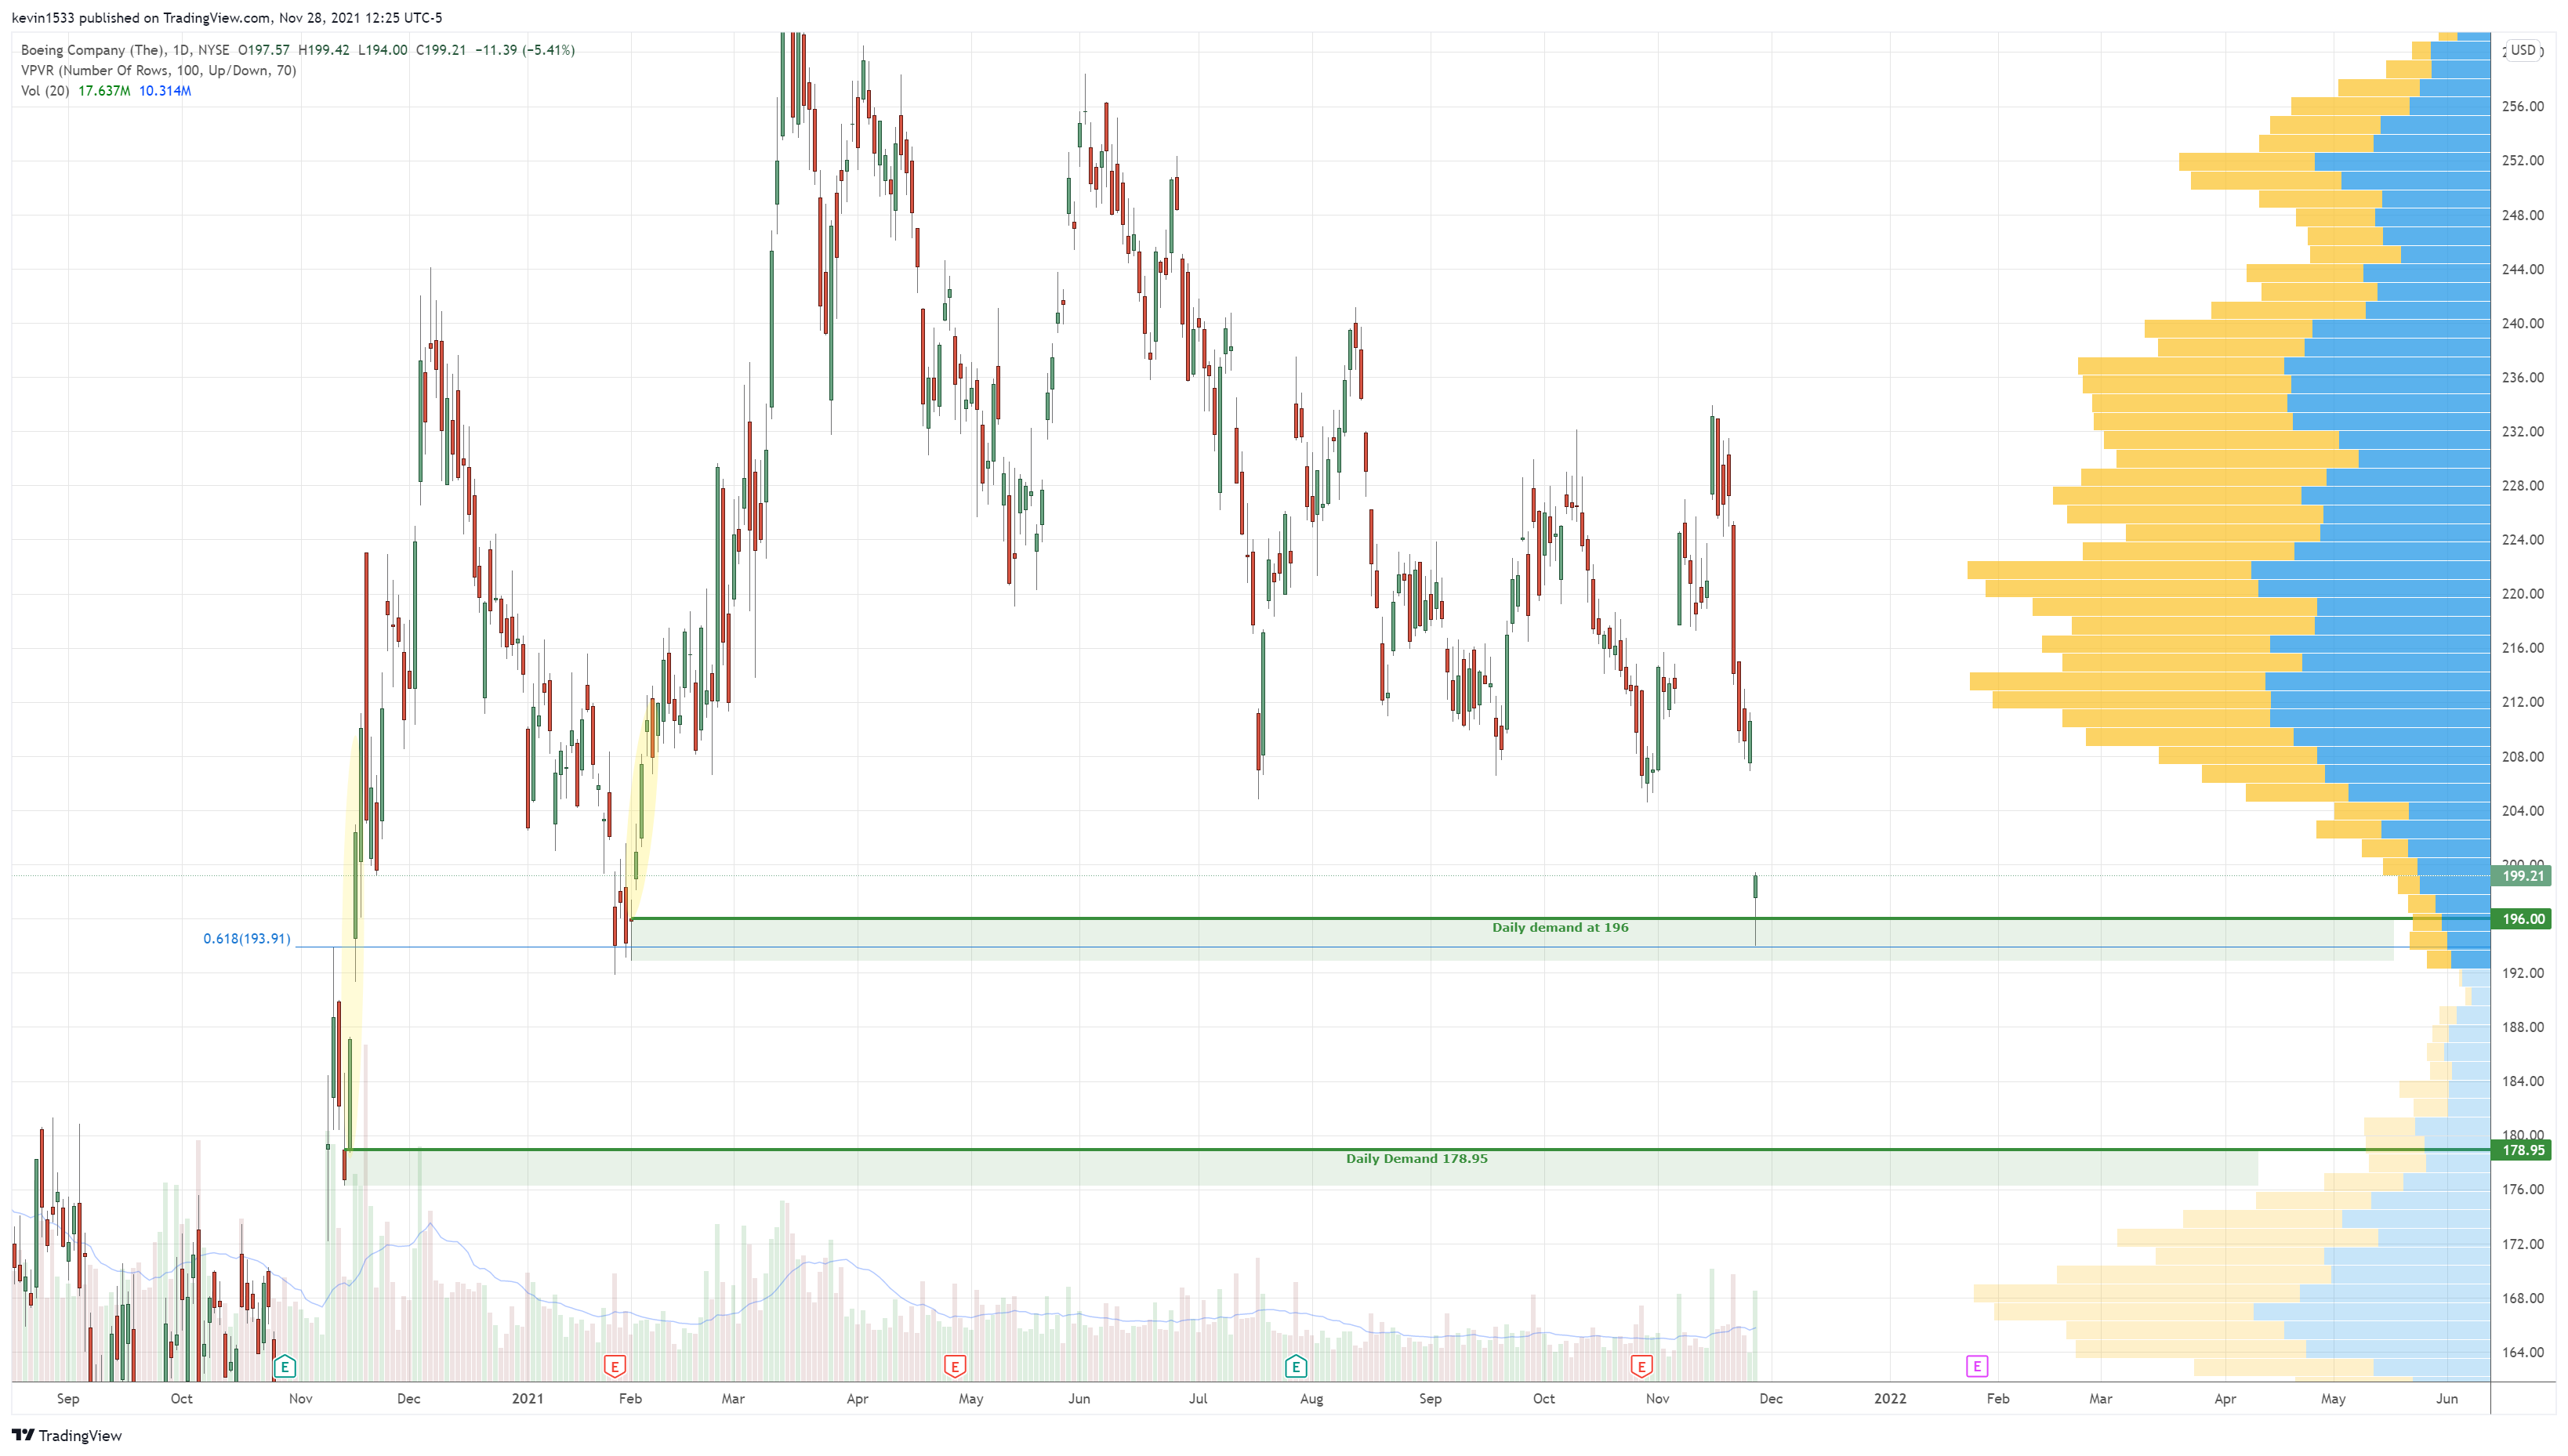
$BA (daily) long setup trigged on 11/26 but if you played it conservatively, it was a pass it didnt react bullishly initially and chopped below the trigger price. However, it closed the daily candle with a hammer. If we get a bullish confirmation monday, then it could be a long entry. If market dumps and $BA gets pulled down, then 178.95 is the next demand long setup below.

$BAC (daily) long setup at 43.55 and 39.27

$BBBY (daily) long setup at 14.45

$BIDU (daily) Long setup at 139.78

$BILI (daily) long setup at 49.65

$C (4H) long setup at 60.11

$CAT (daily) long setup at 190.50

$CMG (4h) Long setup at 1584 (also strong weekly demand at 1589)


$CRM (4h) long setup at 280 and 259.63

$CROX (daily) long setup at 154.42

$DIS (weekly) long setup at 141.57-141.74

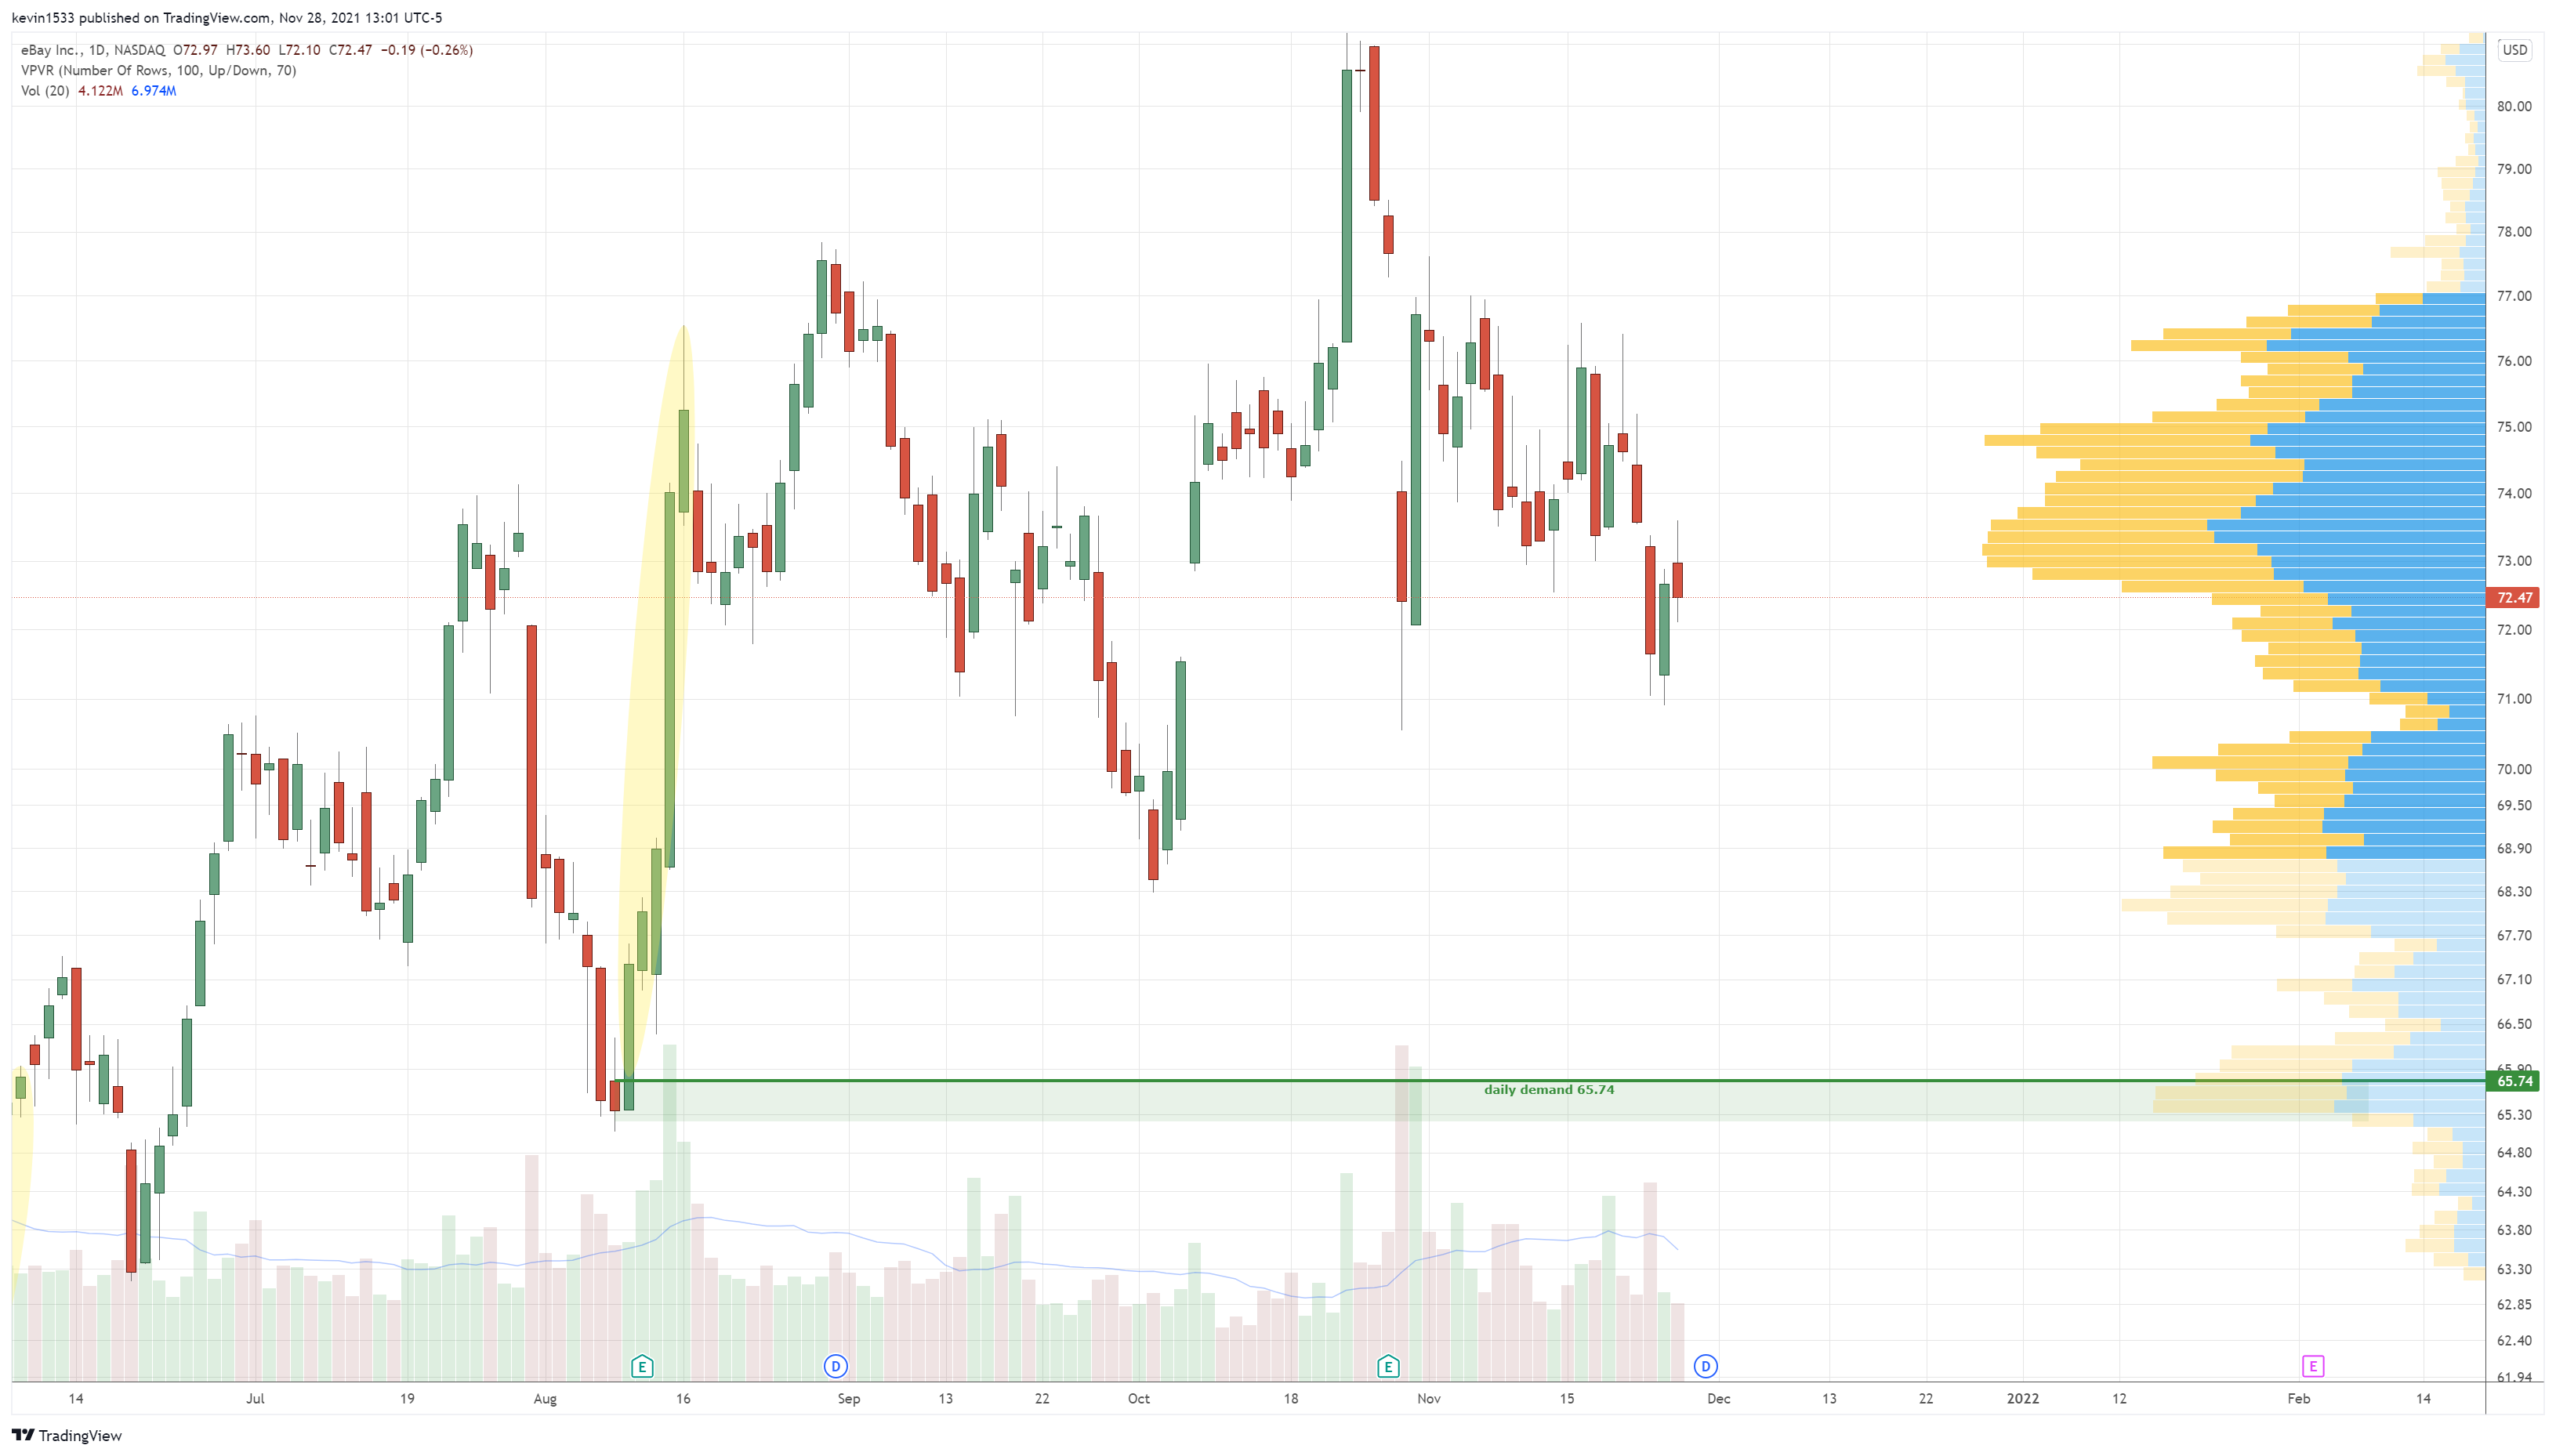
$EBAY (daily) long setup at 65.74
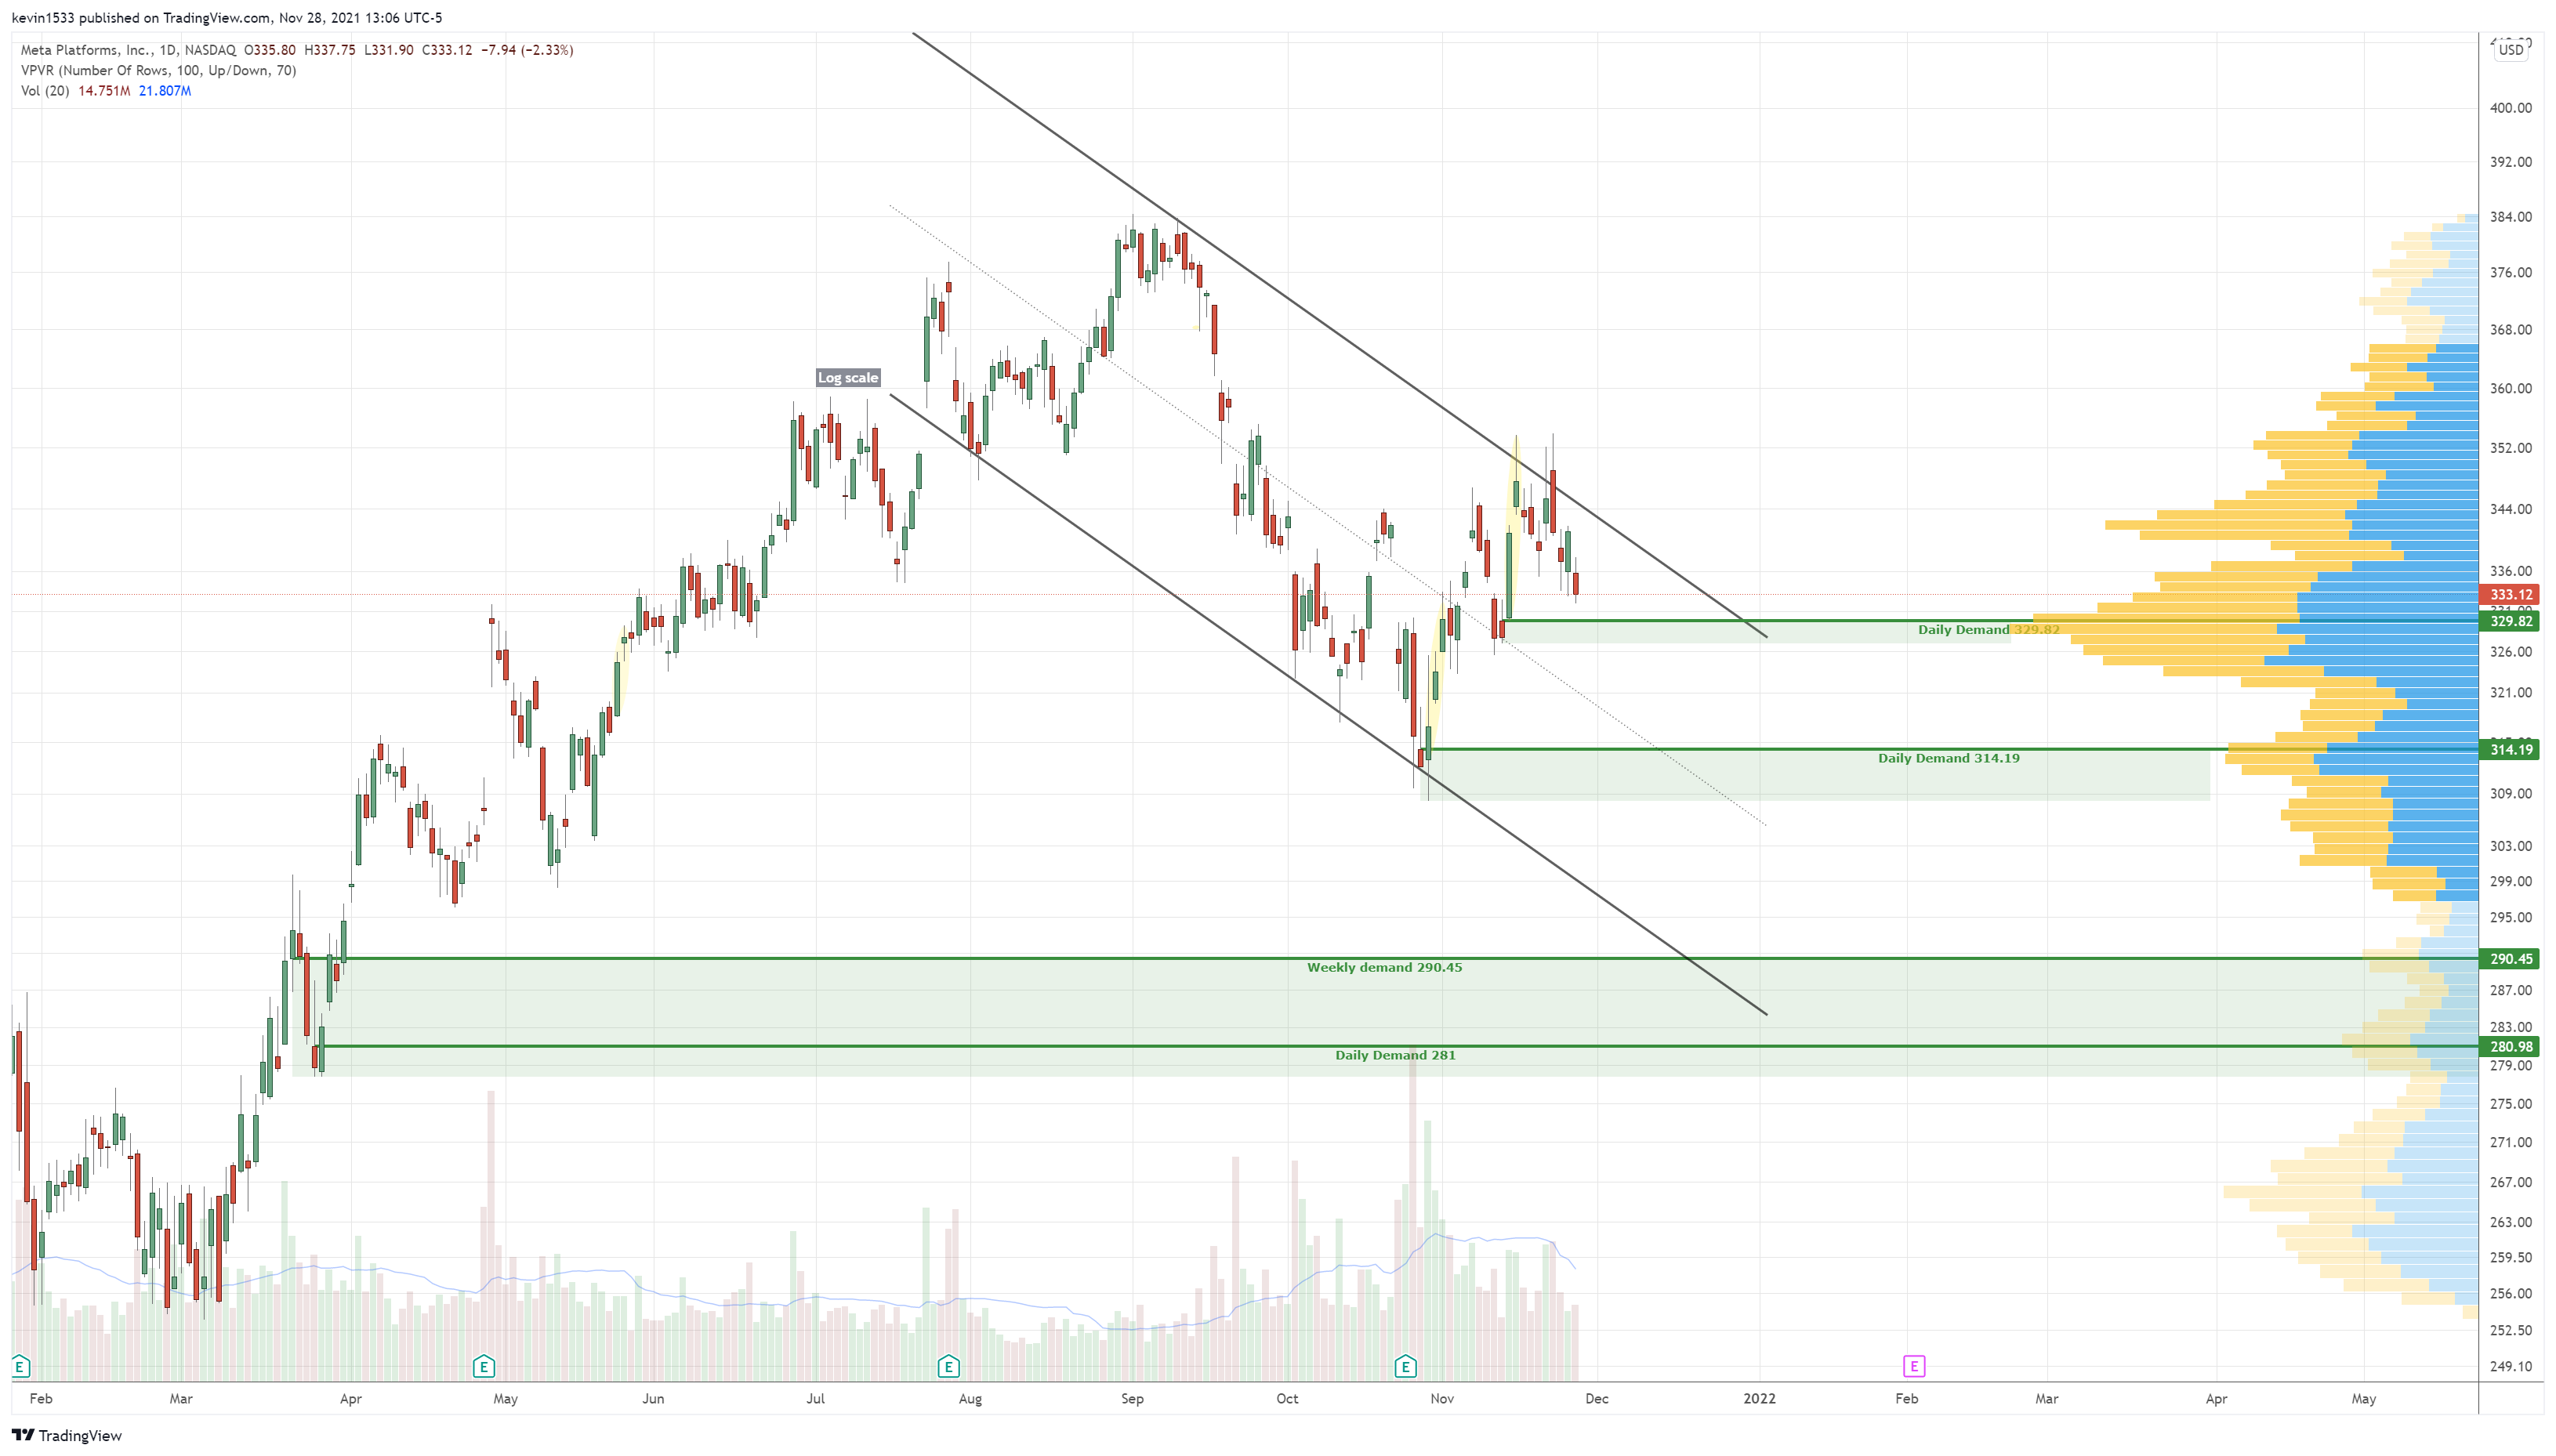
$FB (daily ) long setup at 329.82 and 314.19
$GDX (daily)

$GME (daily) long setup at 156.77

$GOOGL (4h) long setup at 2786.93

$HD (daily) long setup at 374.39

$LULU (4H) long setup at 437.80

$MCD (daily) long setup at 237.47

$MGM (daily) long setup at 38

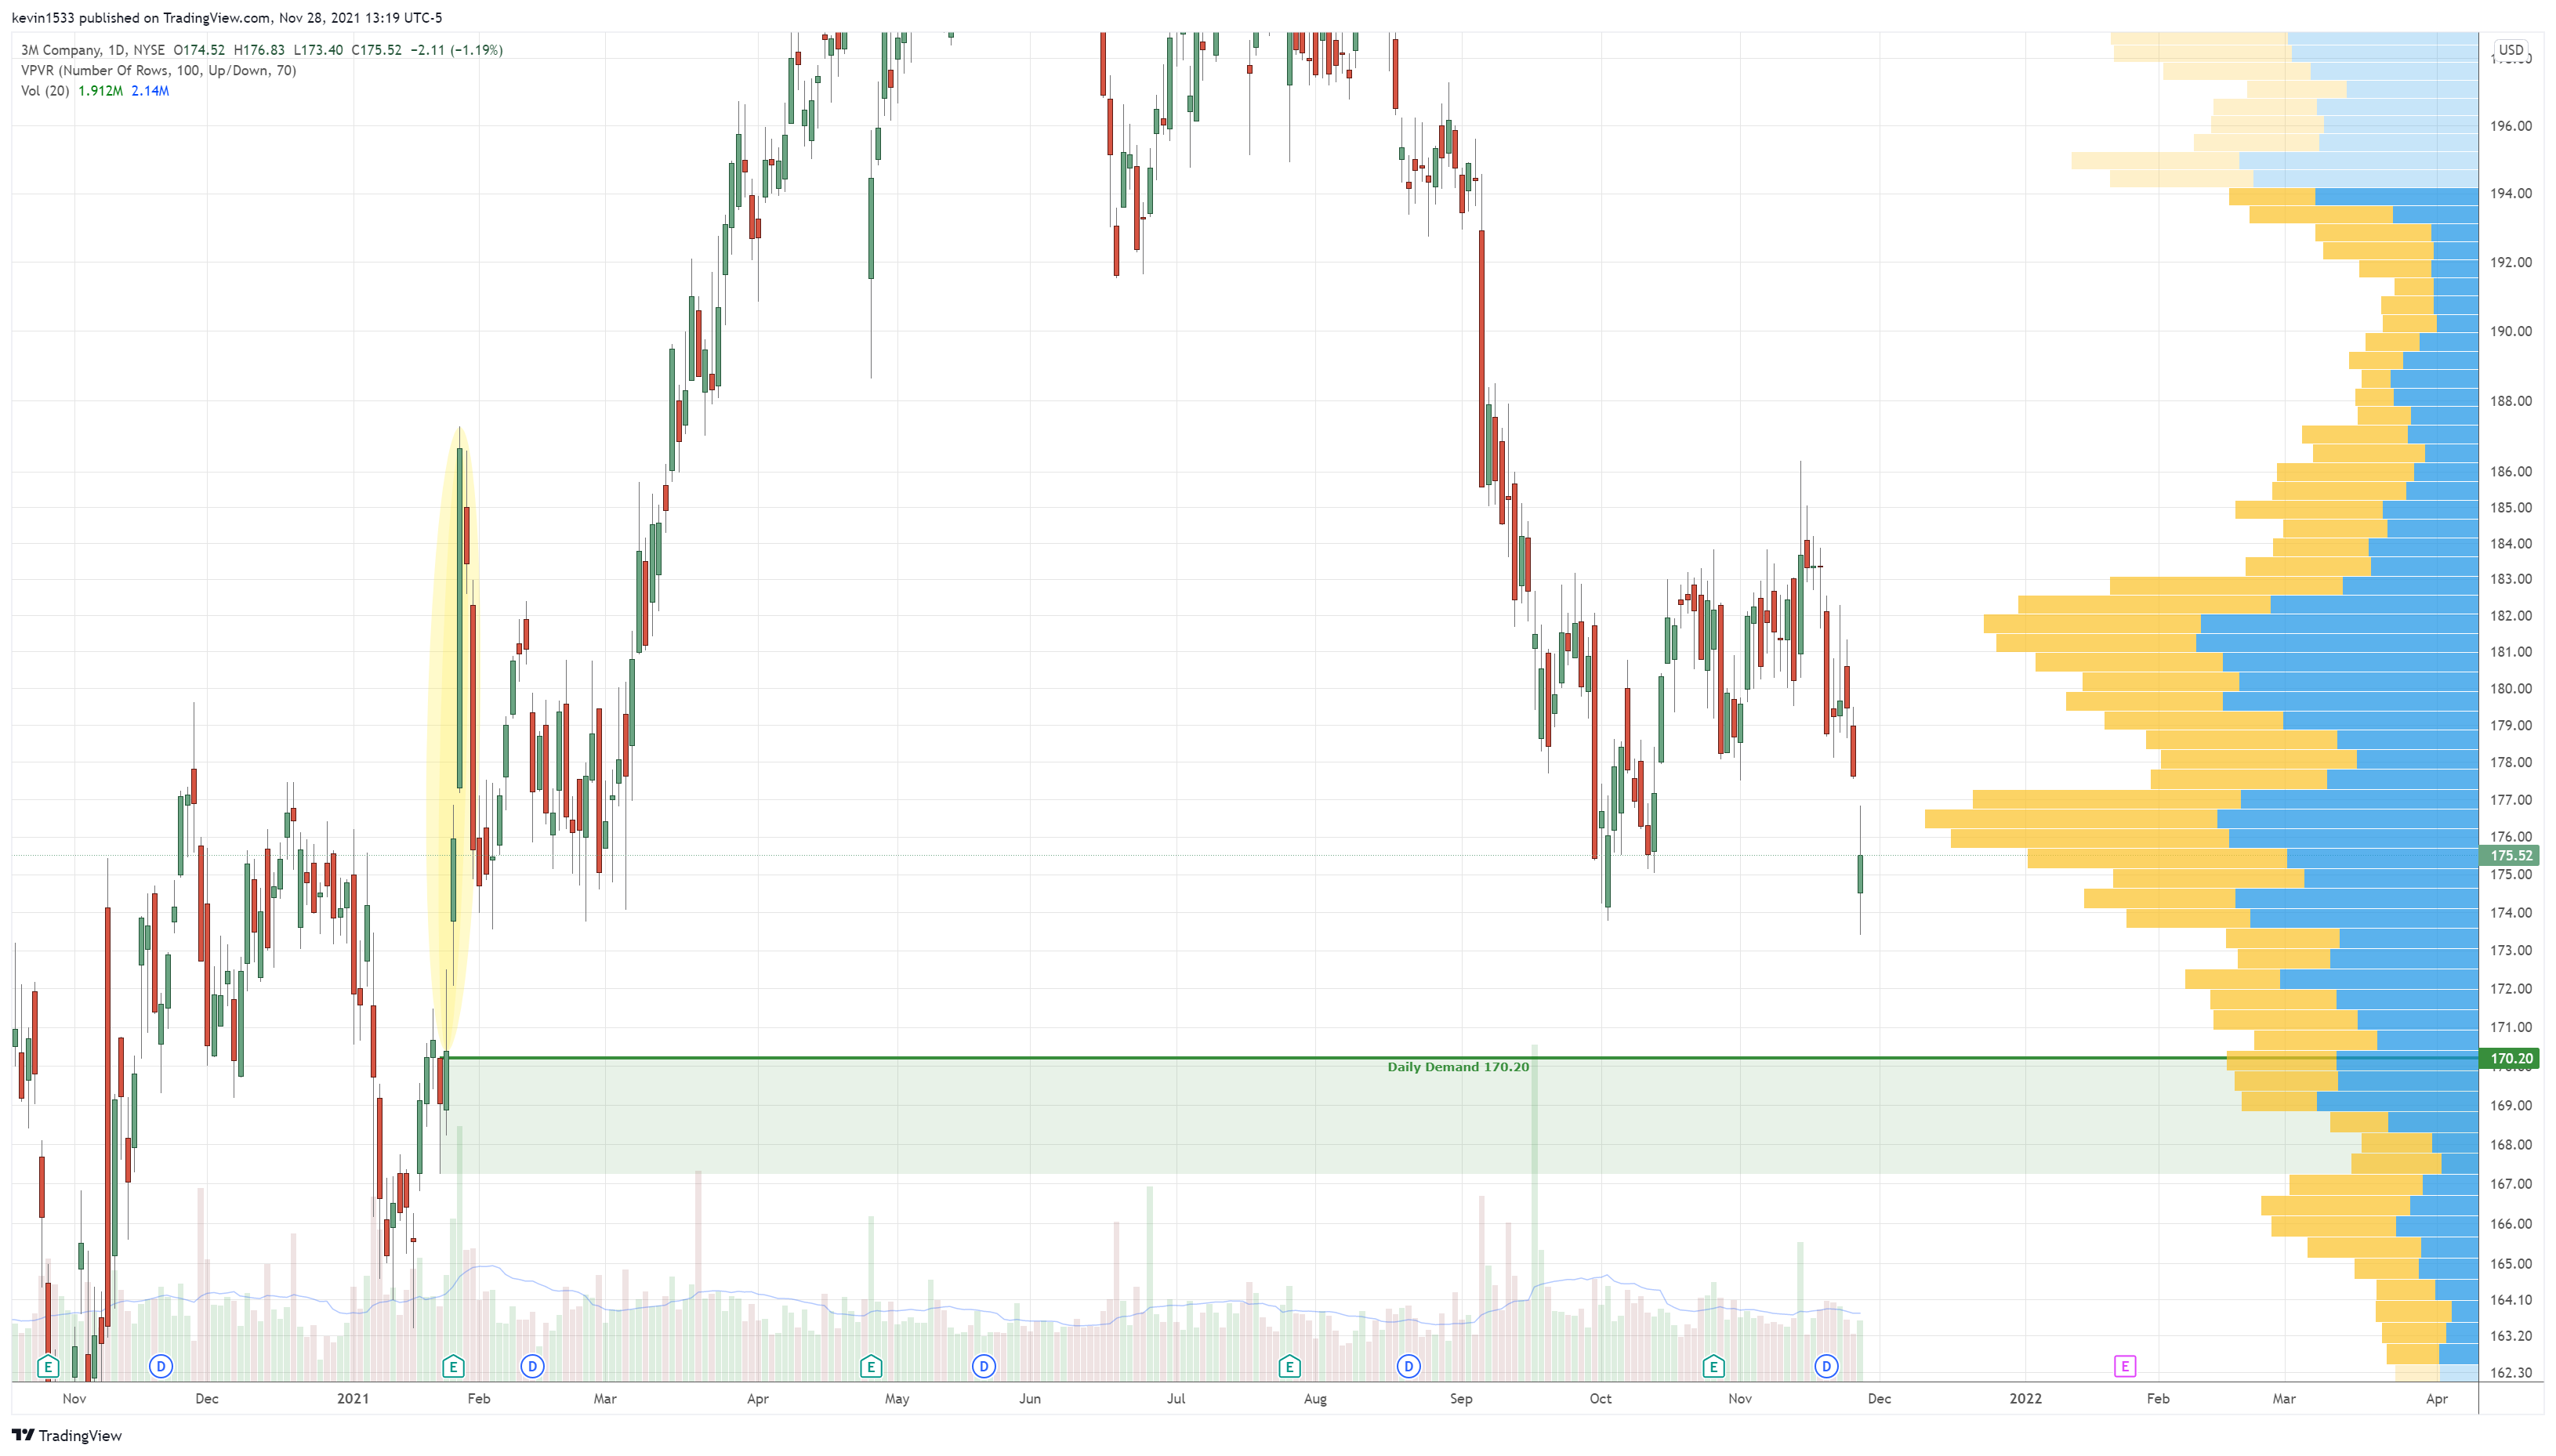
$MMM (daily) long setup at 170.20
$MSFT (daily) long setup at 311 and 295.34

$NFLX (daily) long setup at 625.57 and 550.16

$NKE (4h) long setup at 158.50 and 152.42

$NVDA (daily) long setup at 266.70 and 228.23

$NXPI (daily) long setup at 193.72

$ORCL (daily) long setup at 89.48

$SHOP (daily) long setup at 1503.50

$SNAP (daily) long setup at 44.90

$SPY (daily) long setup at 435.67 and 417.09. Another area of interest is 454 prior ATH resistance zone.

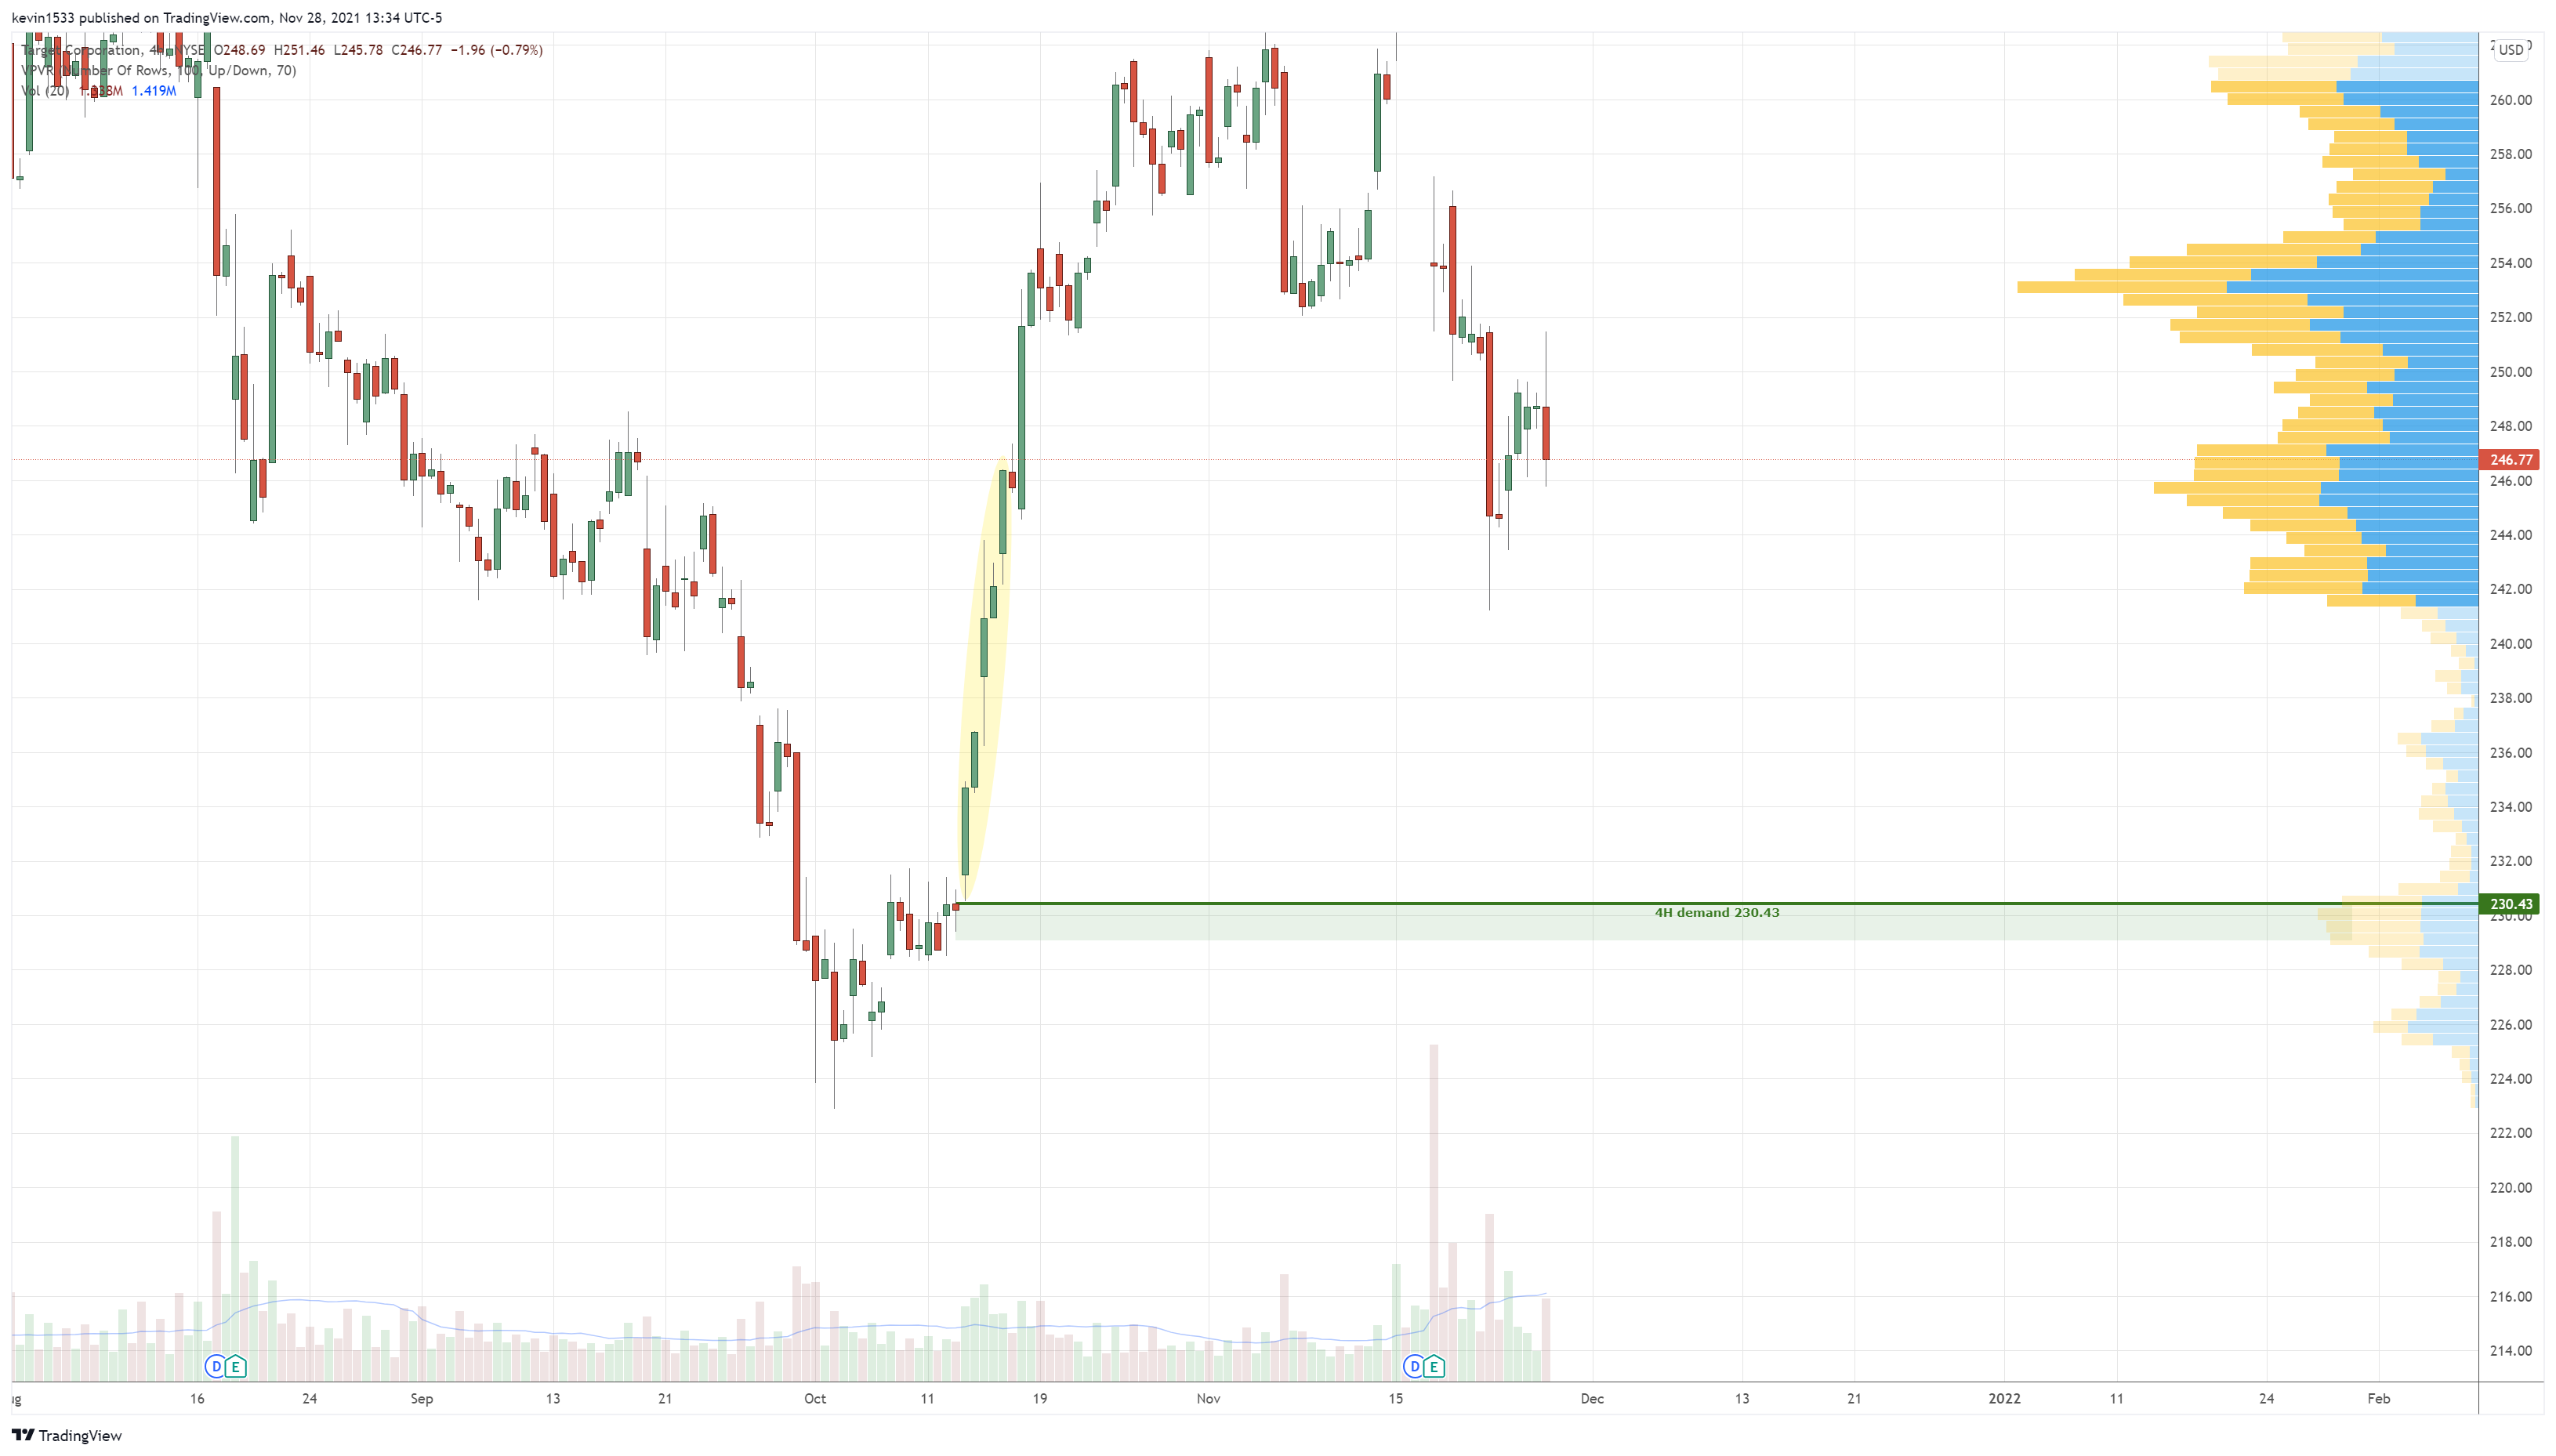
$TGT (4h) long setup at 230.43
UPST (daily) long setup at 139.49

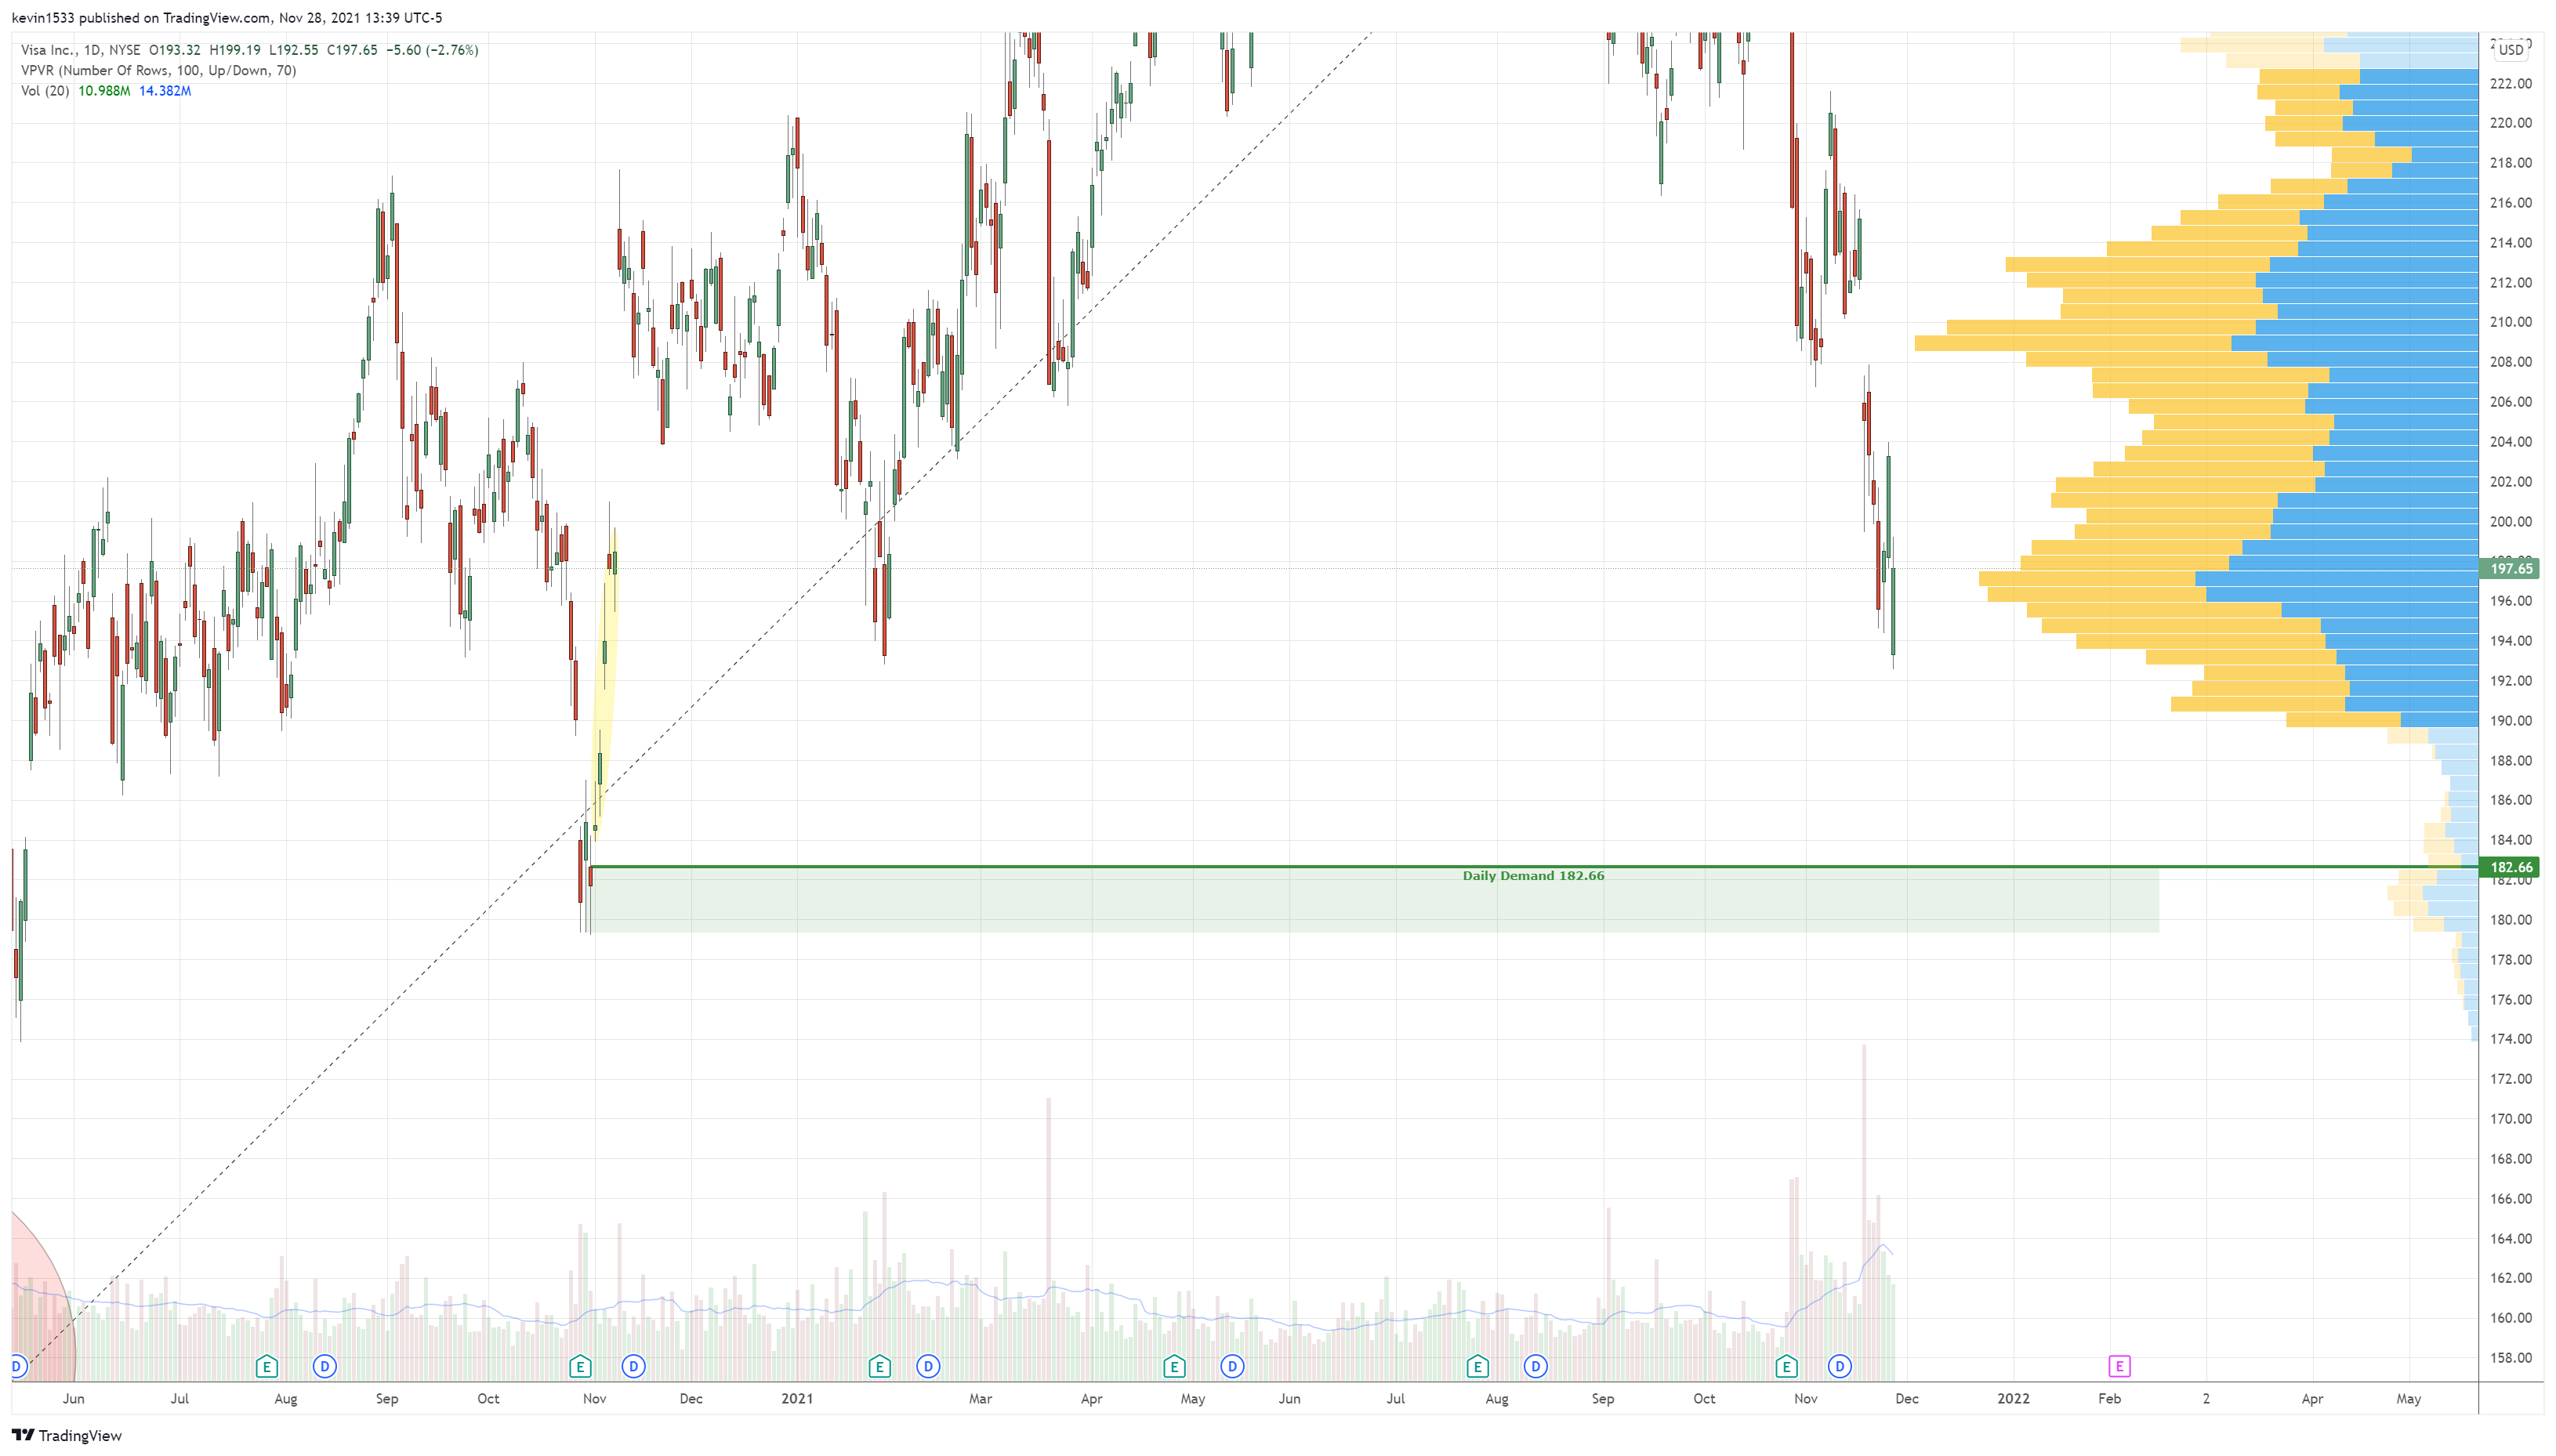
$V (daily) long setup at 182.66
Thank you Kevin
Thank you Kevin for all u share here.
Can you please take a look at my account ant possibility to be invited to telegram? I know there are no obligations, just asking in case u missed to invite me.
Thank you very much in advance
Thank you for all your hard works!
outstanding! Thanks for everything. Great chartwork Kevin!