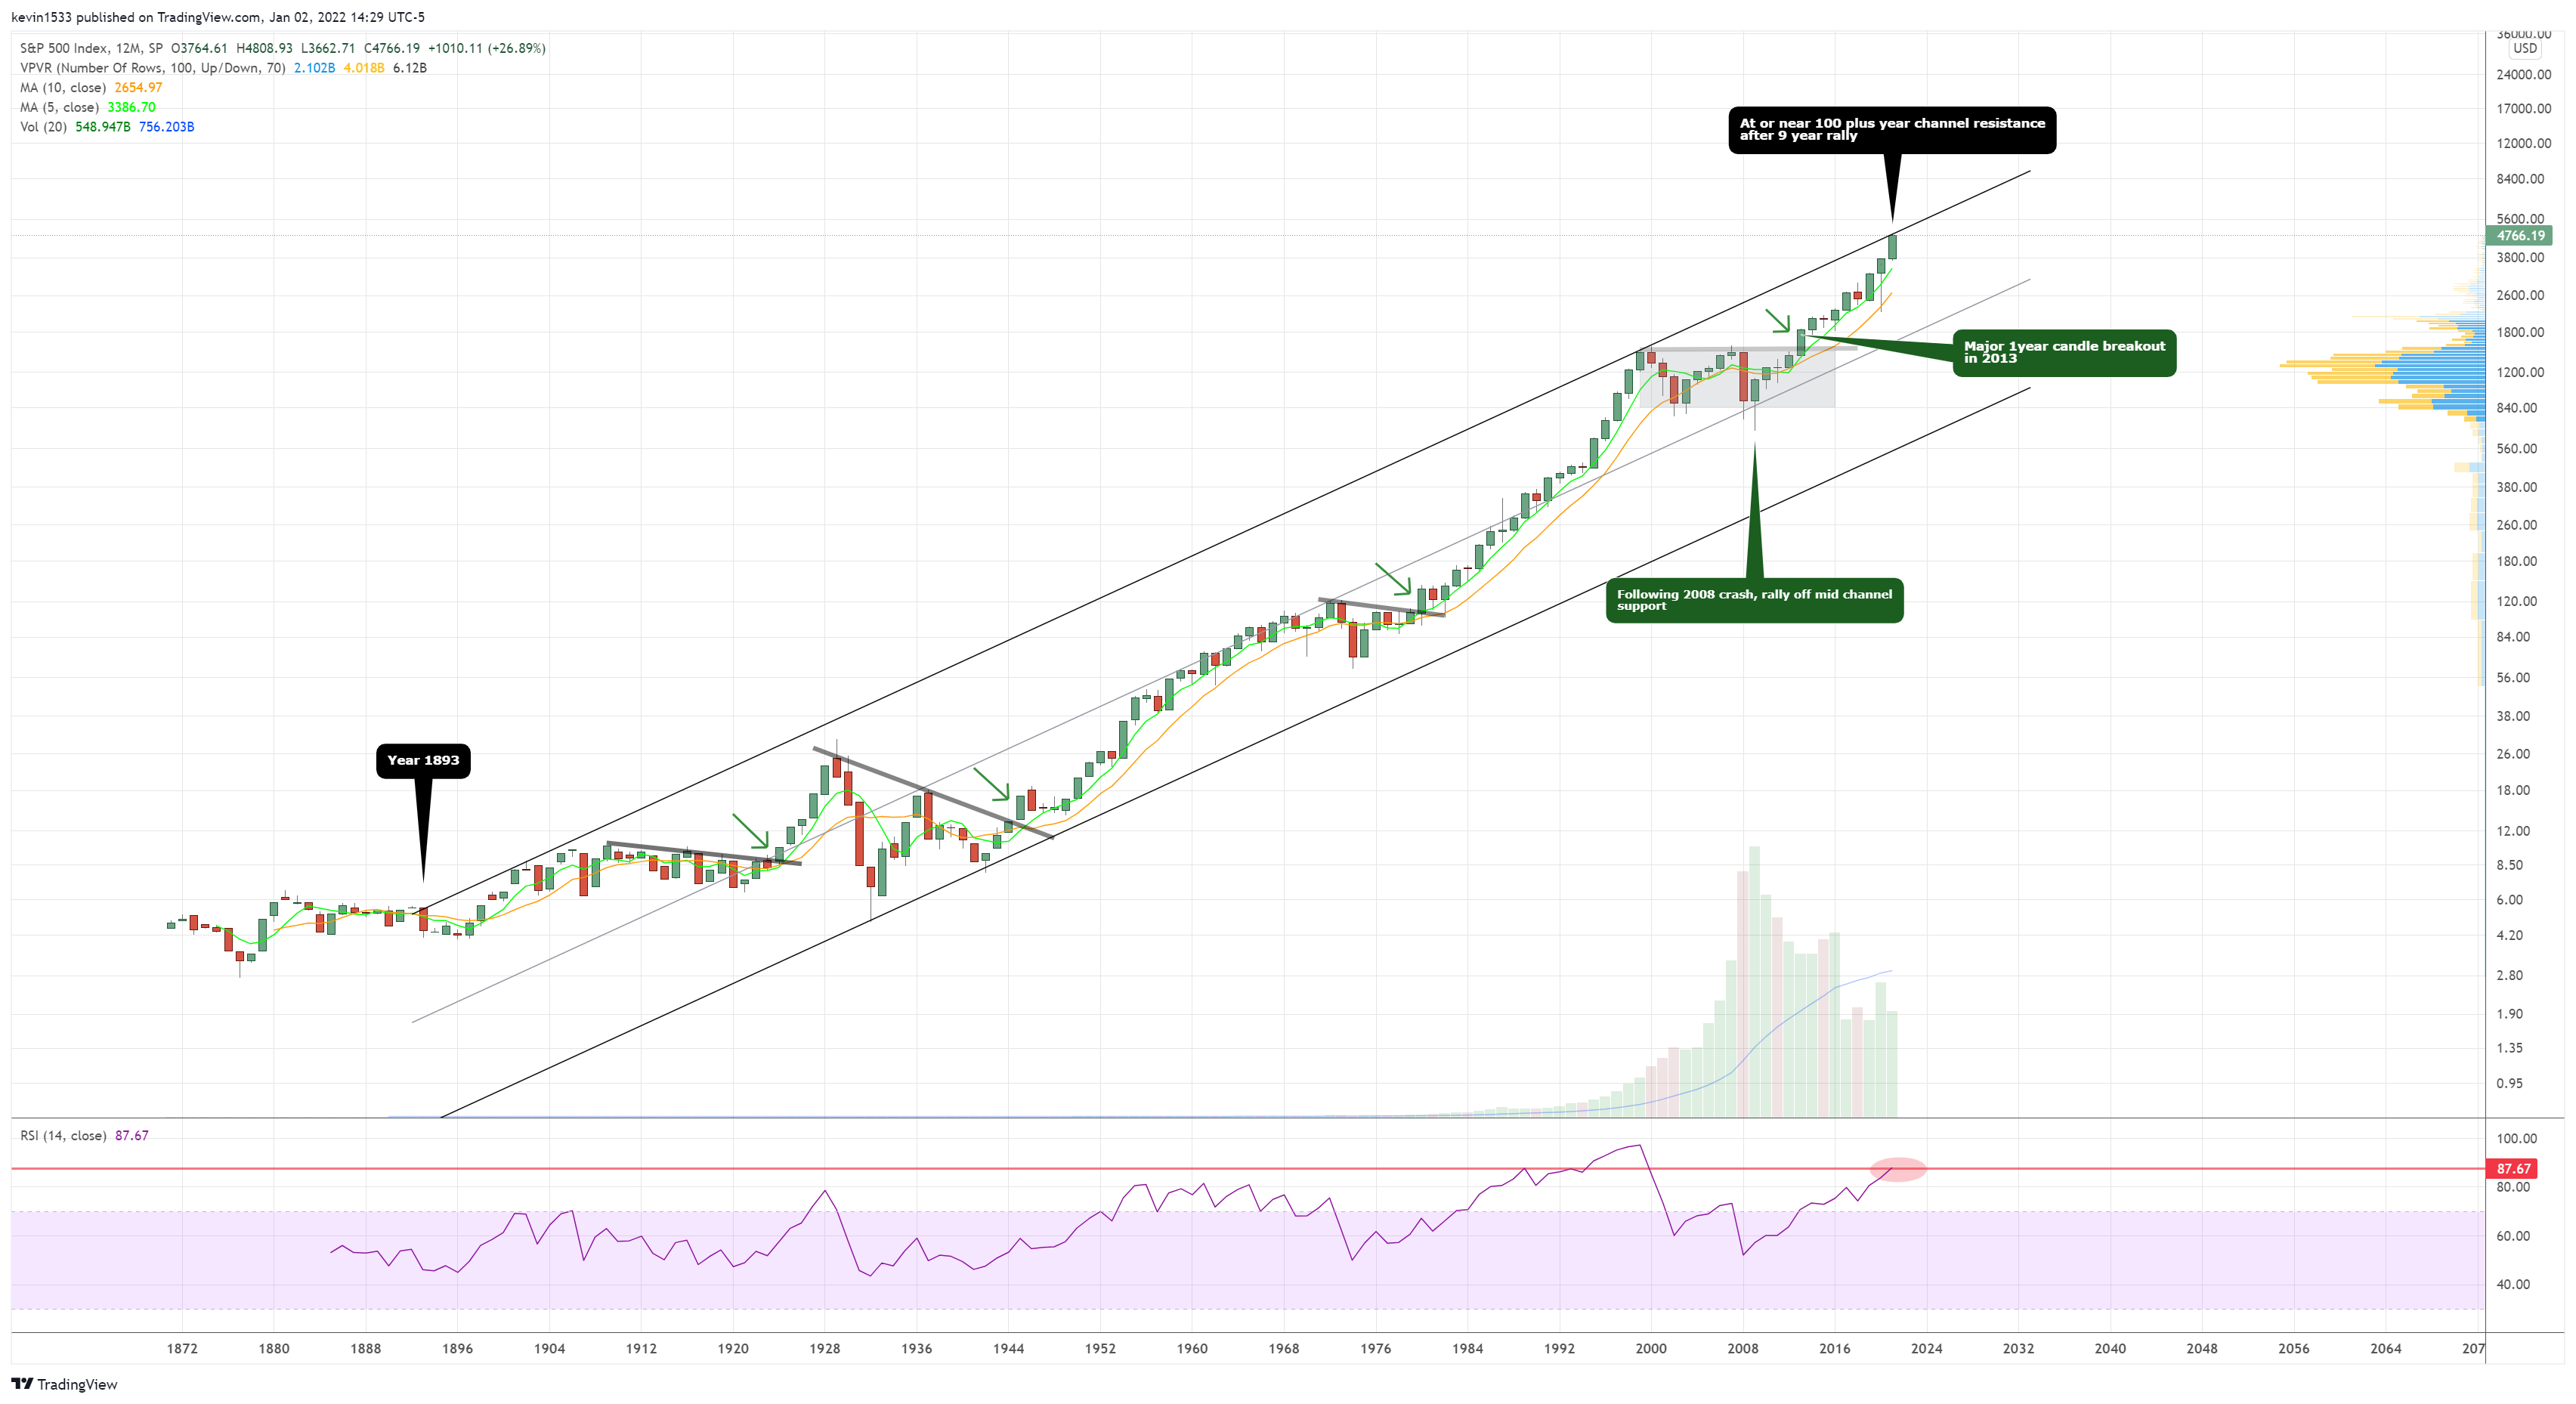
$SPX (Yearly, log scale) Since the 2021 completed, it only fitting that we look at the yearly candle and where we stand historically. Every the yearly historically has shown long term market direction as we can see from the chart below. We closed at or near a true life time channel top that extends from 1893 with RSI over 87 following a 9 year rally after the yearly breakout in 2013. Could this year be the start of a retracement downward and the start of a multi-year bear market? As with any individual chart in their respective timeframes, objectively look at this chart, the chances are high.
$SPX (monthly, log scale) Monthly candle held below 12year channel resistance as well as the channel extension from 2003. RSI negative divergence remains in play. As long as these channels continue to hold, it will be difficult to push into new ATHs without some significant retracement or multi-month consolidation.

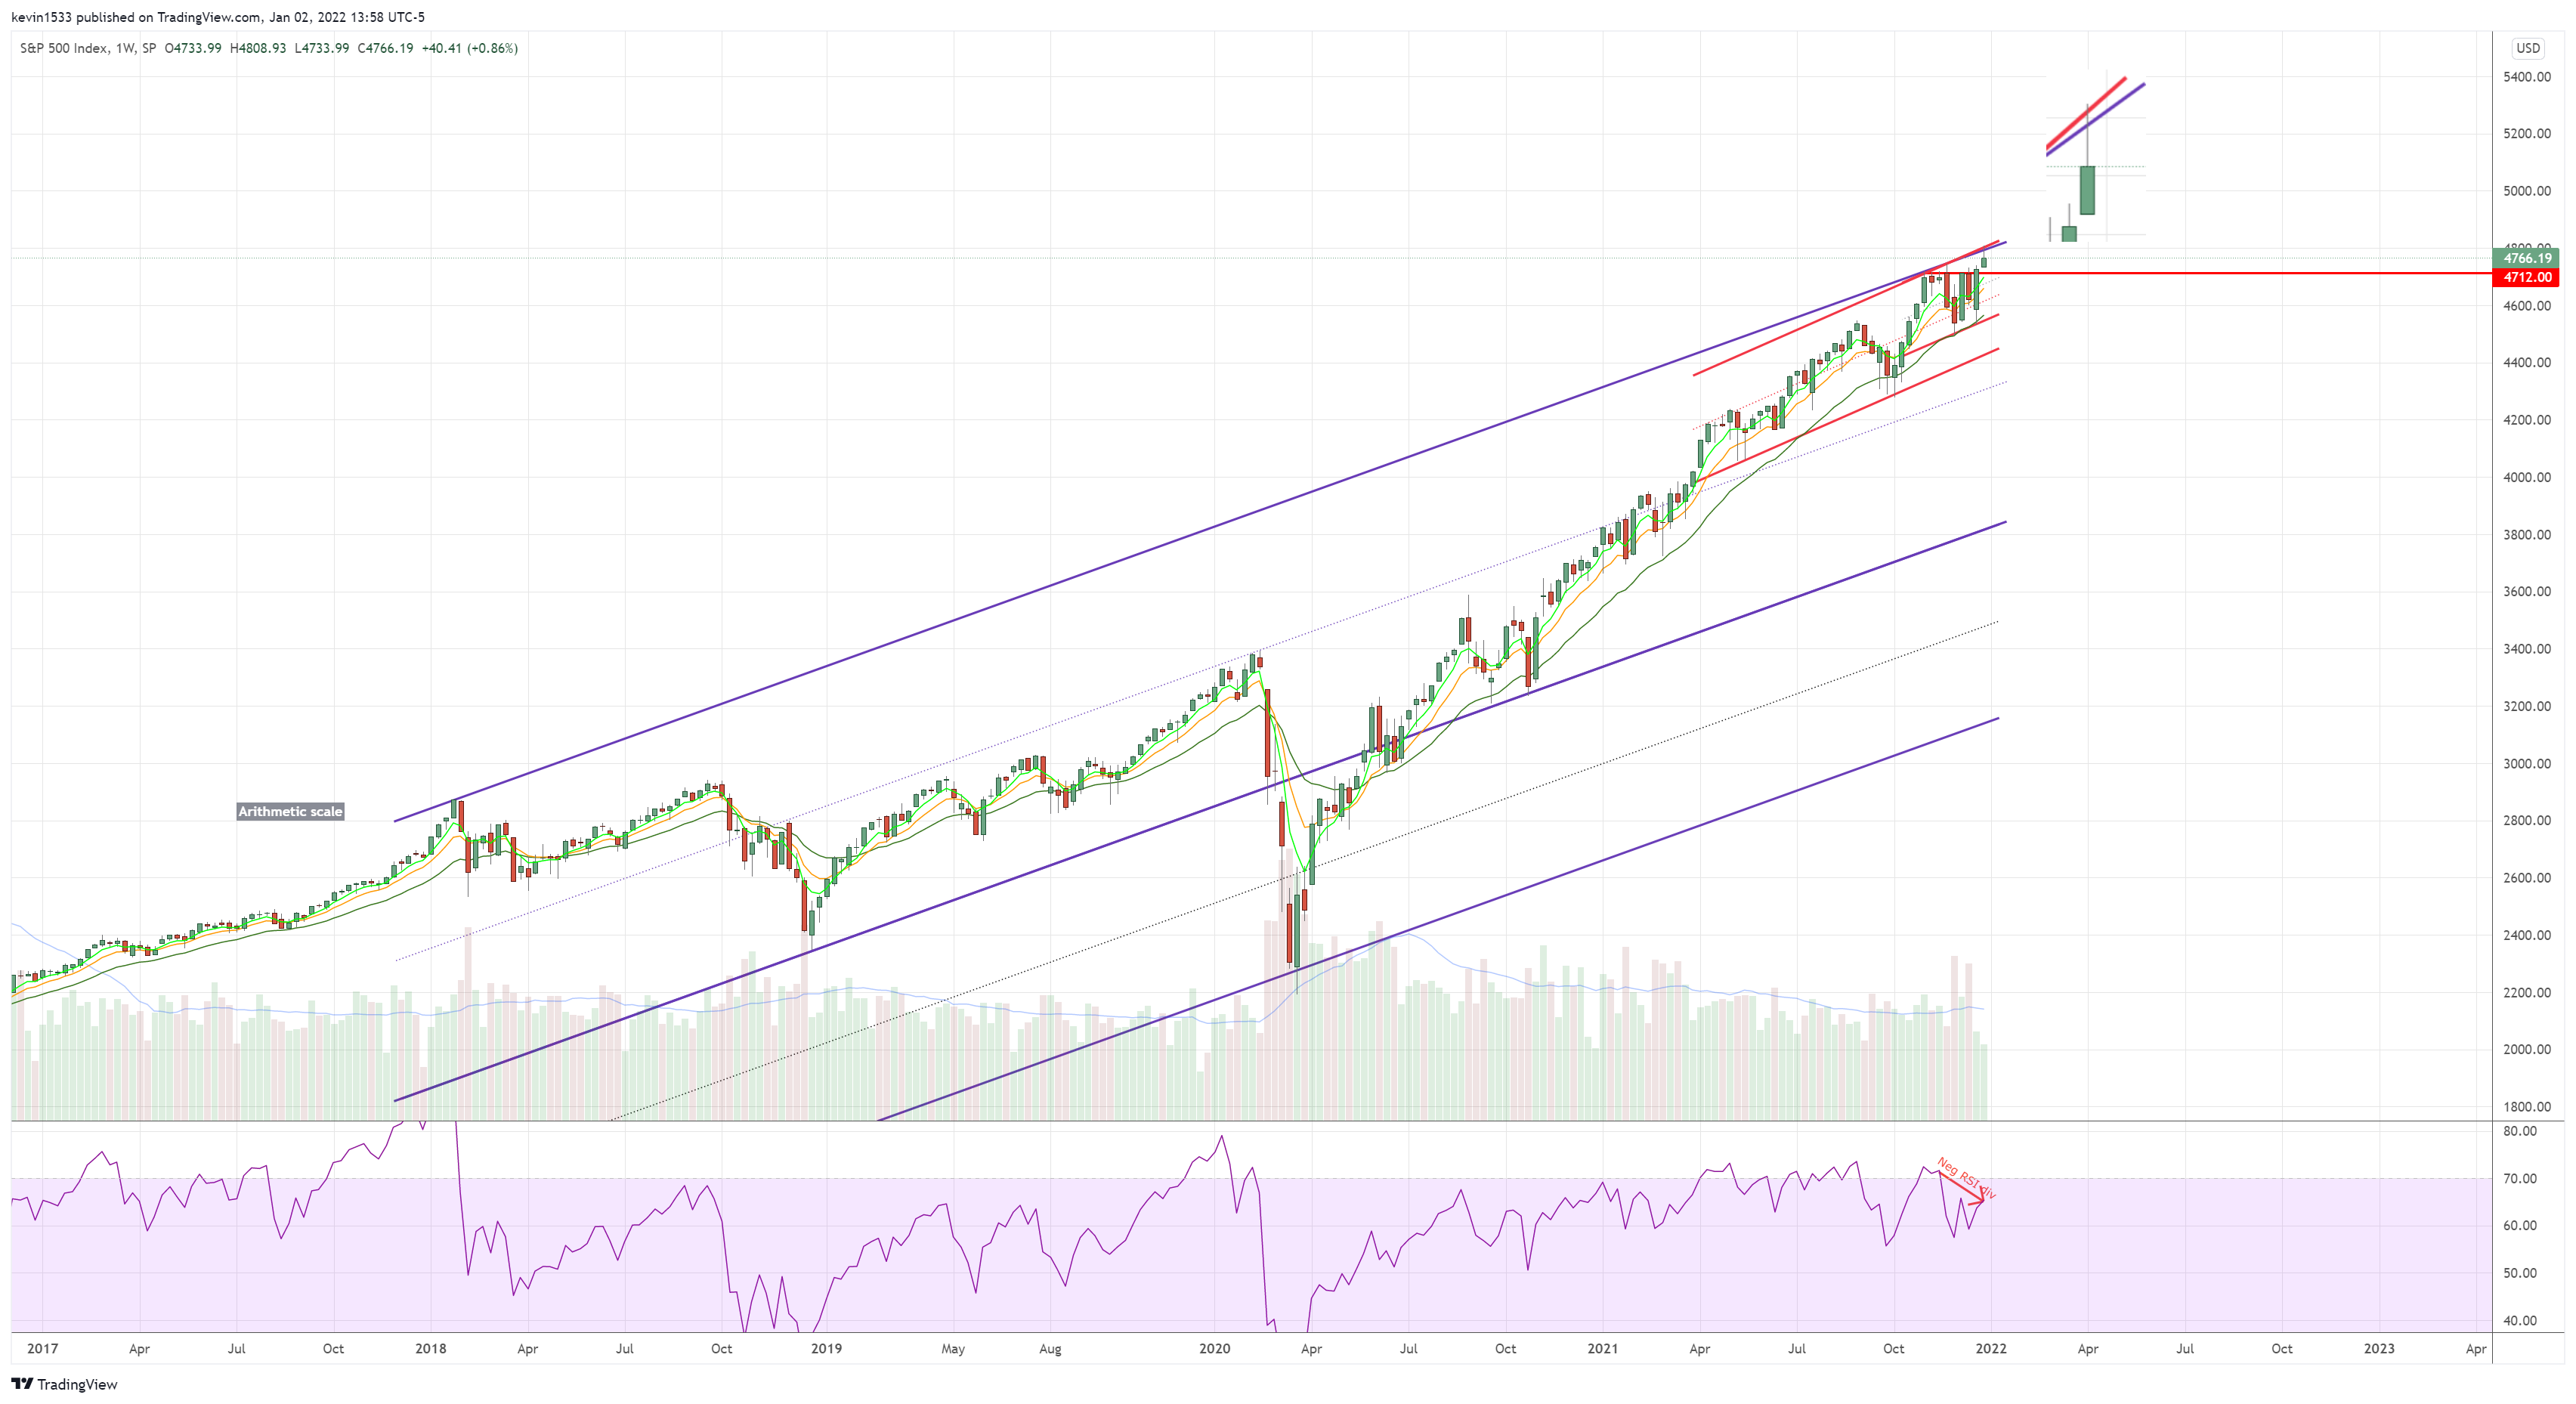
Now lets look at the short term arithmetic scale channels…
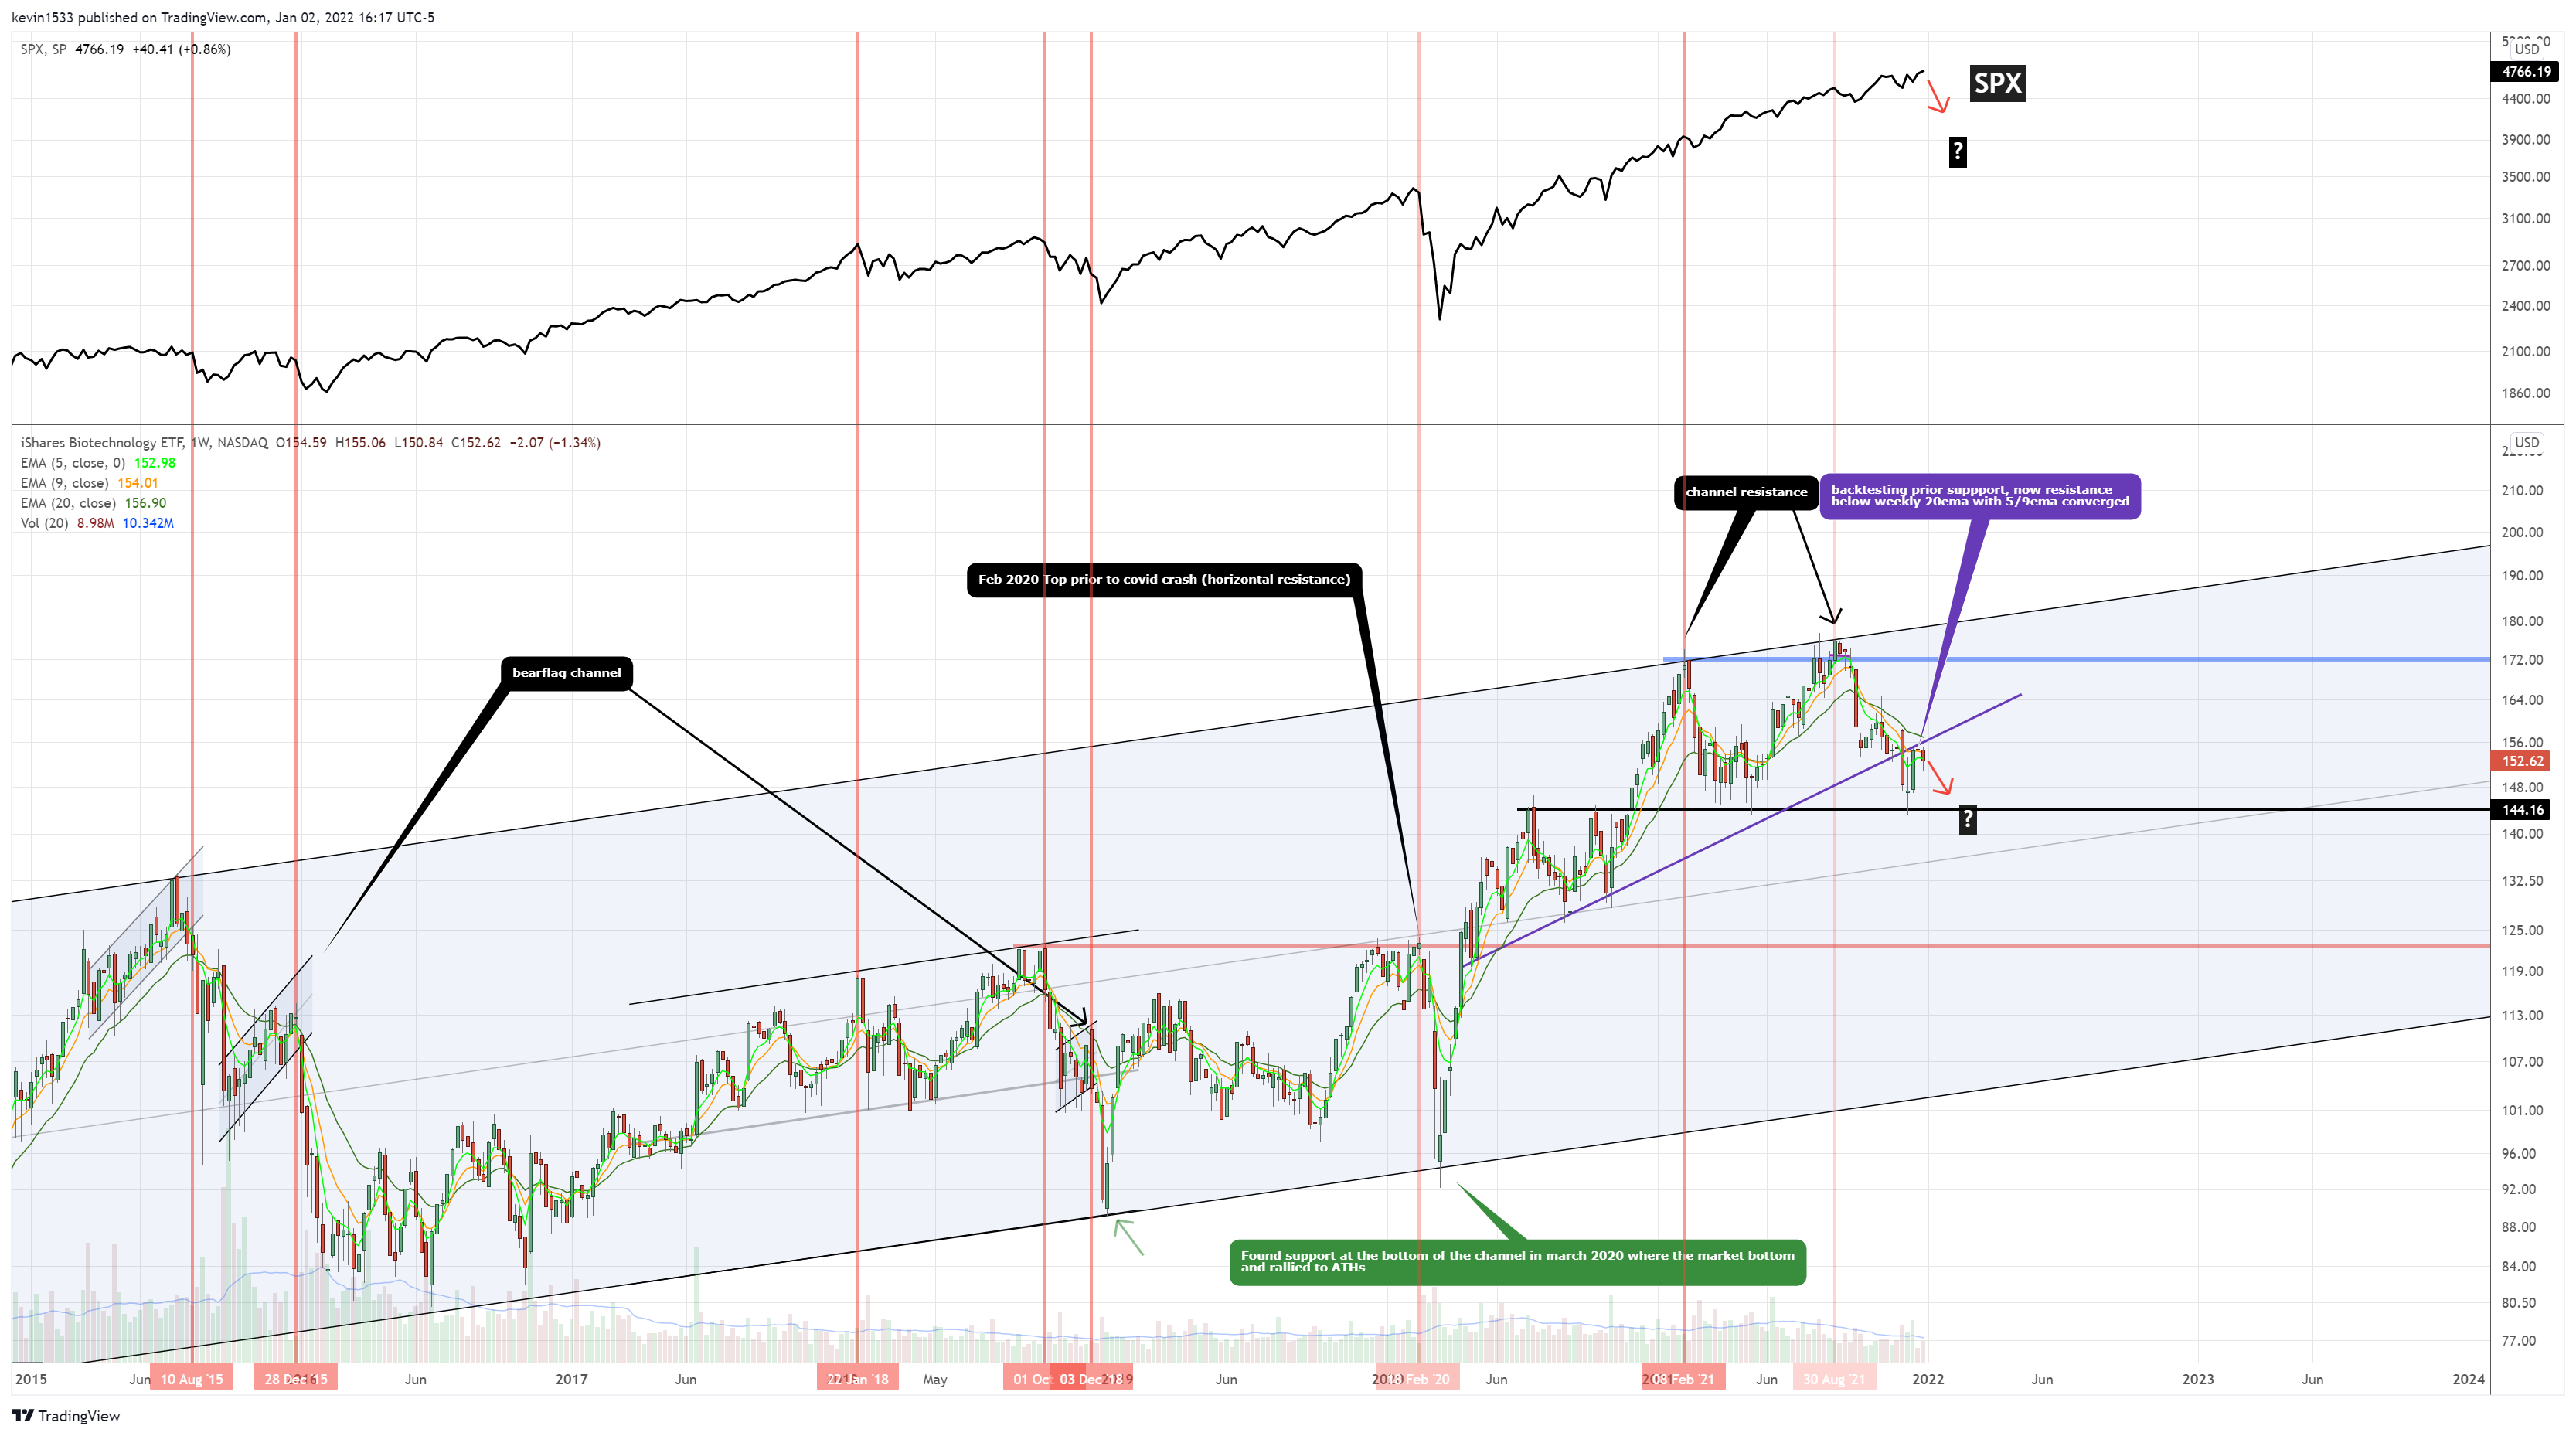
$SPX (weekly, arithmetic scale) rejected at the channel resistance with negative RSI divergence
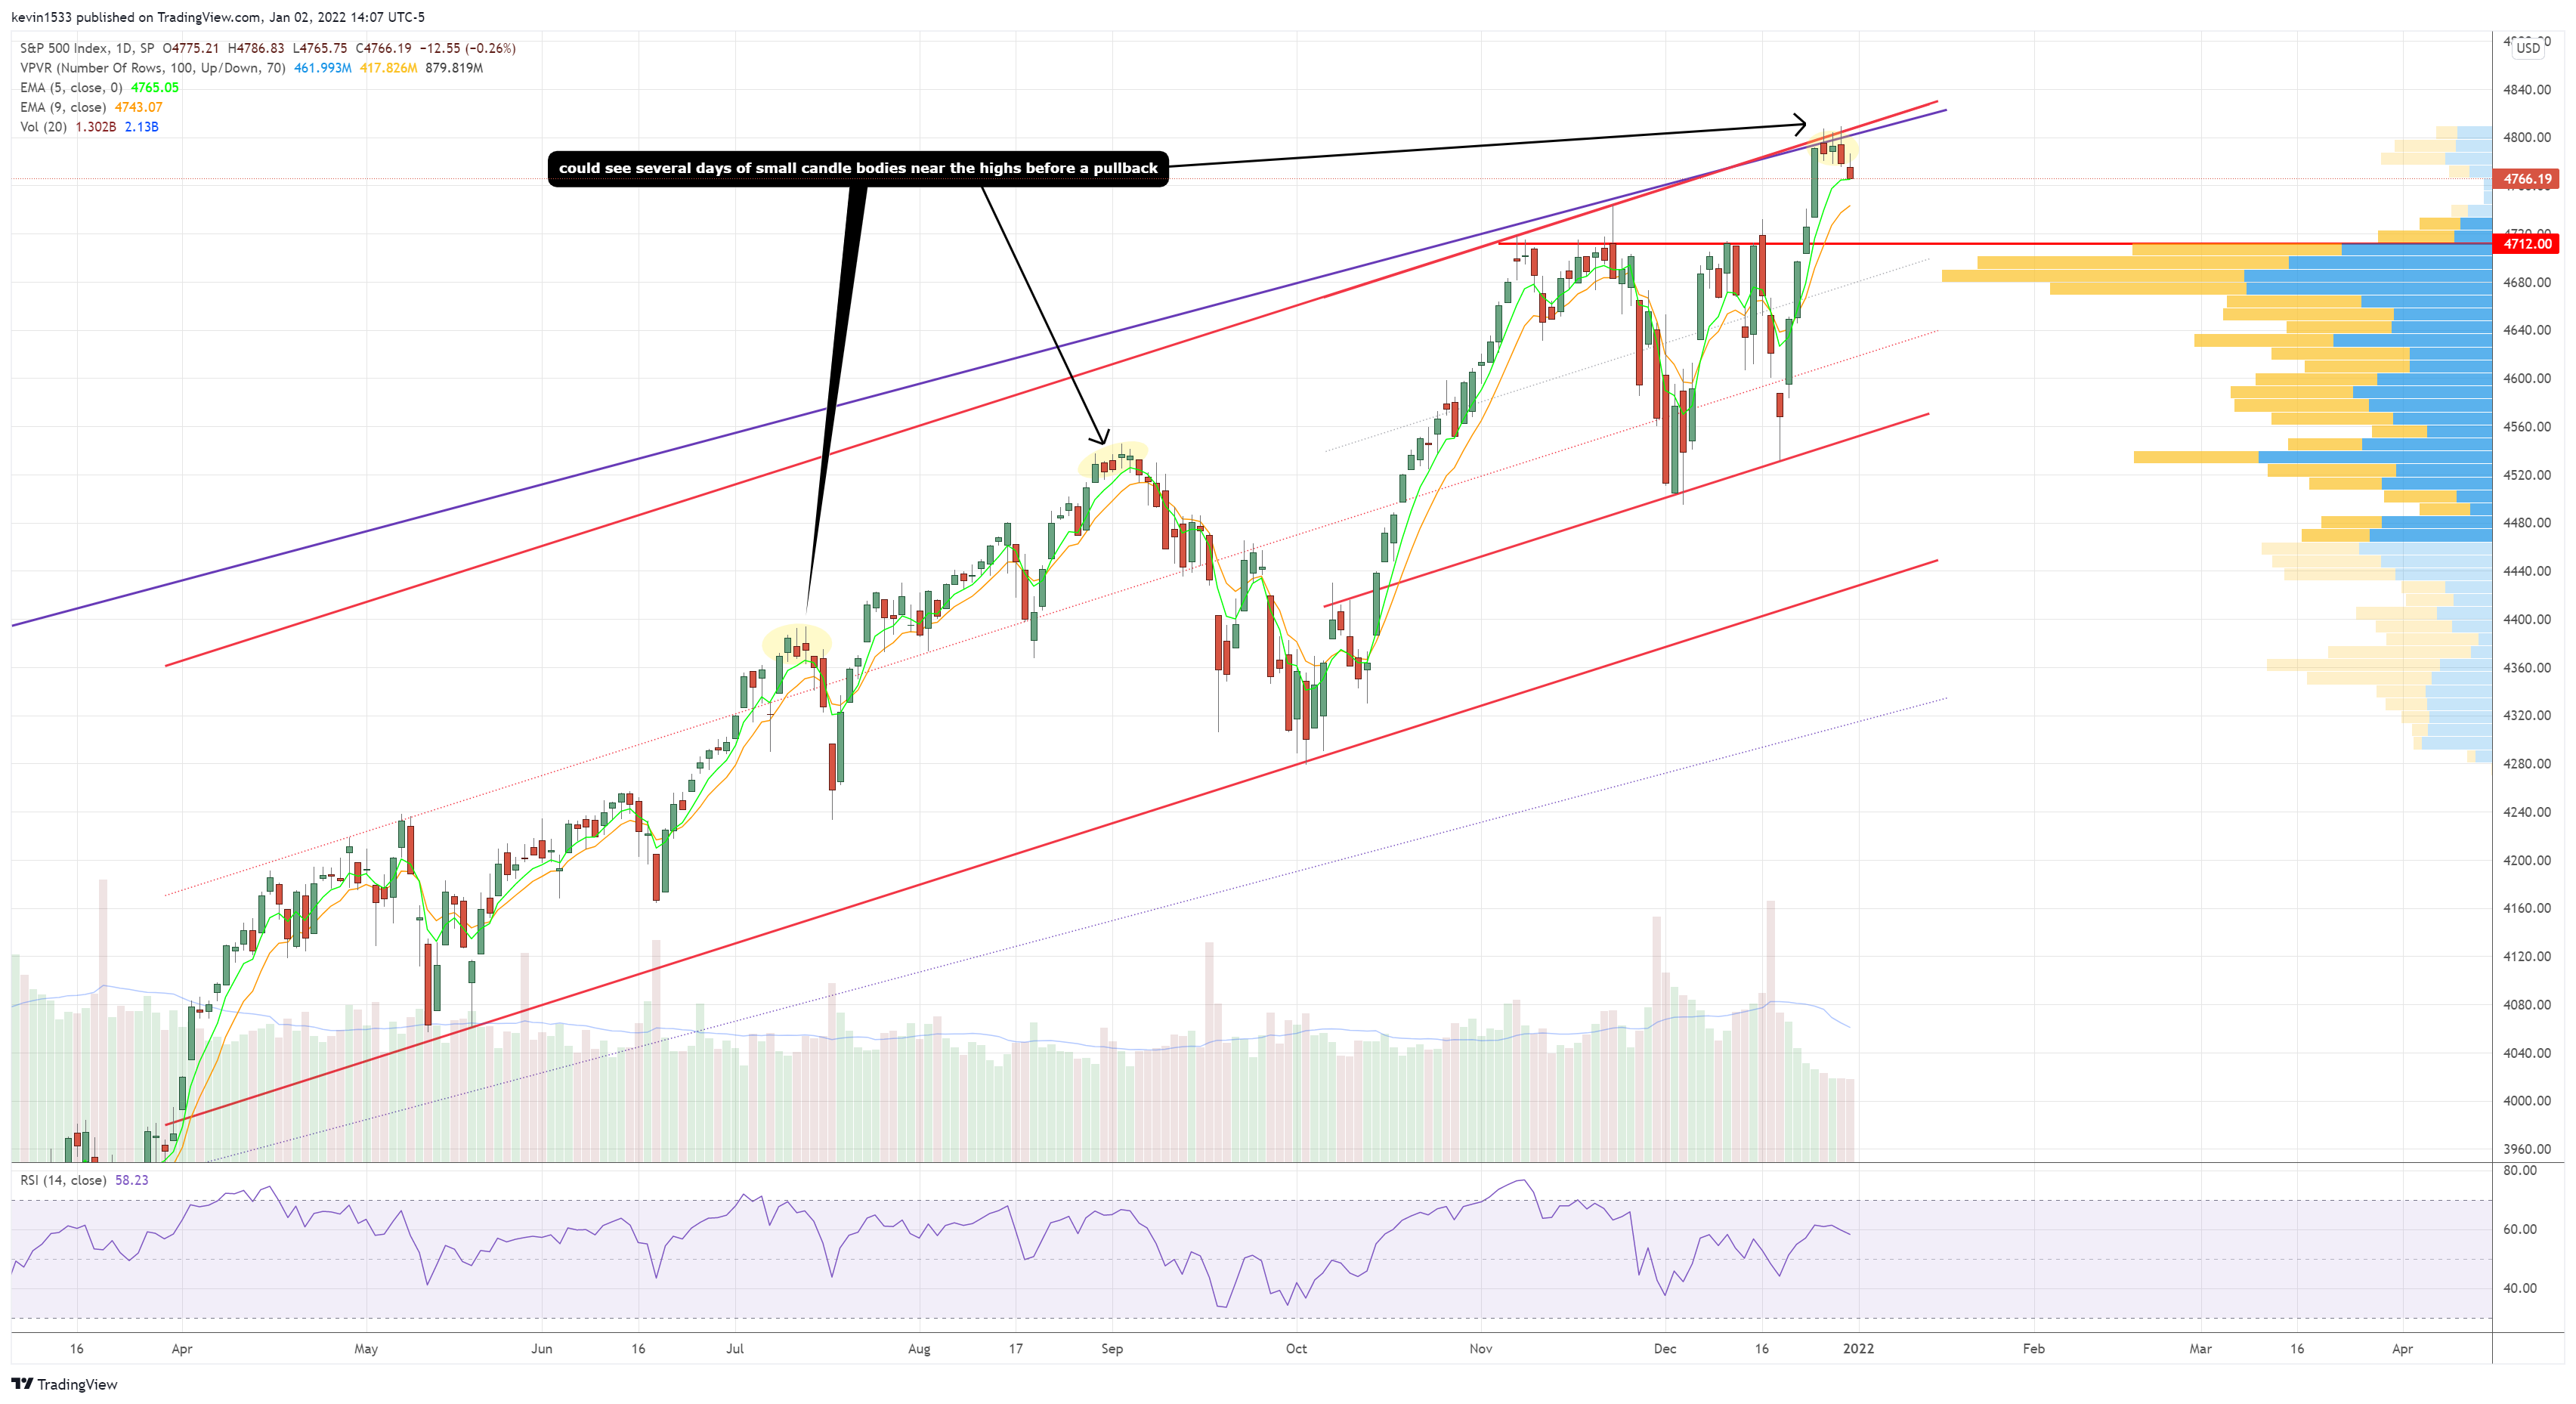
$SPX (daily) So far we got the small bodies candles at channel resistance with bearish engulfing candle on Thursday and then follow-through candle down on Friday. Would expect a move down to the backtest of 4712 level which is the bullish breakout level. If bulls cant defend there and we get a false breakout reversal below, it could open up strong momentum to the downside.

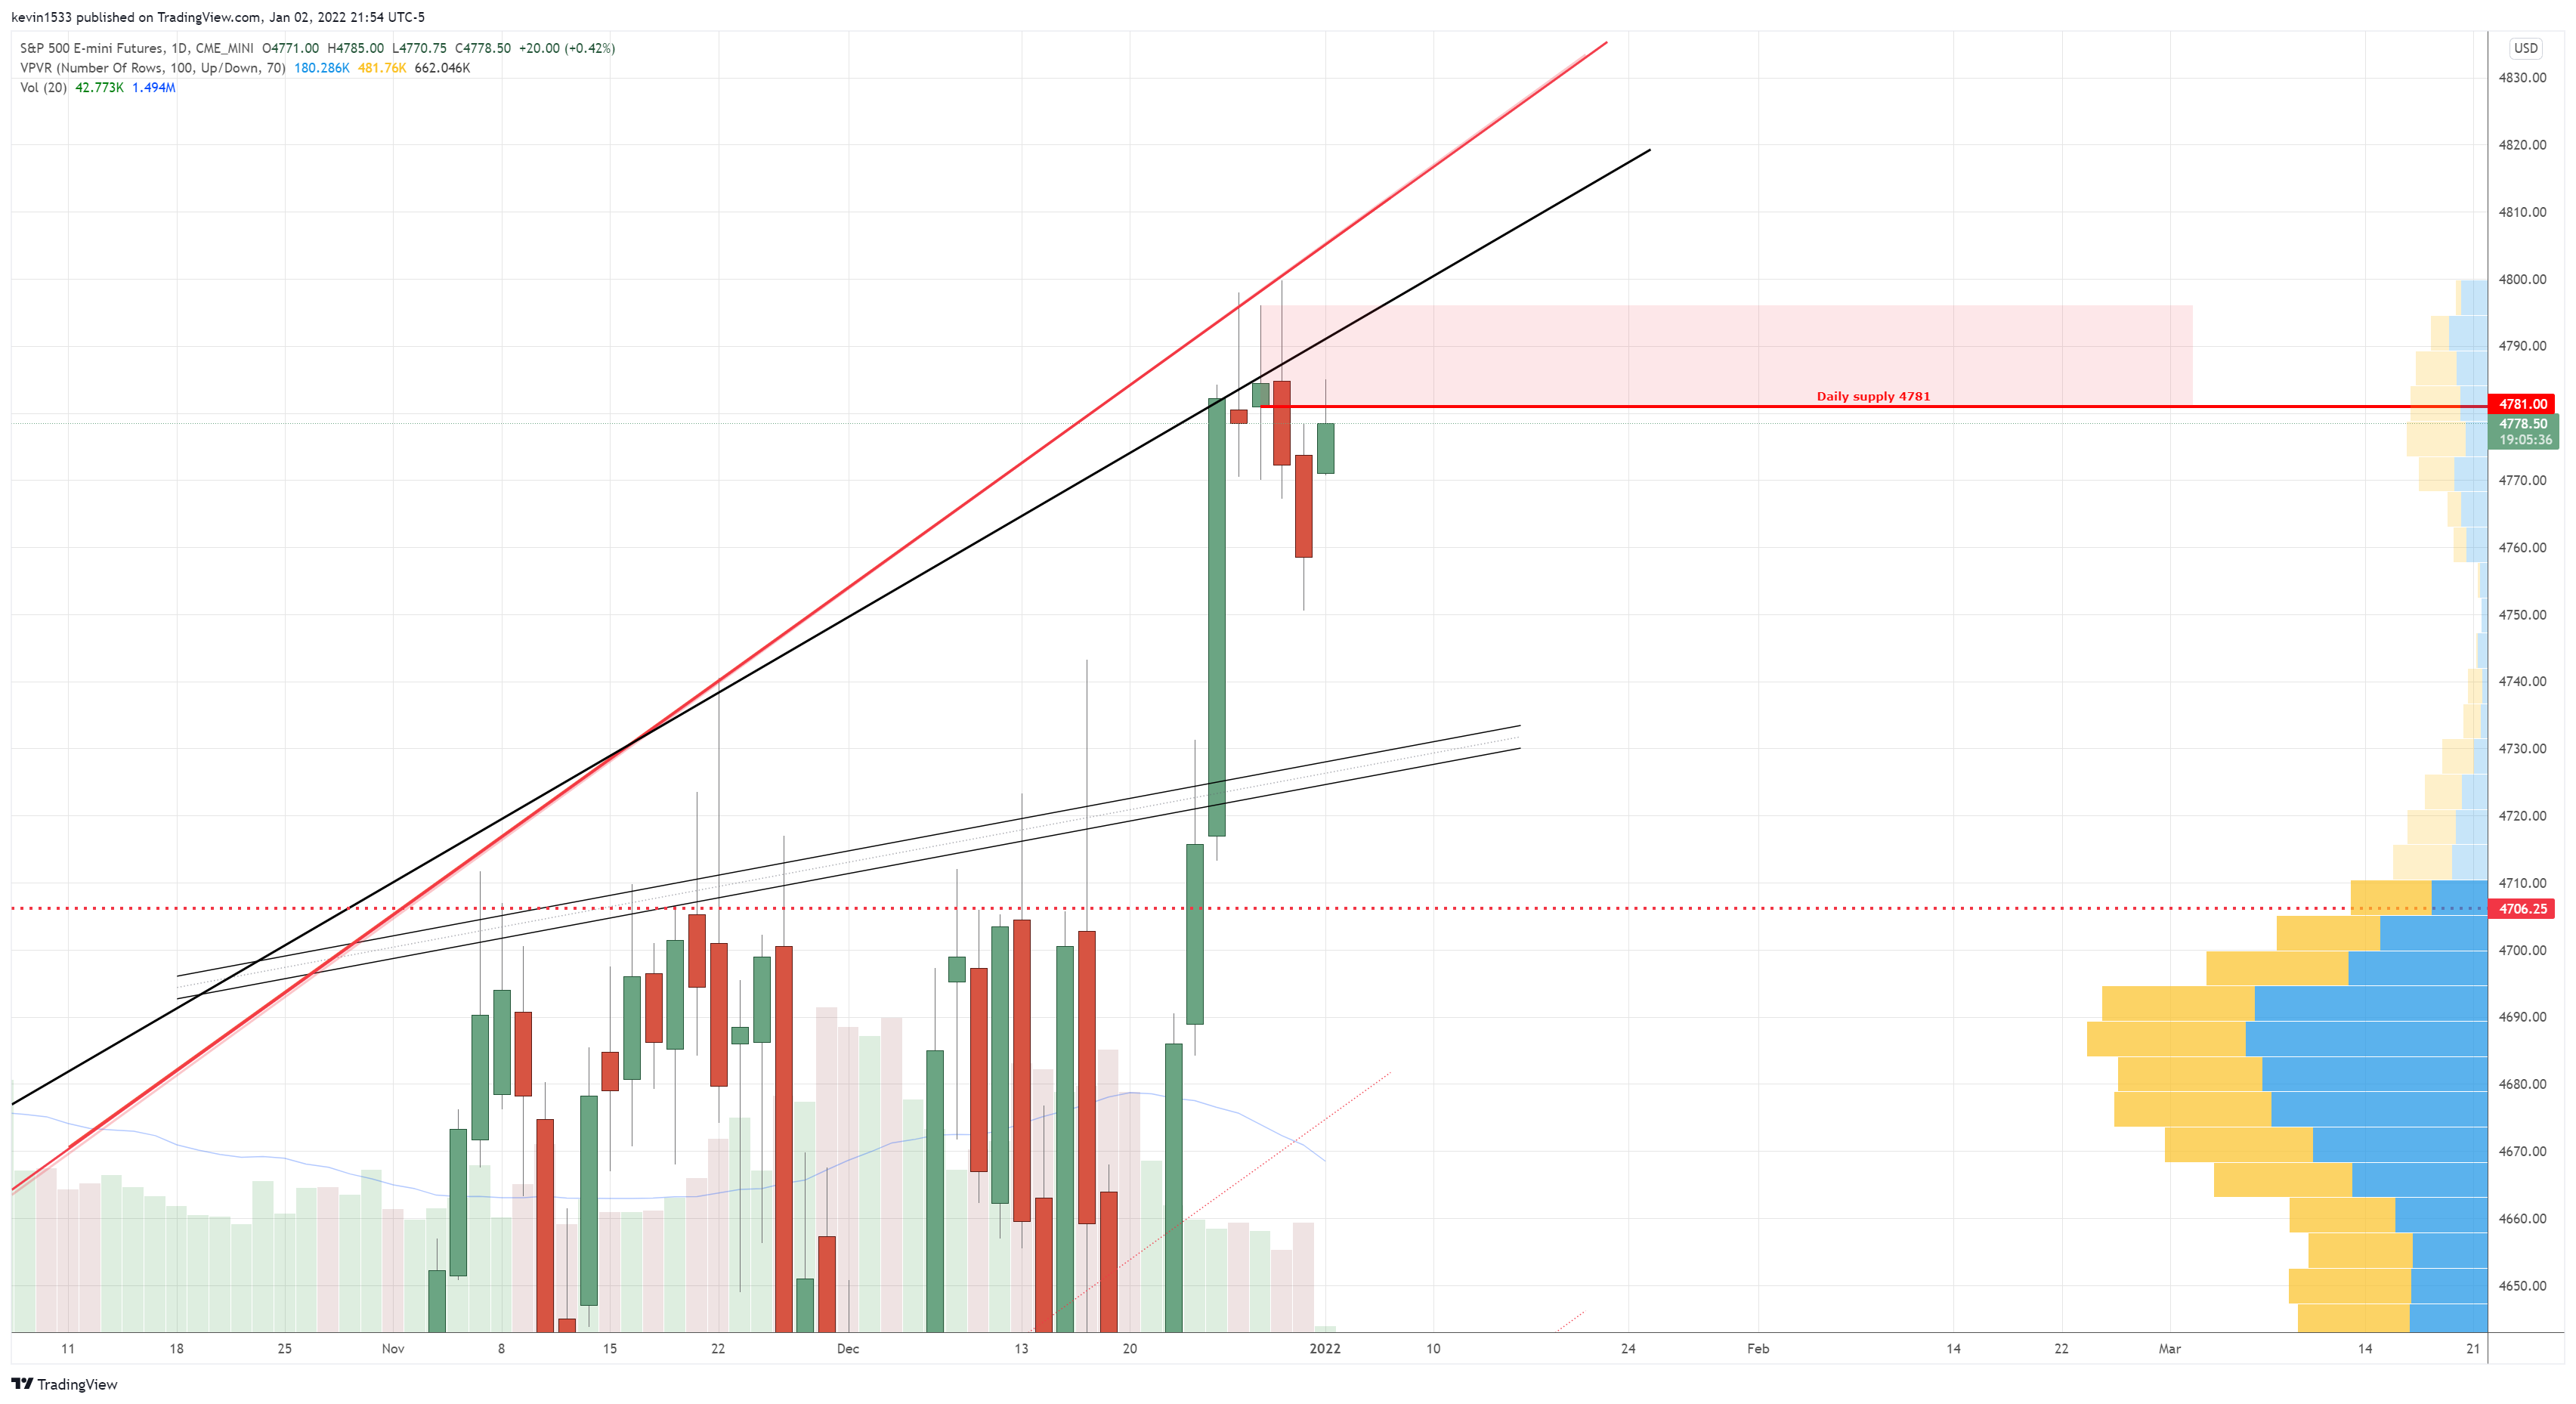
$ES_F (daily) futures currently at daily supply
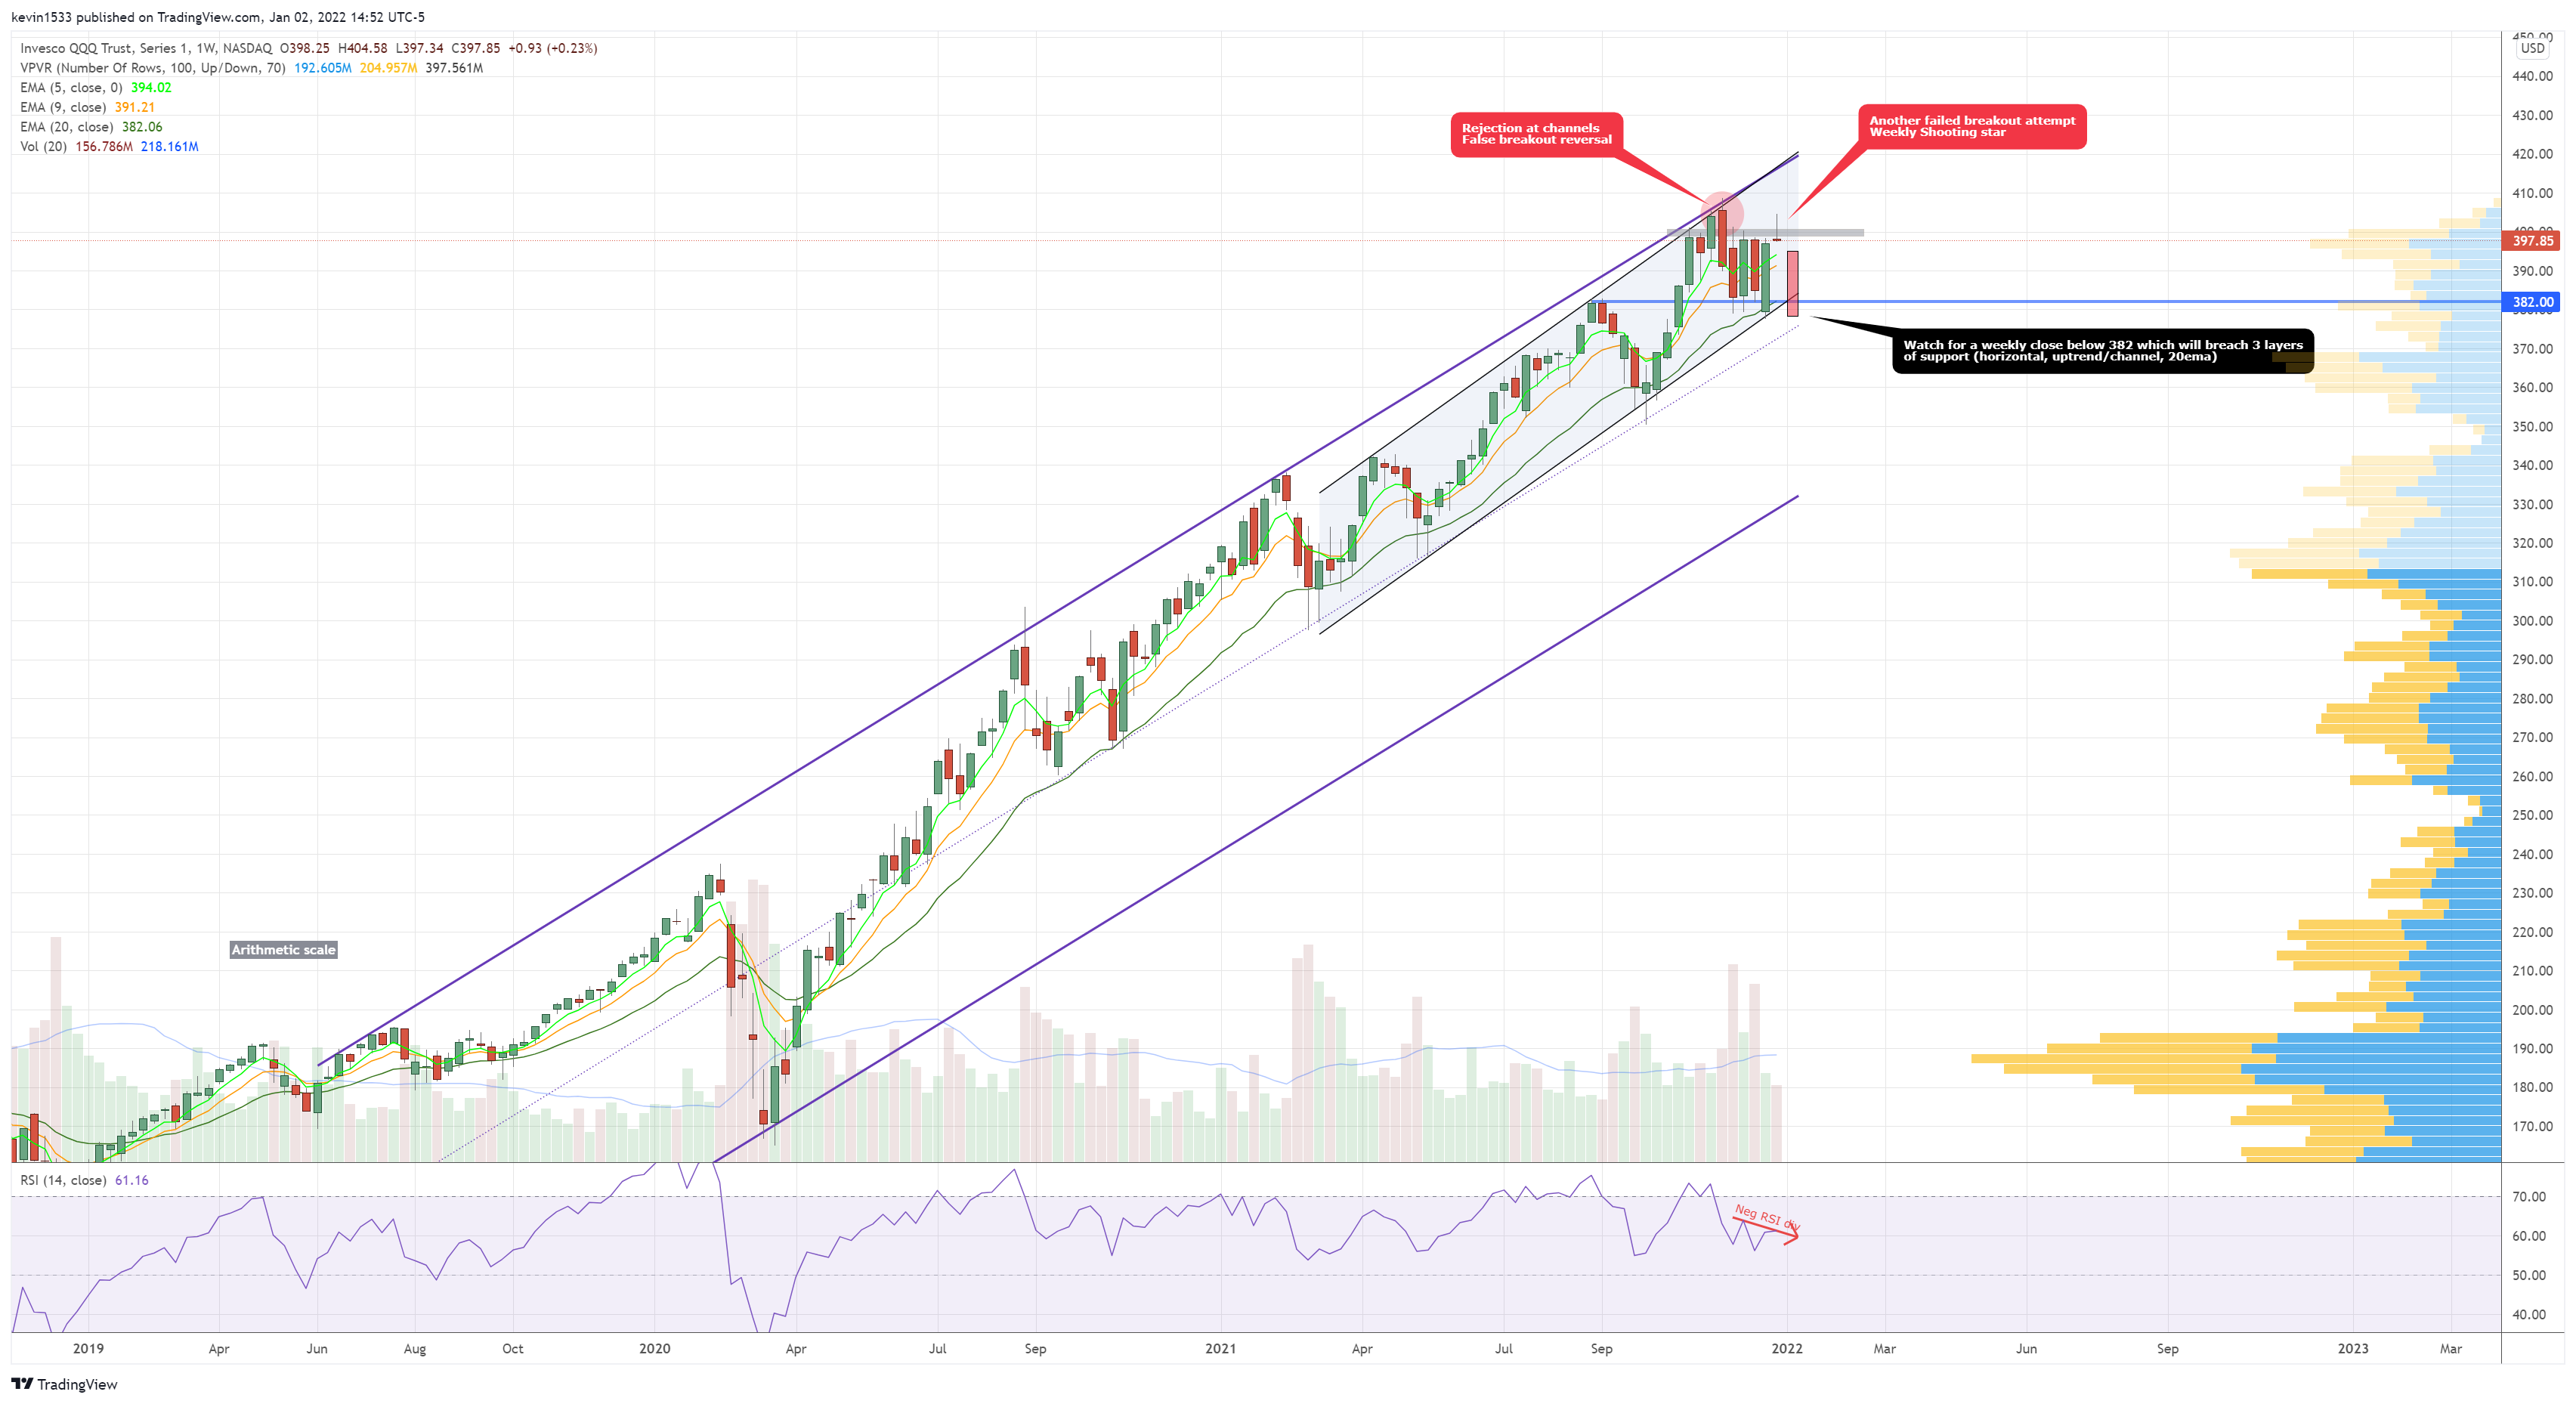
$QQQ (weekly) so far we had the channel rejection plus false breakout reversal back in November. Following month long consolidation below, bulls made another push after resistance and failed with a shooting star to close the year. Bears continue to be in control as they have defended where needed. Question is do they finally take control with 5/9/20ema weekly converged
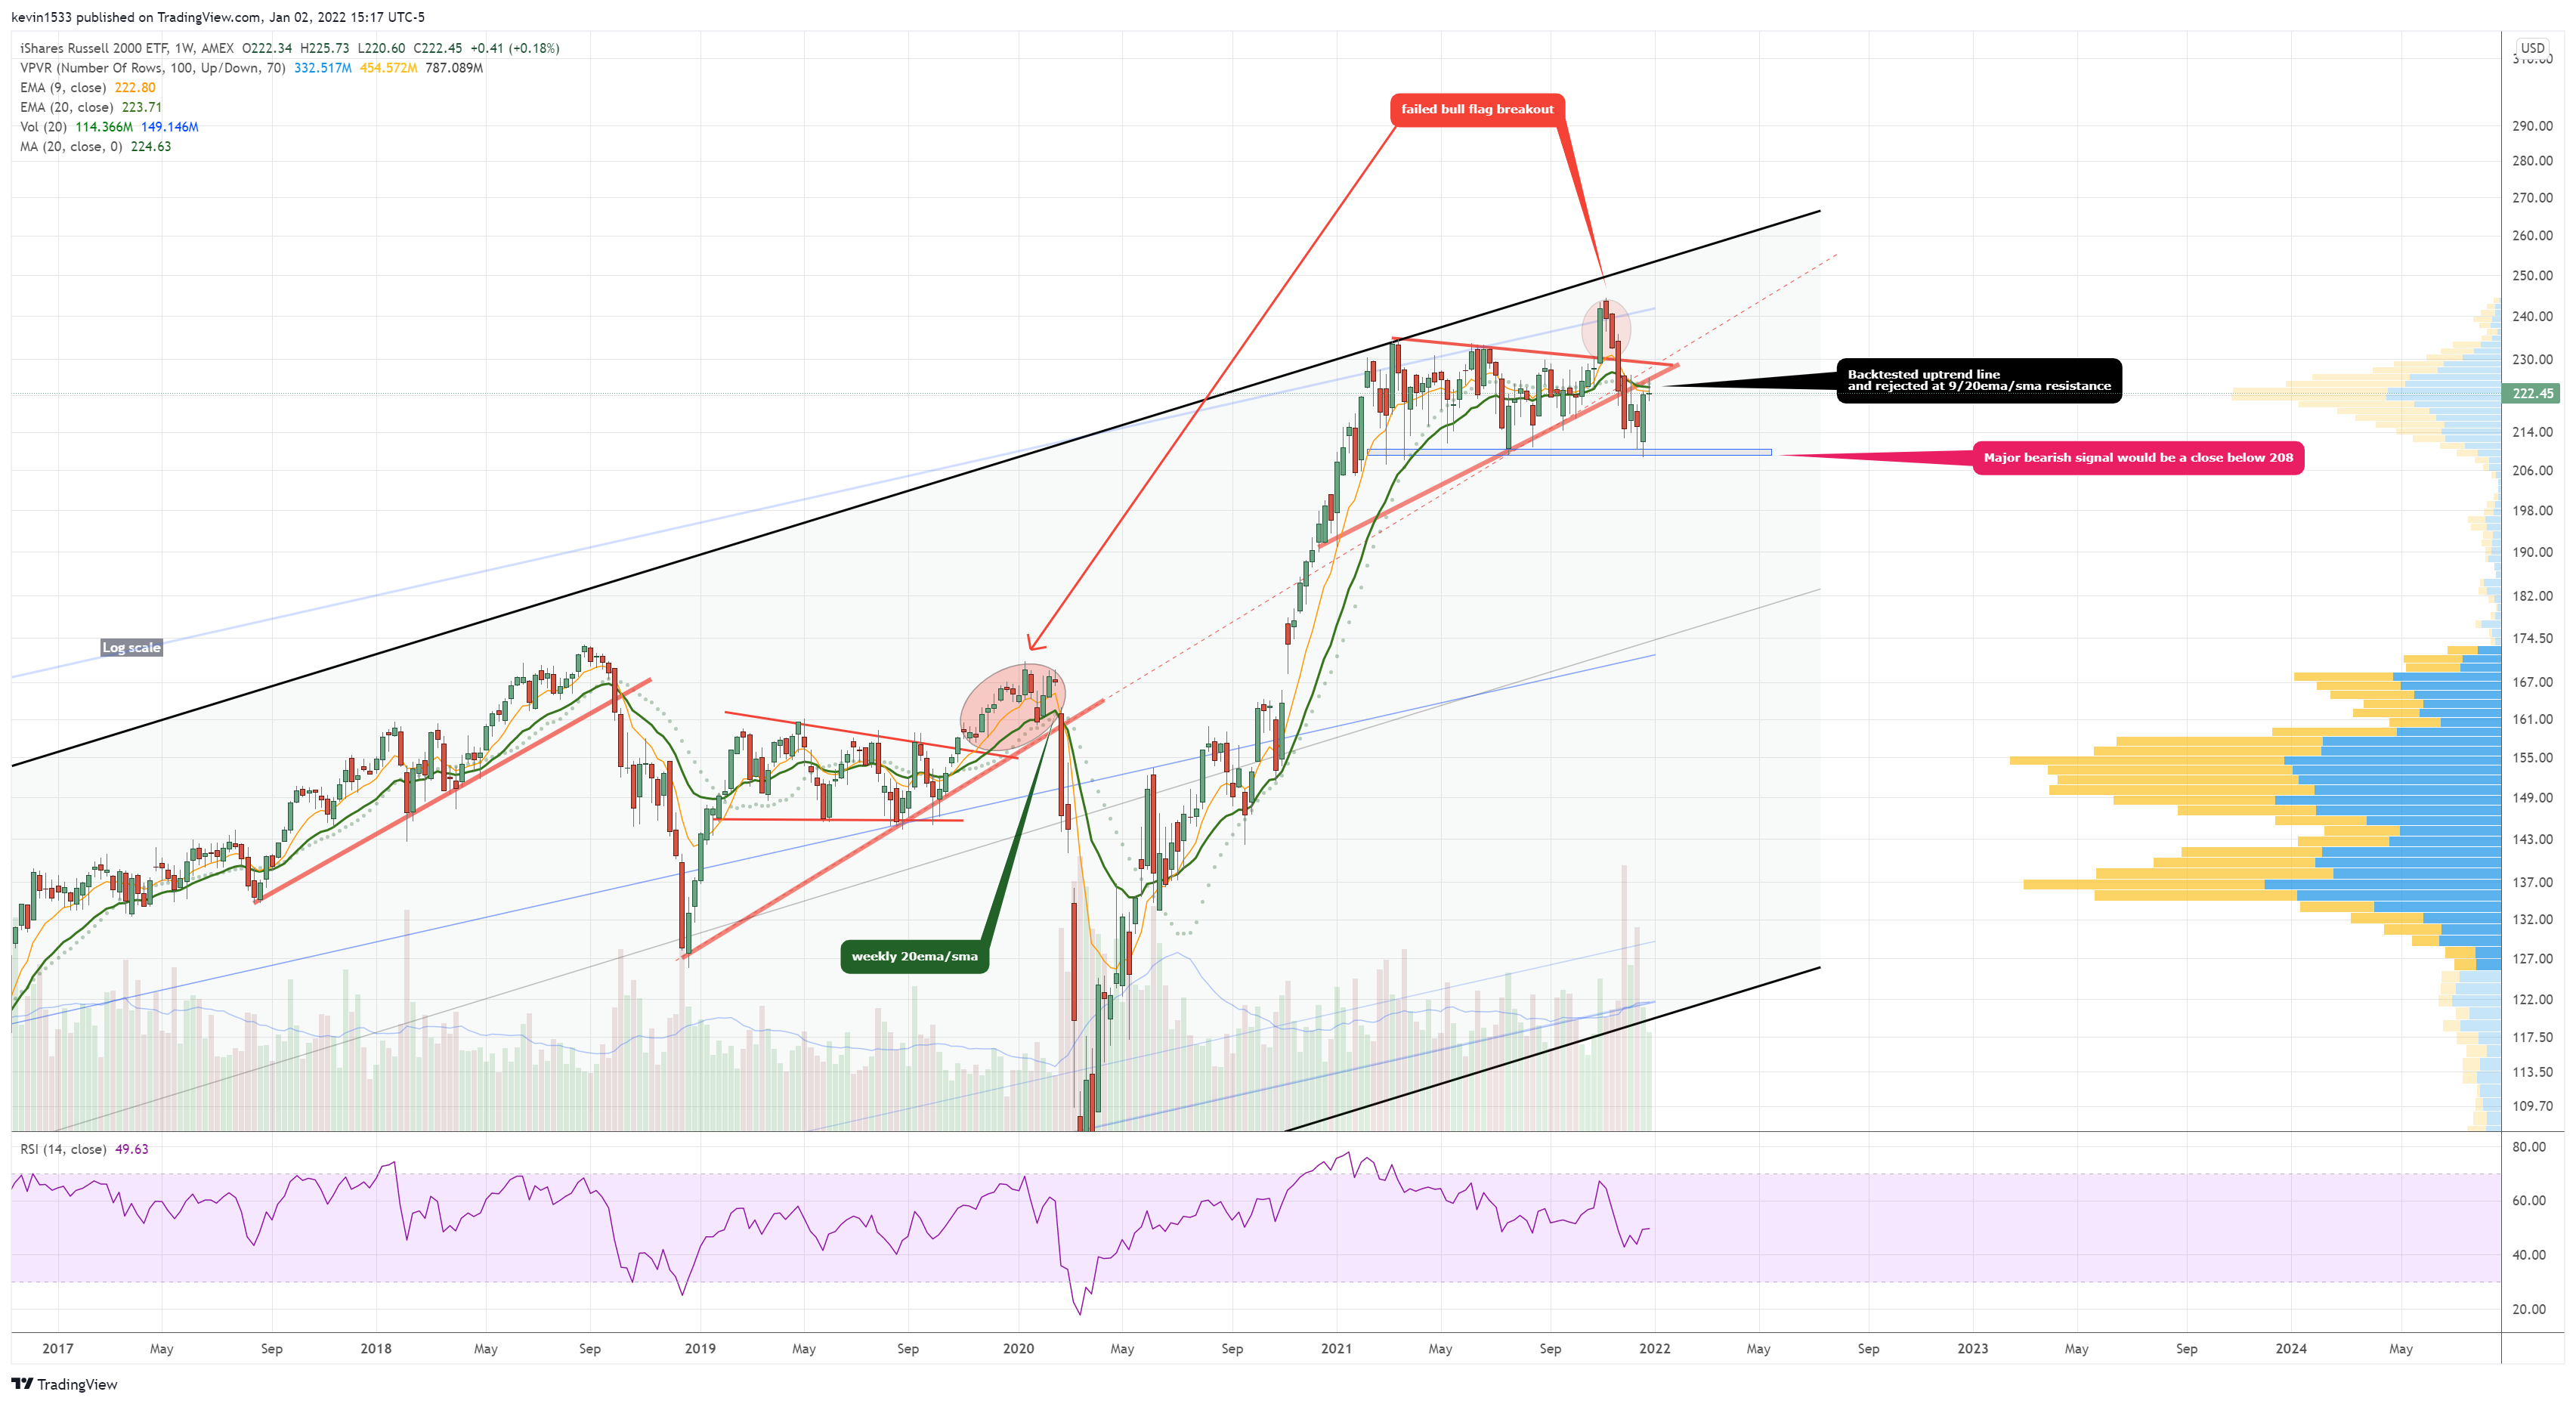
$IWM (weekly) rallied into prior uptrend line support(not resistance) and rejected there along with 9/20ema,sma resistance. Technically should see a move back downwards. Close below 208 should open the doors for the bears.
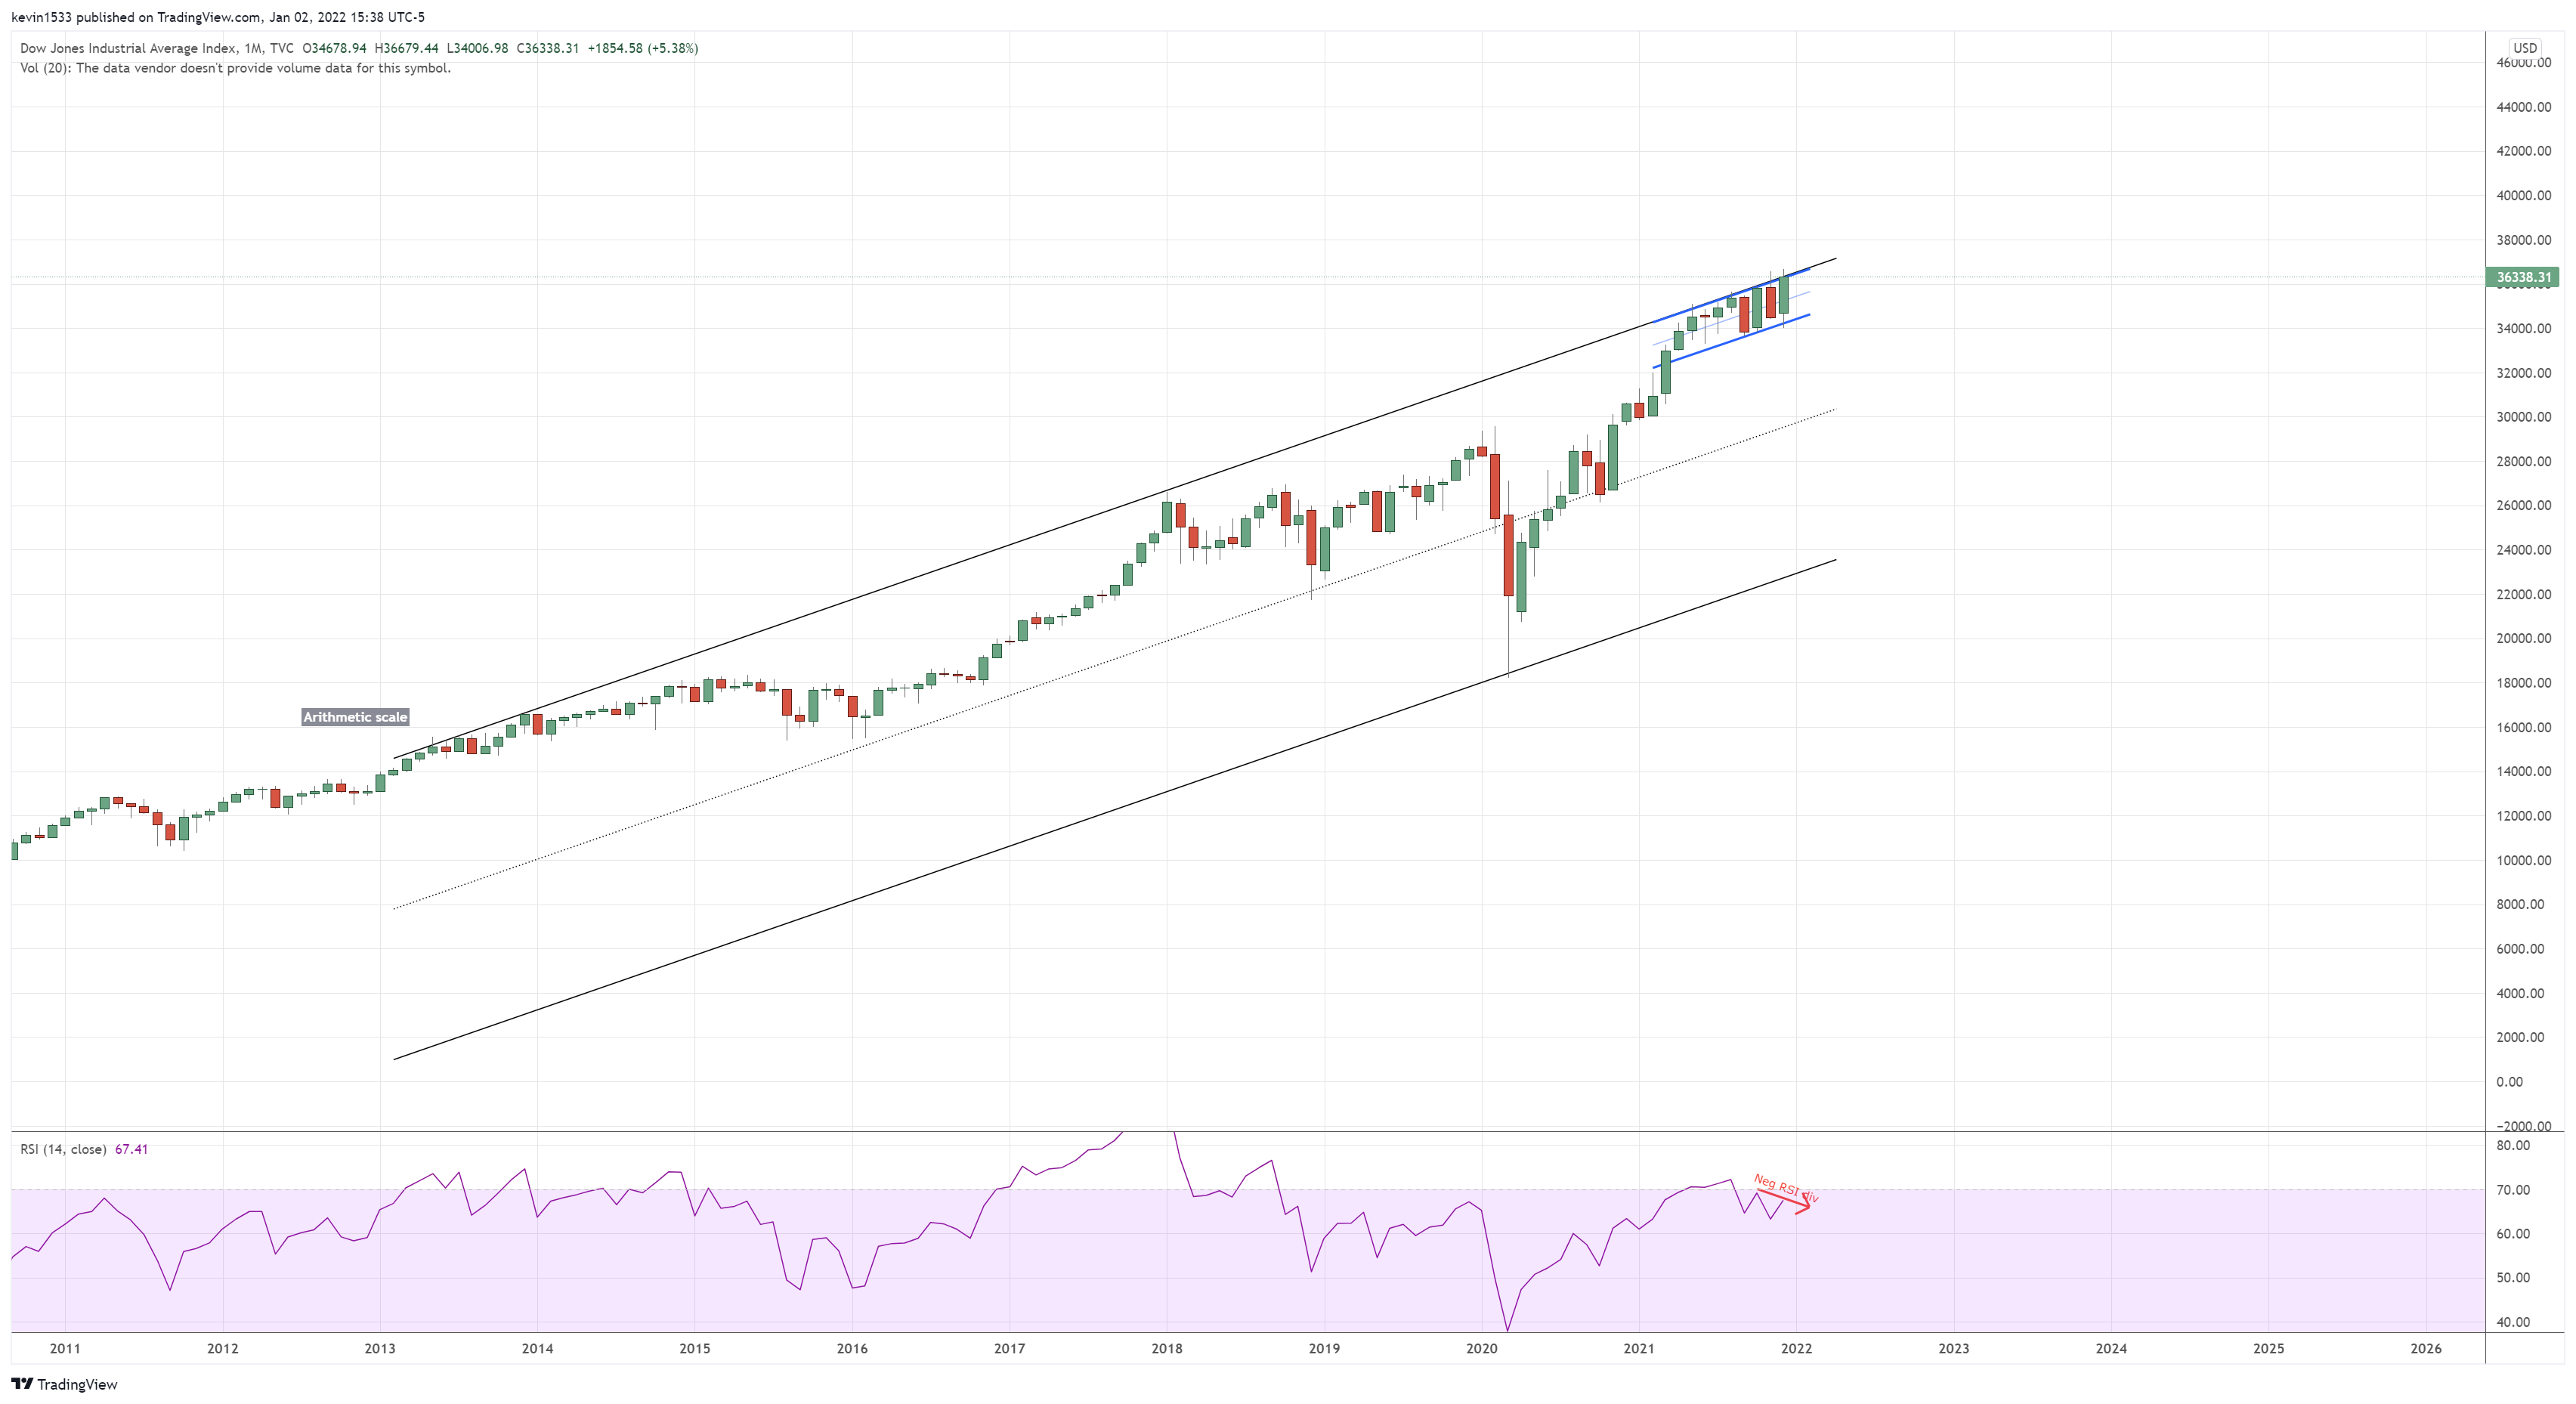
$DJI (monthly) closed at channel resistance with negative RSI divergence
$CL oil futures (weekly) Bearish Head and shoulders in play as we got the rejection at the horizontal resistance for potential lower high. Bigger picture we so far have the false breakout reversal and major wedge breakdown and currently a relief bounce.

$HGX Housing sector (daily) closed at resistance with negative divergence

$IBB (weekly) Rejected off the backtest and closed blow 5/9ema.
$SMH semis (monthly) hanging man and inside bar at ATHs at 9year channel resistance with negative RSI divergence

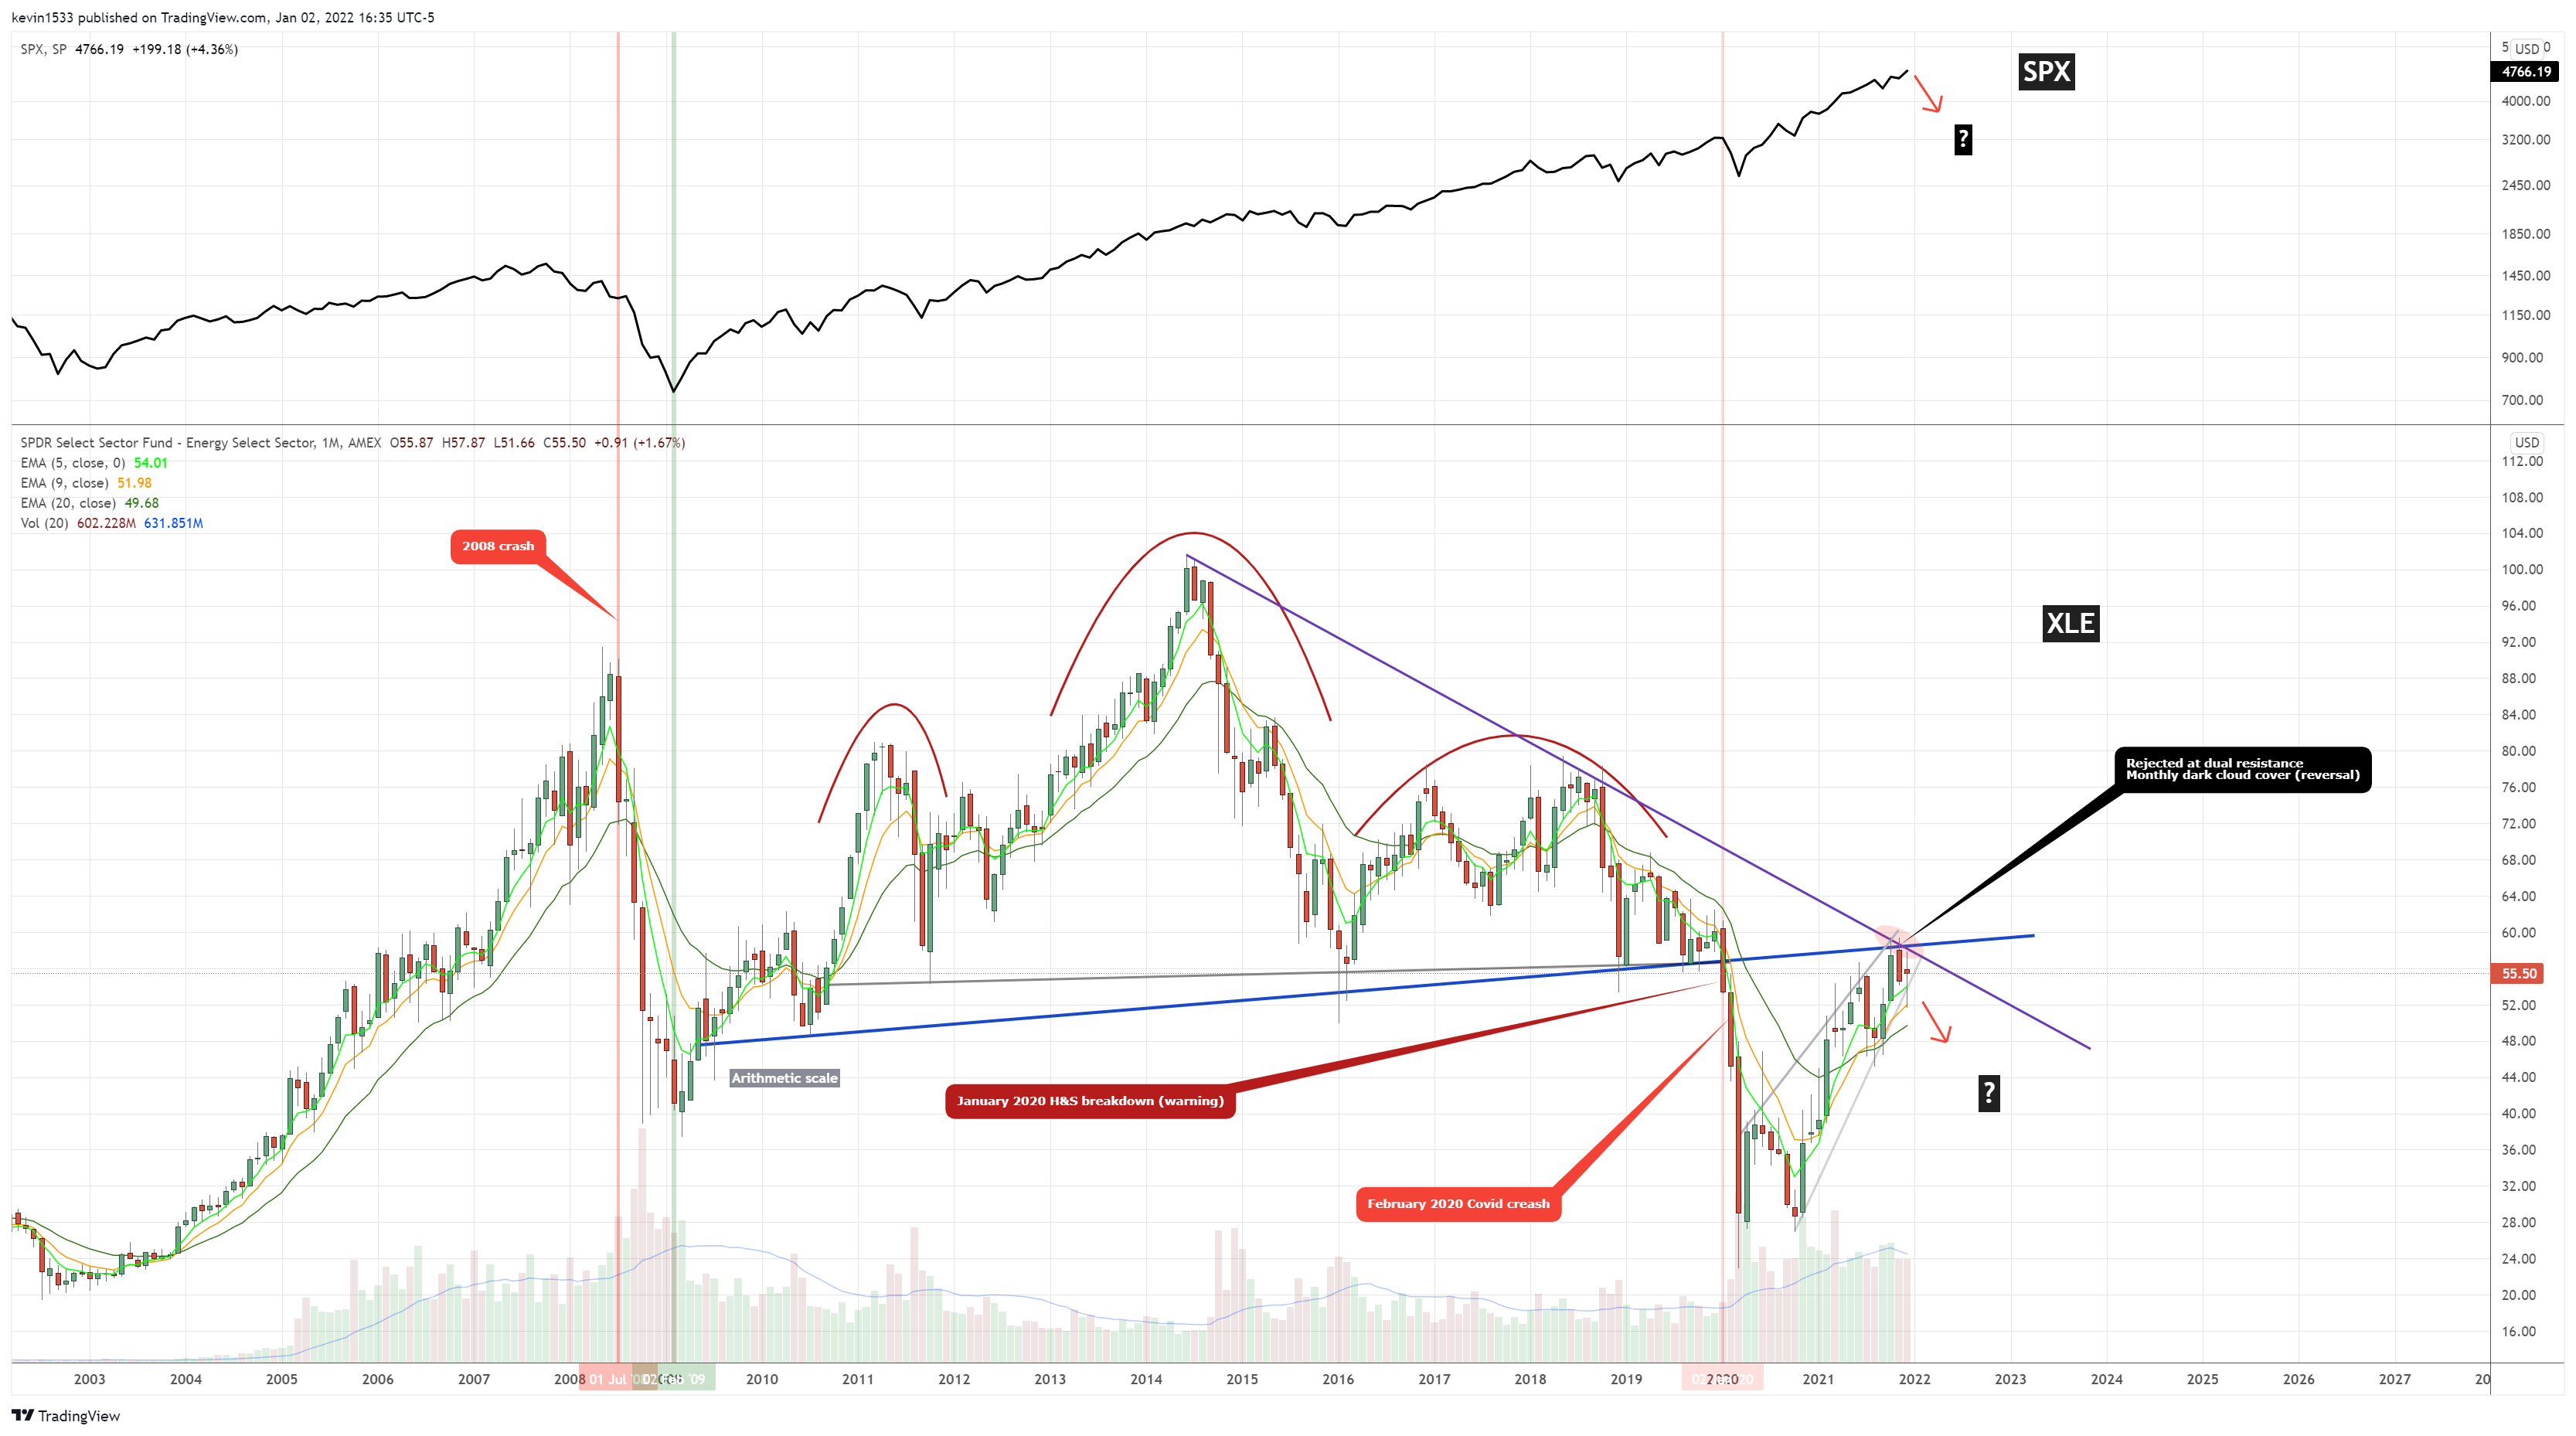
$XLE energy (monthly) coming off the monthly dark cloud cover reversal of major trend line resistances. Currently in ascending wedge consolidation. Bears in control
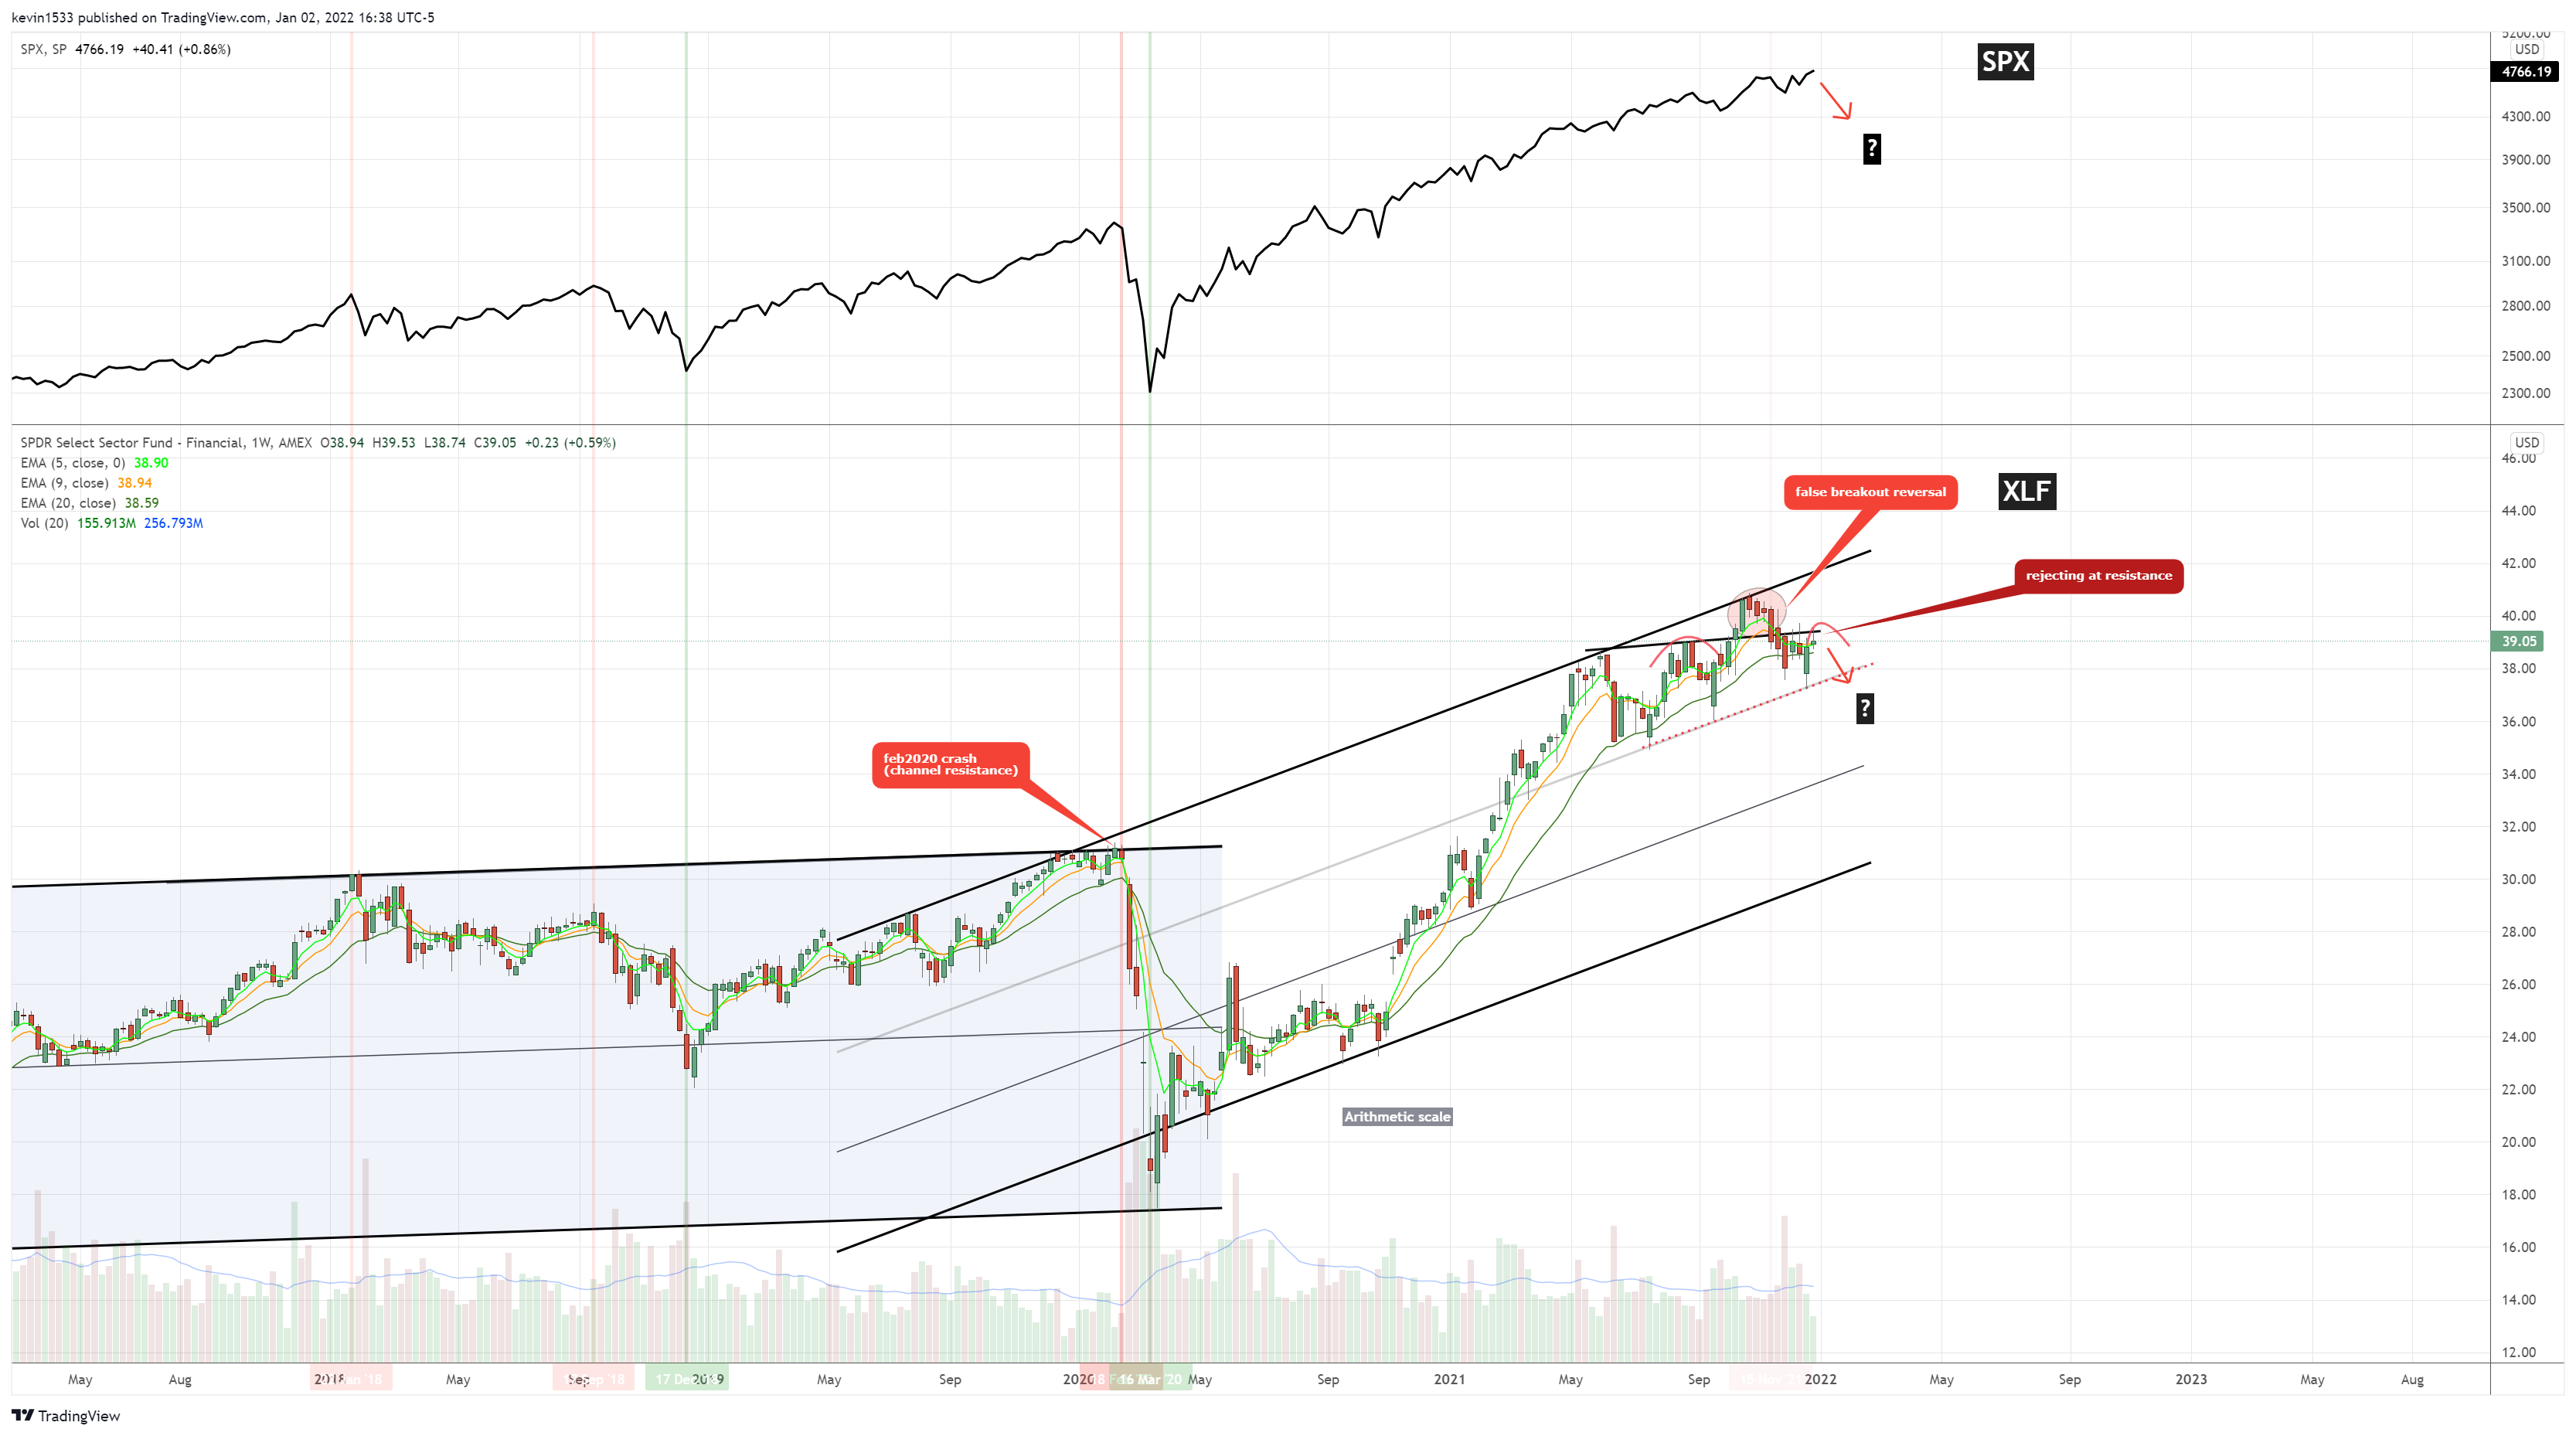
$XLF financial (weekly) 5/9/20ema converged. Remains vulnerable as it continues to reject at resistance following the false breakout reversal. Potential lower high and right shoulder of H&S
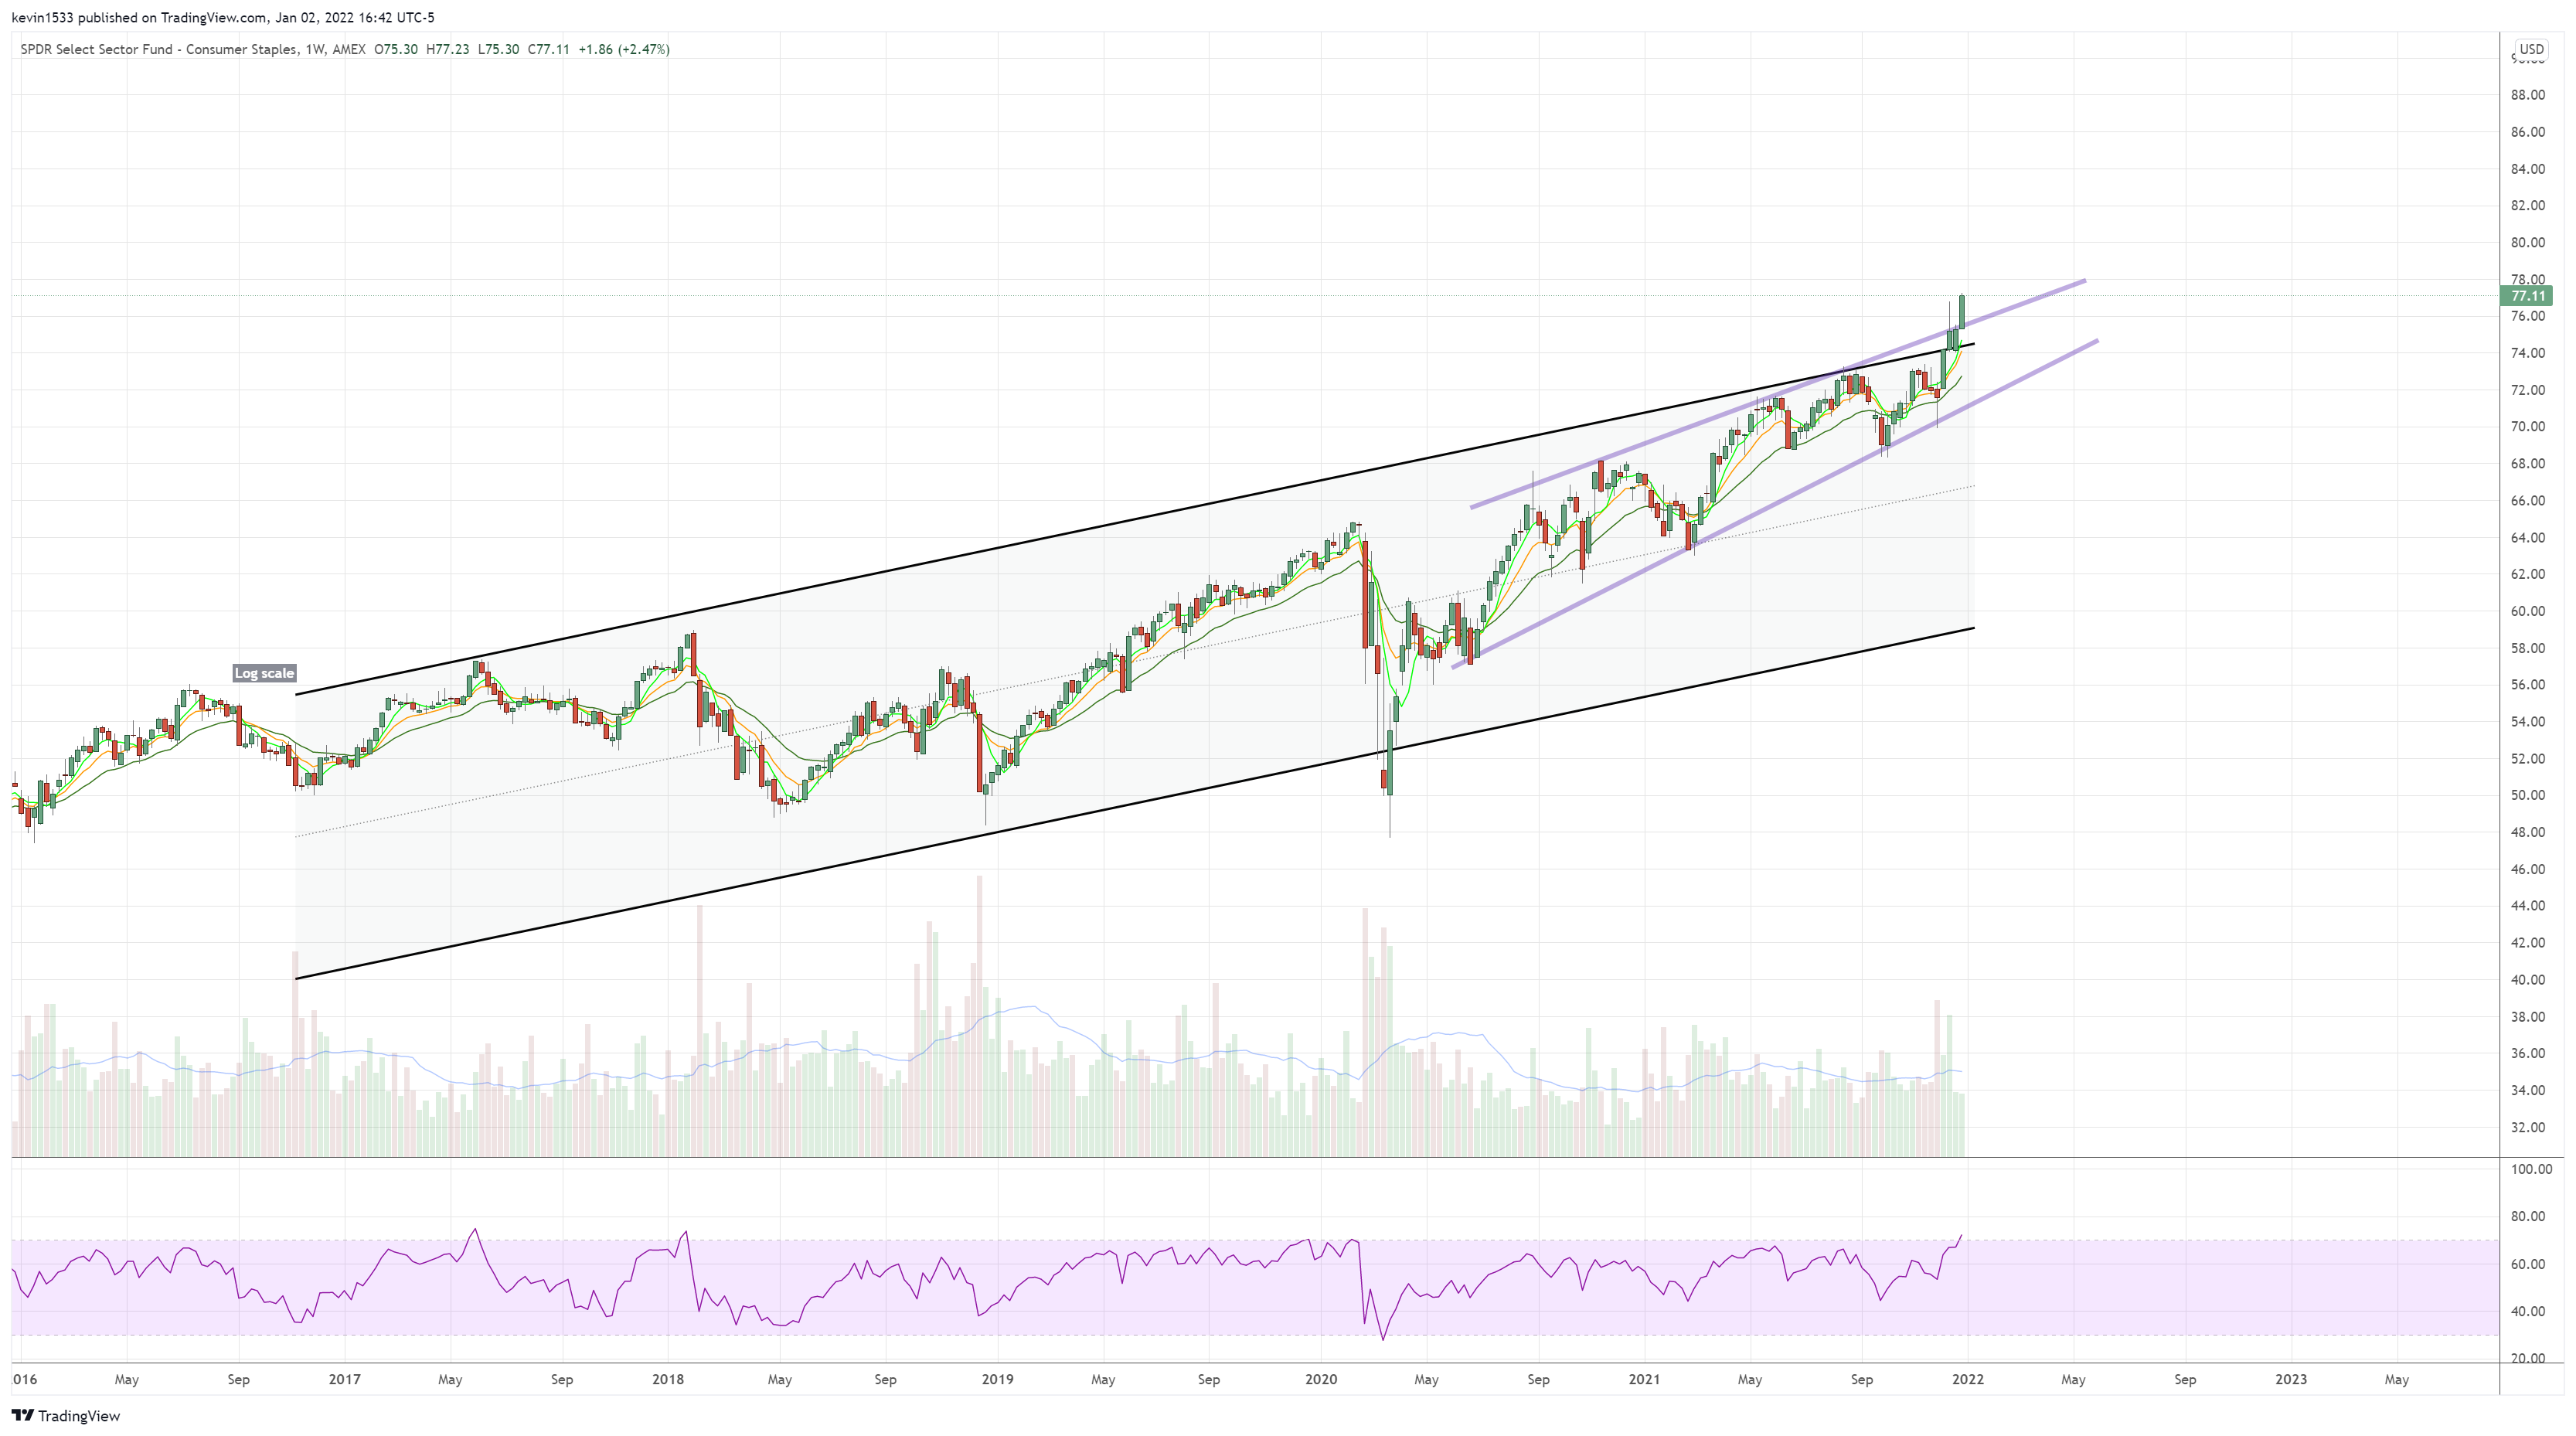
$XLP consumer staples (monthly) closed above channel and ascending wedge resistance. So far no bearish signal here.
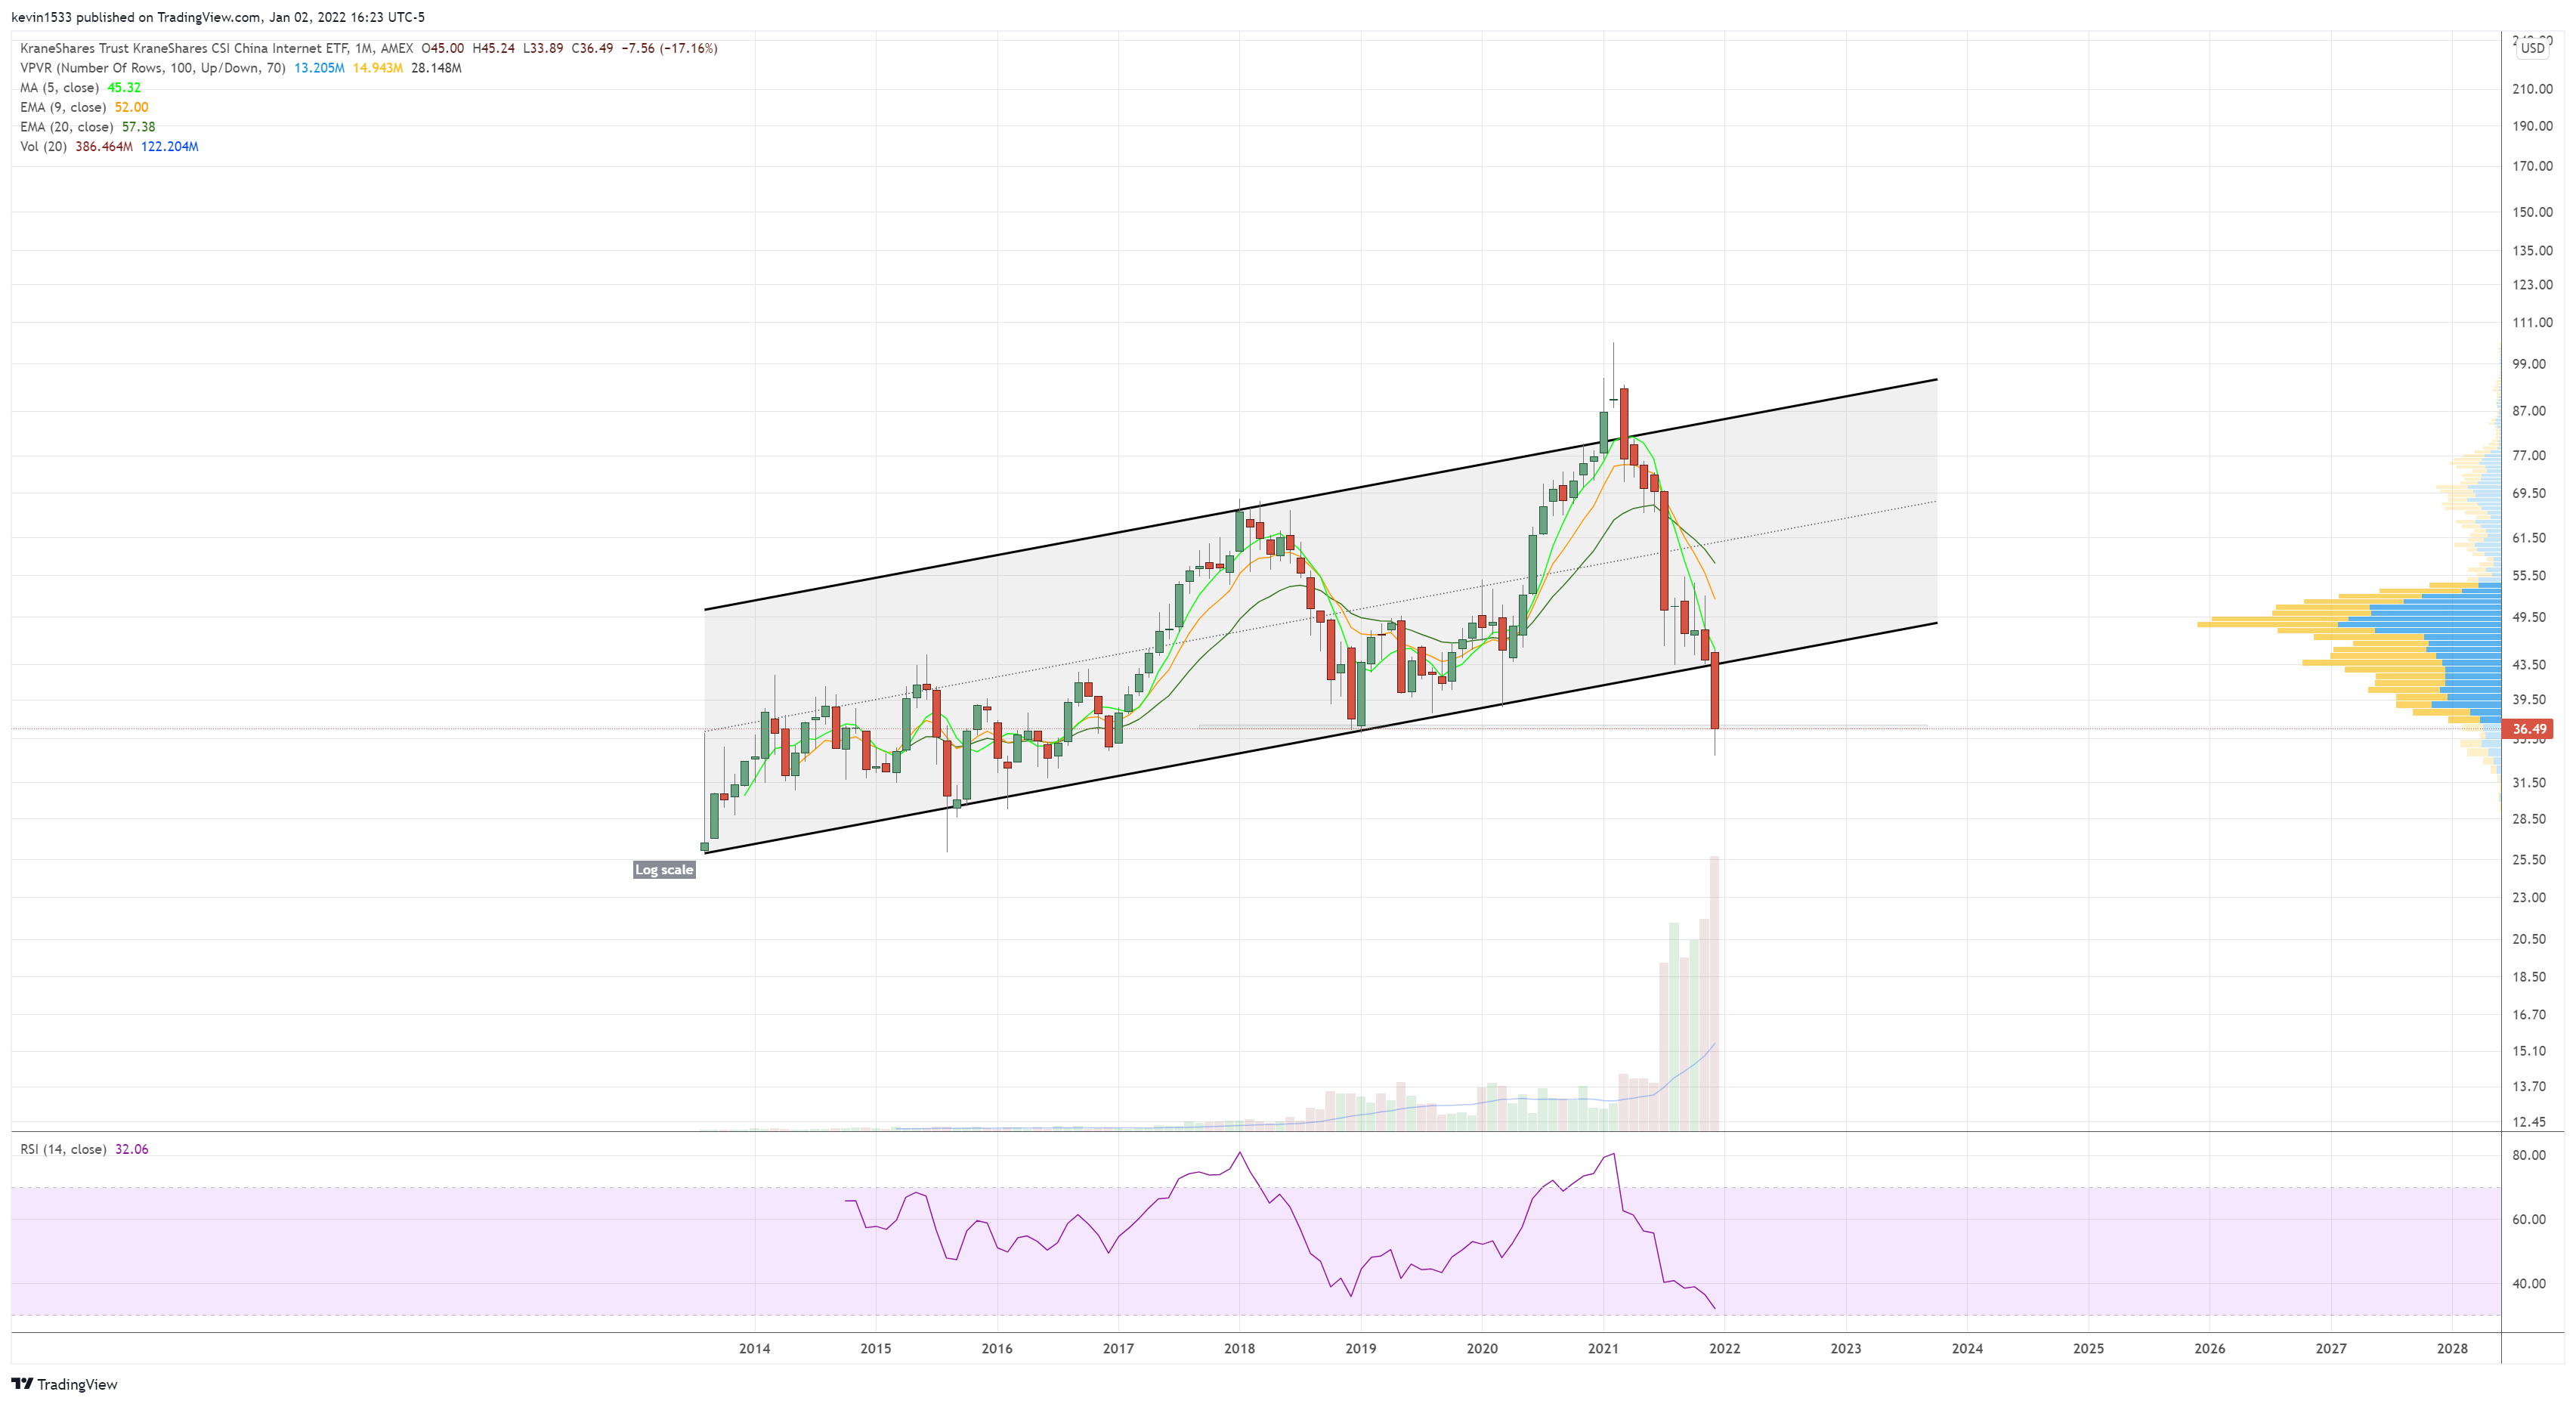
KWEB China internet ETF (monthly) closed below major trendline/channel support
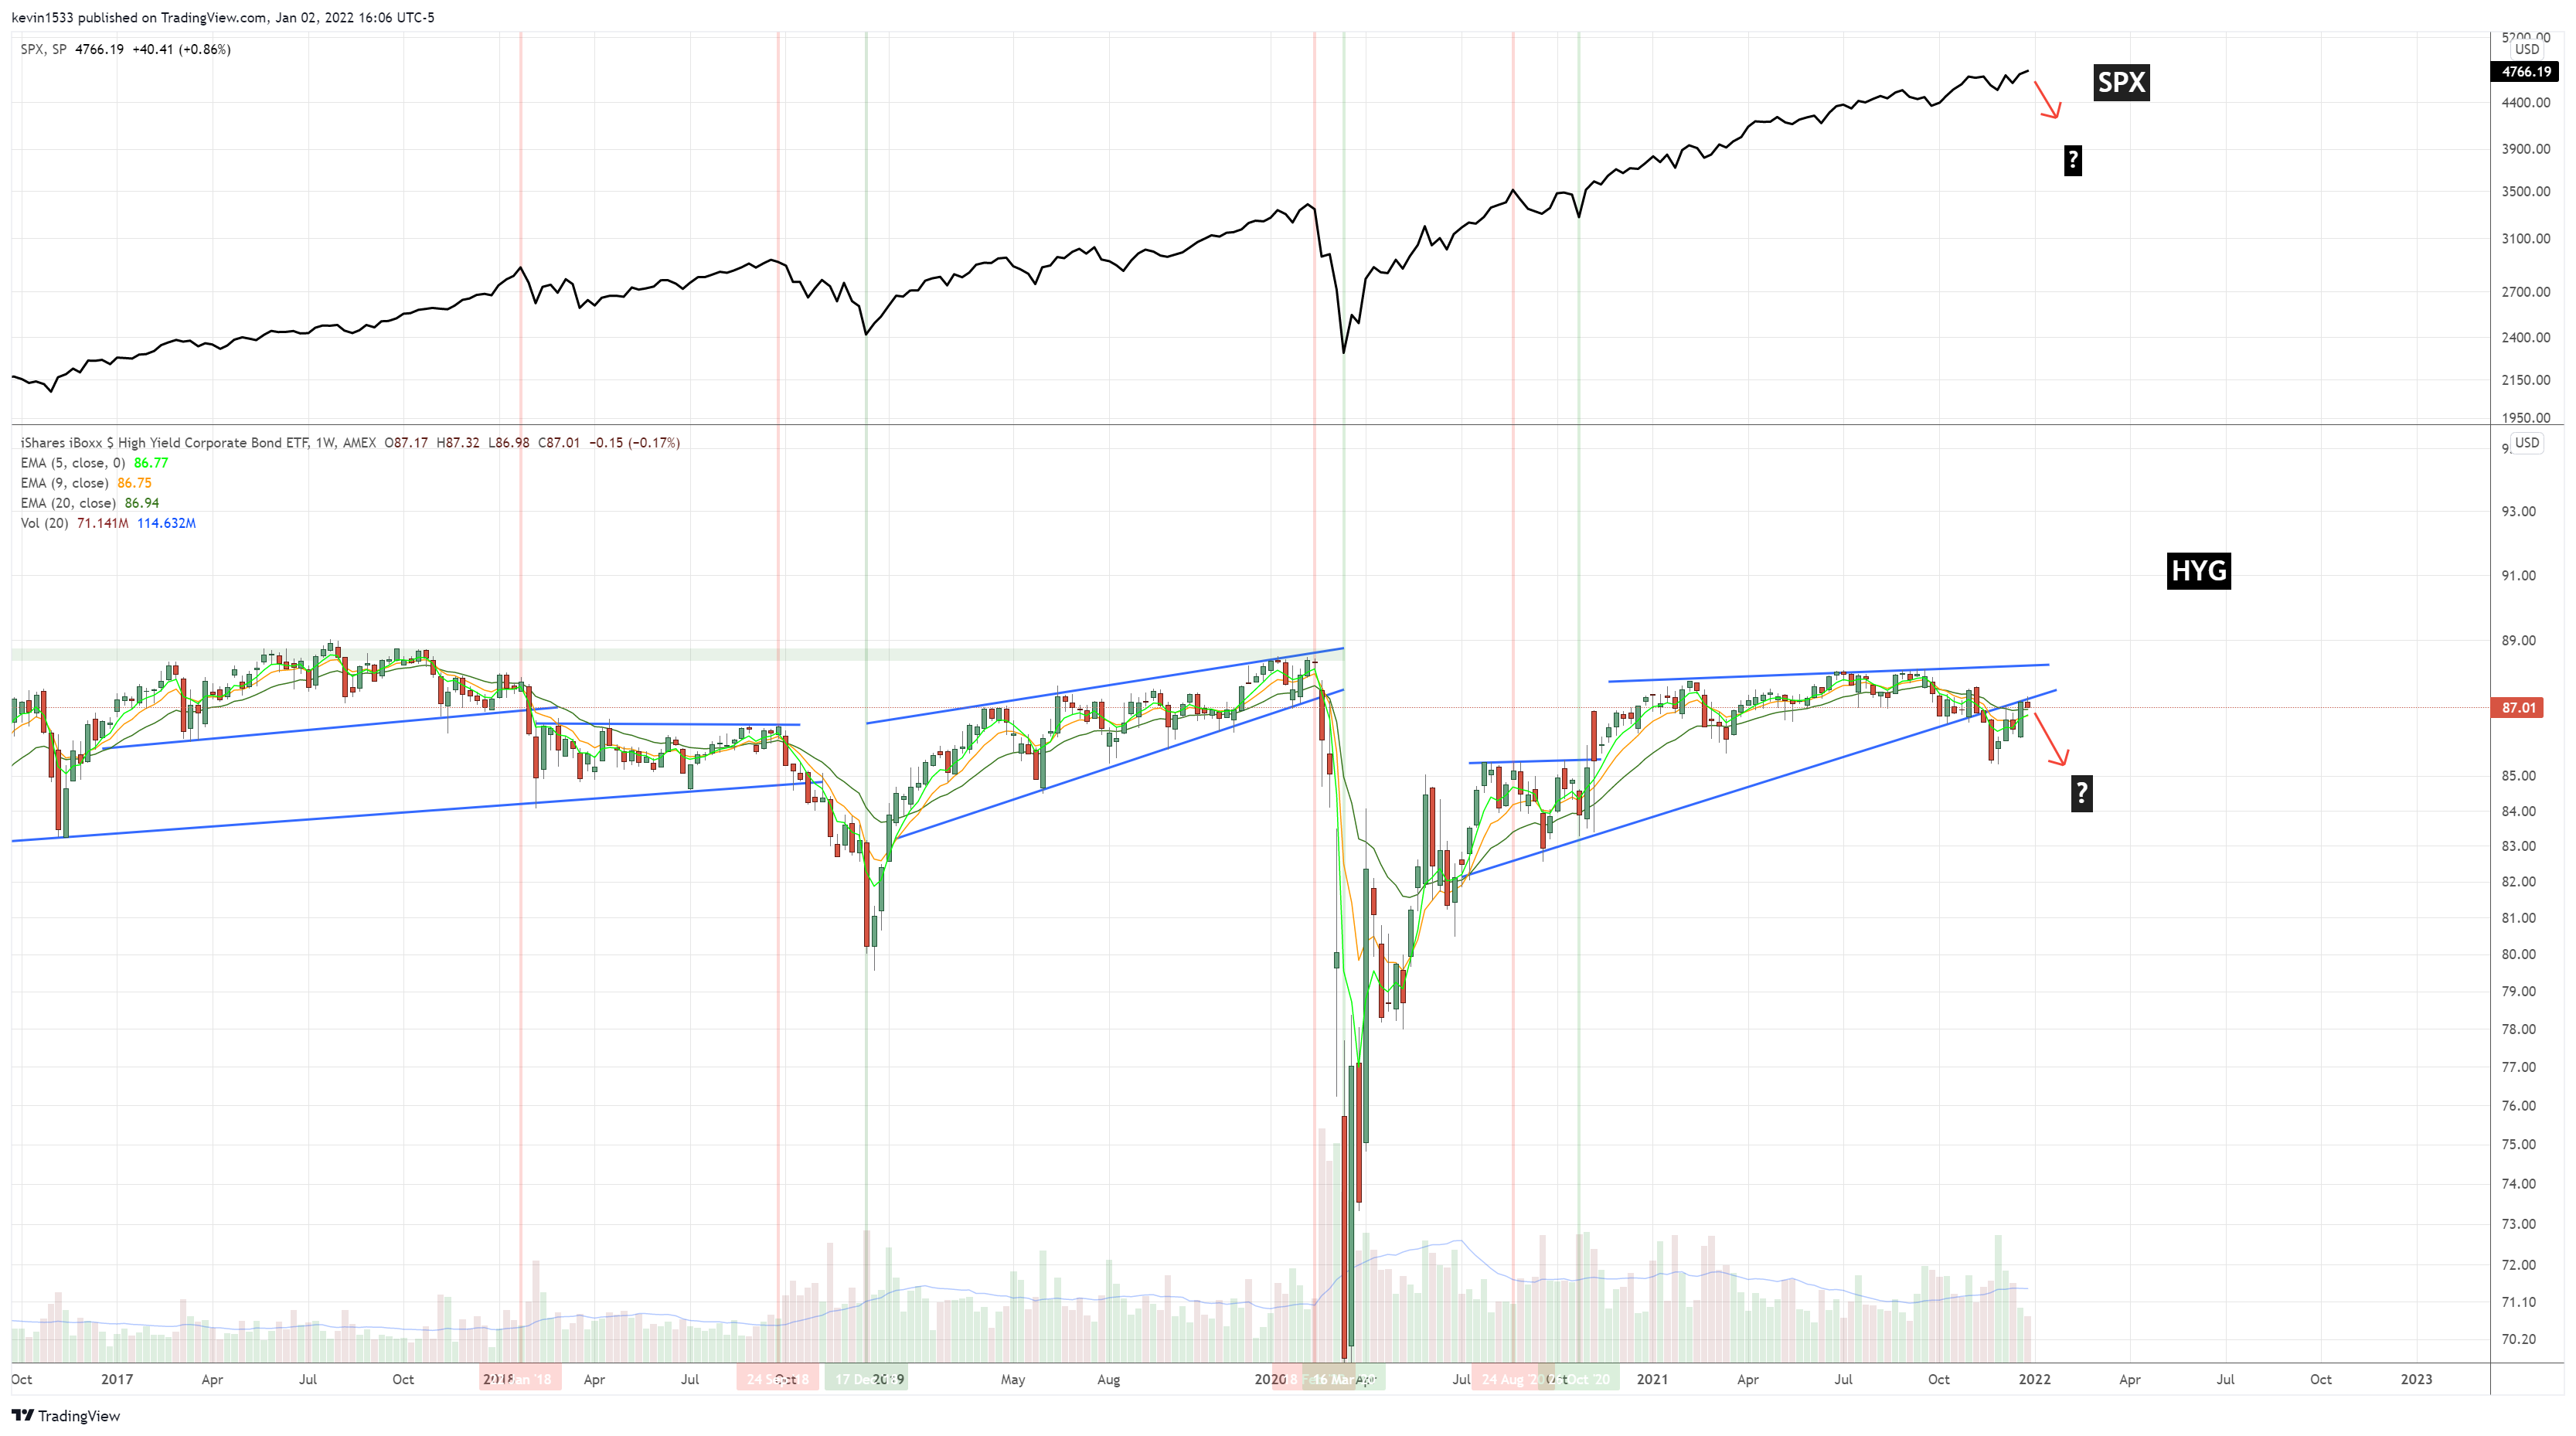
$HYG High yield corp bond(weekly) at trend line resistance with 5/9/20ema converged.
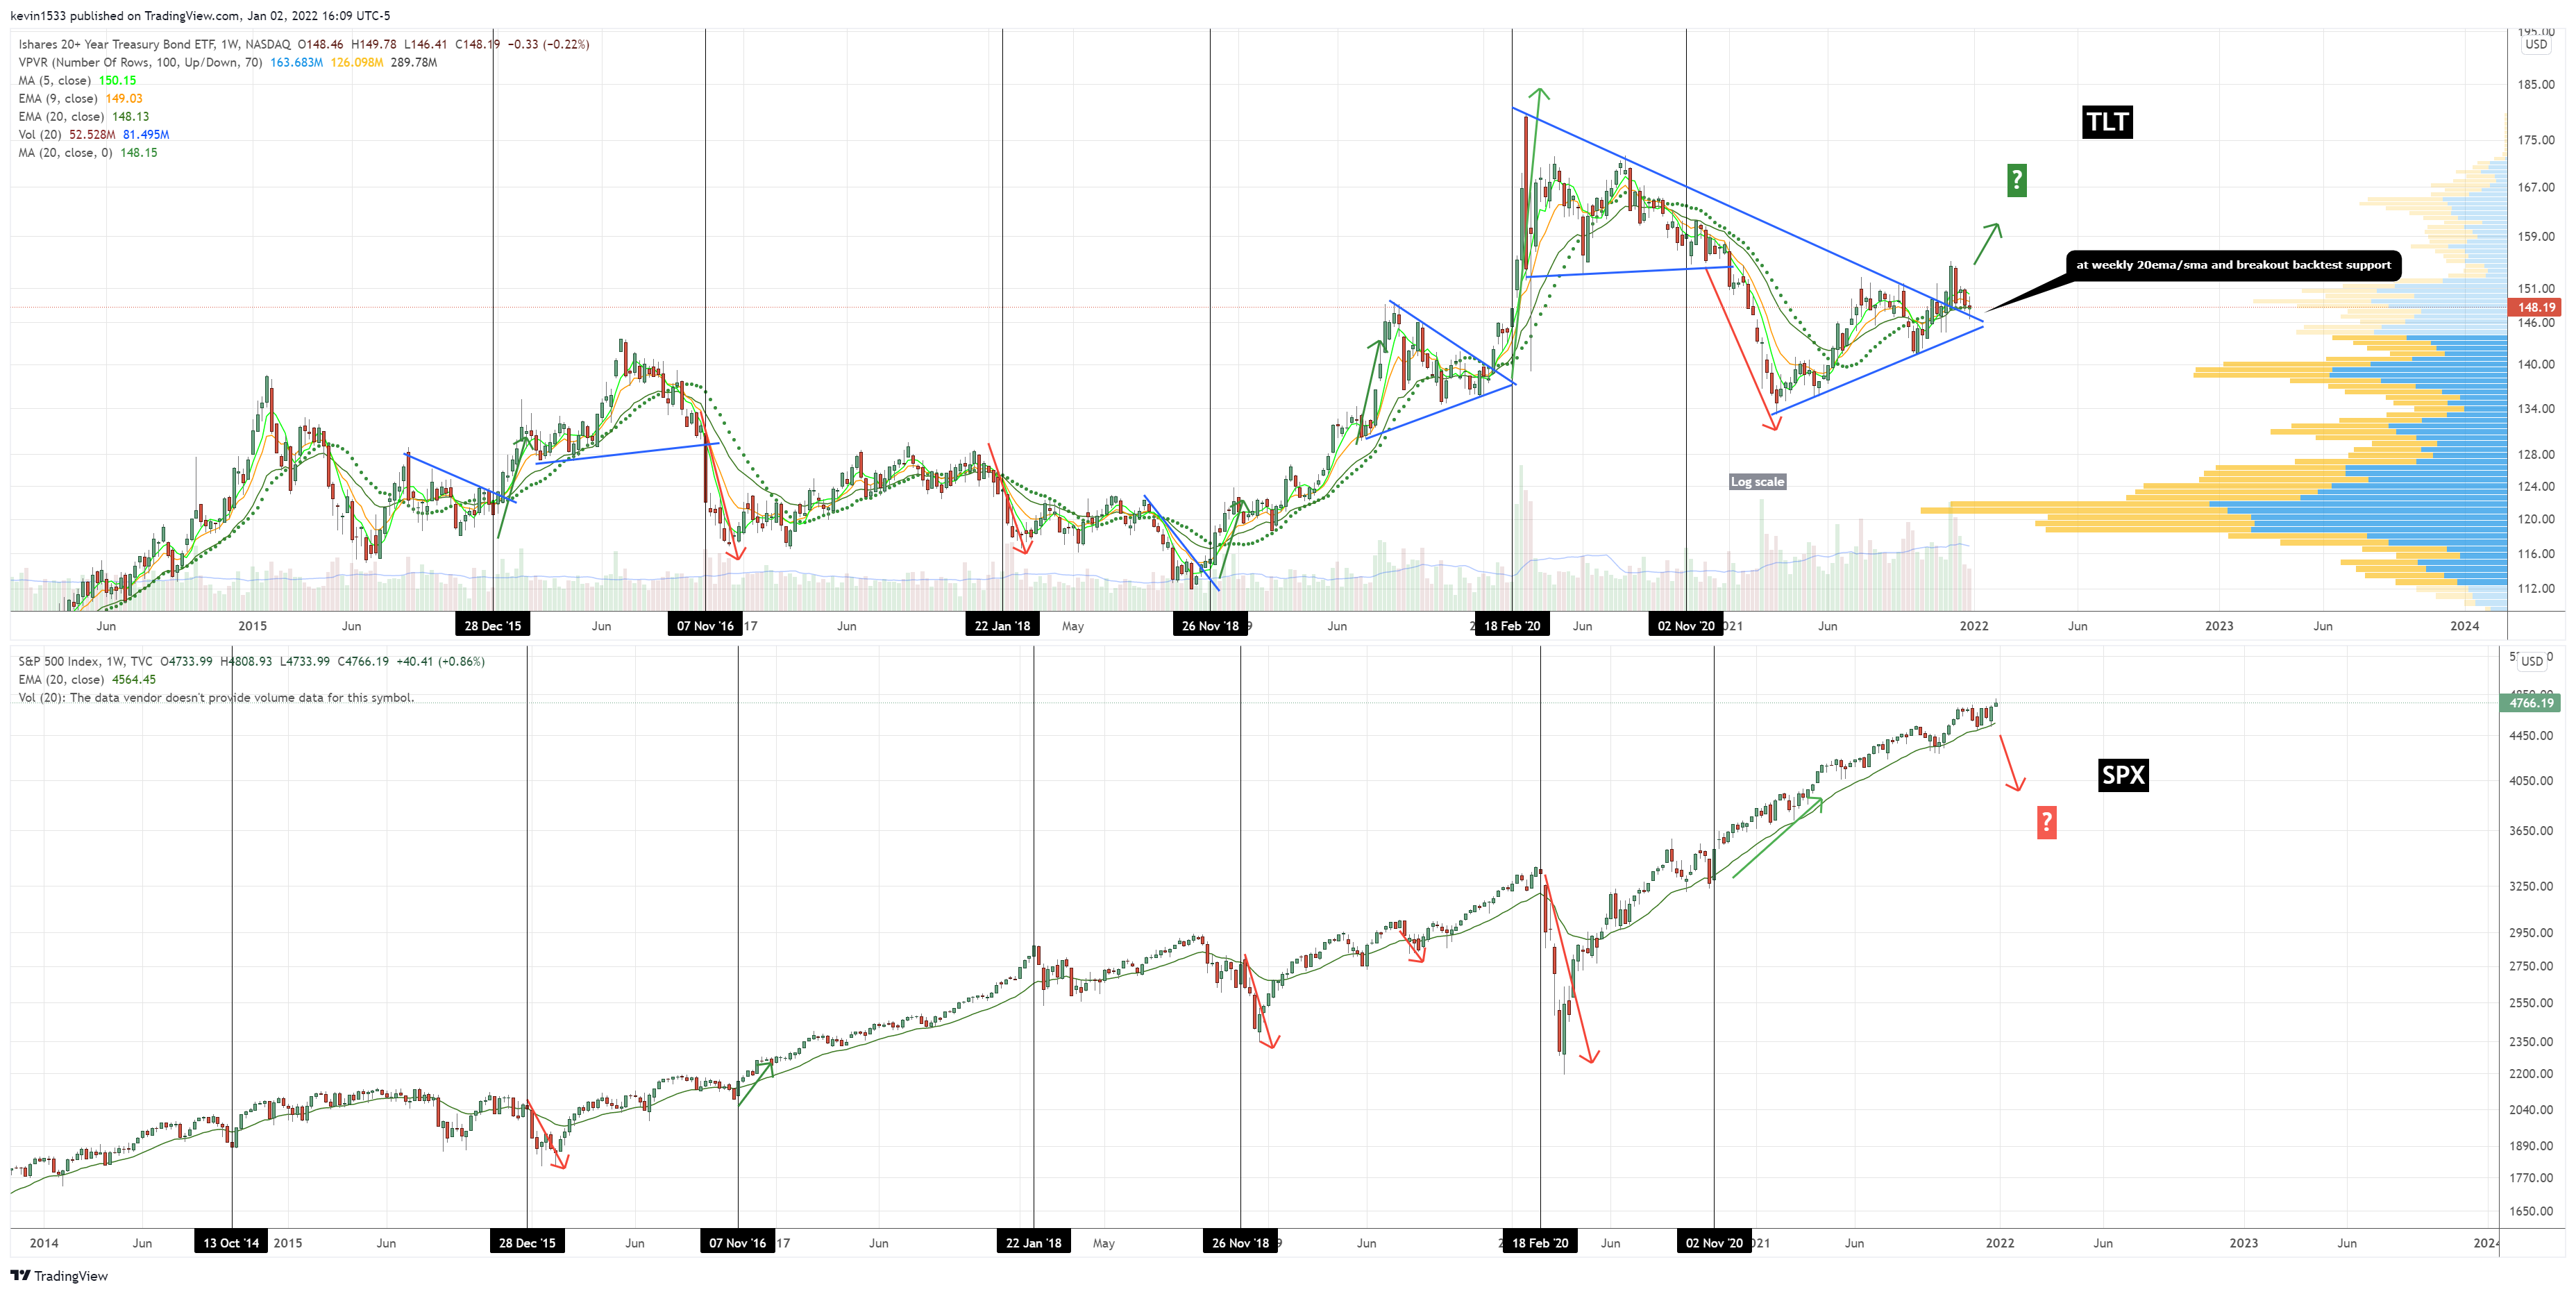
$TLT (weekly) Held breakout backtest support and weekly 20ema/sma support.
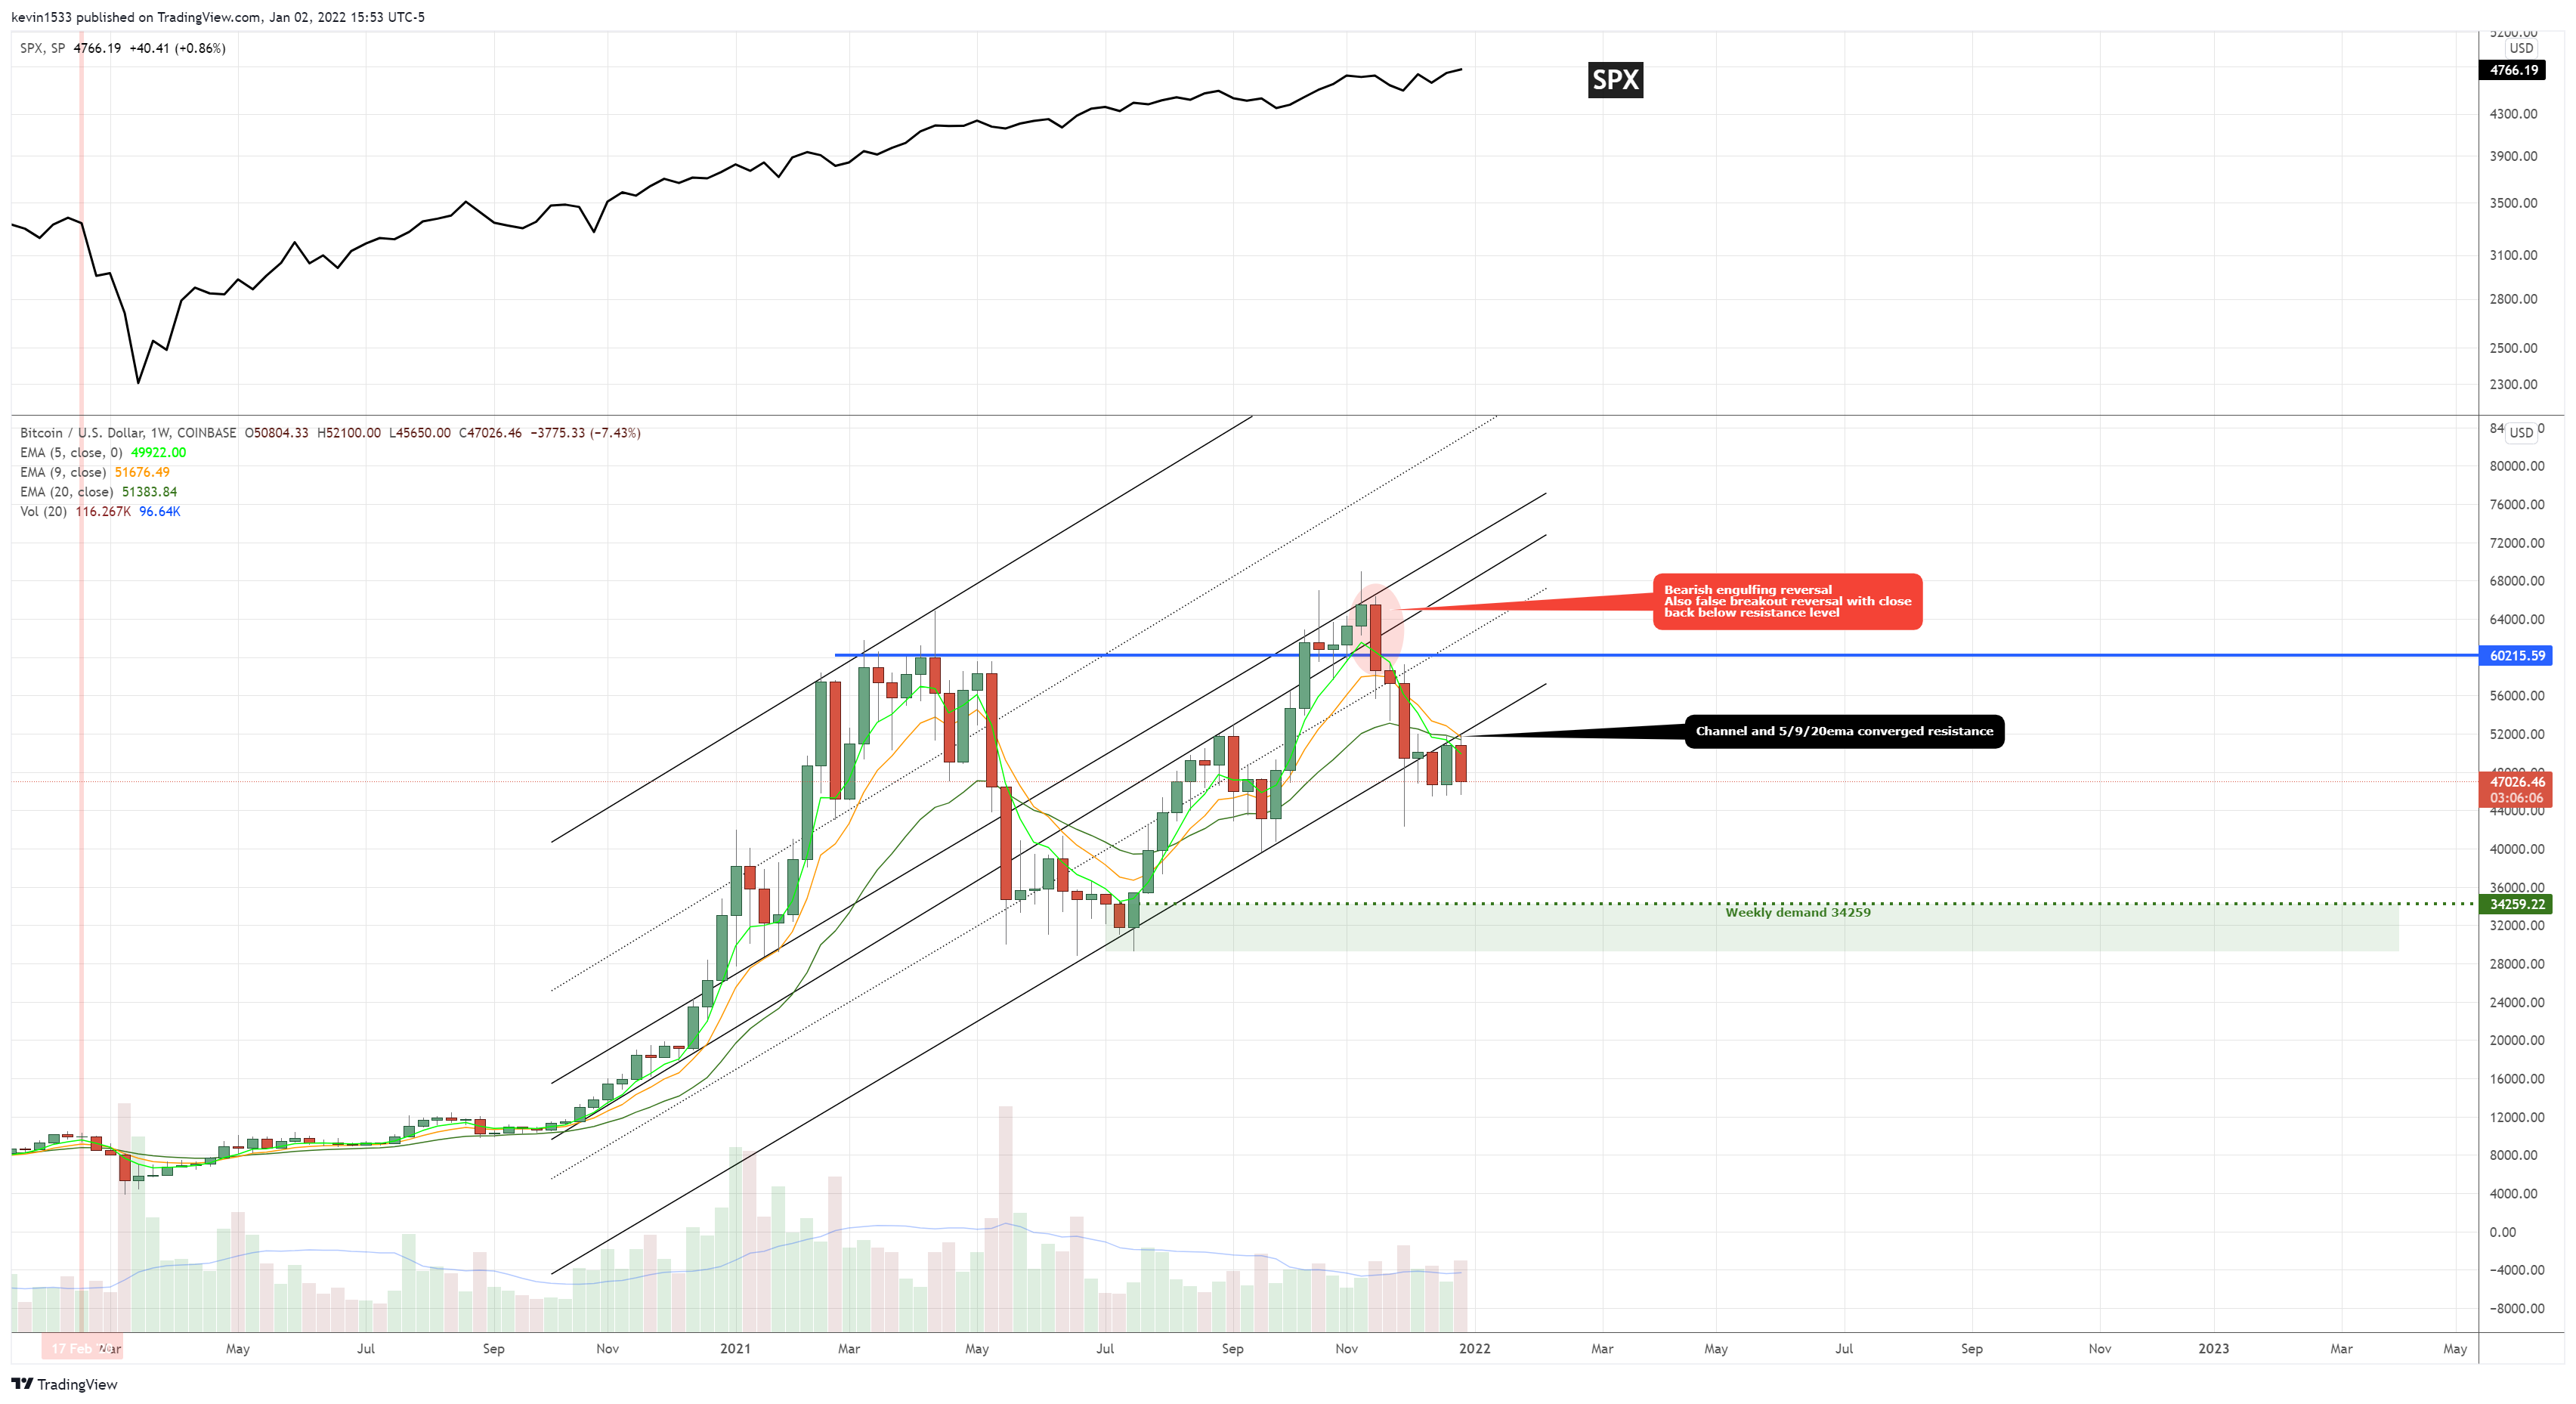
$BTC (weekly, arithmetic scale) below weekly 5/9/20ema and channel support. Could eventually head down to the strong demand level at 34259
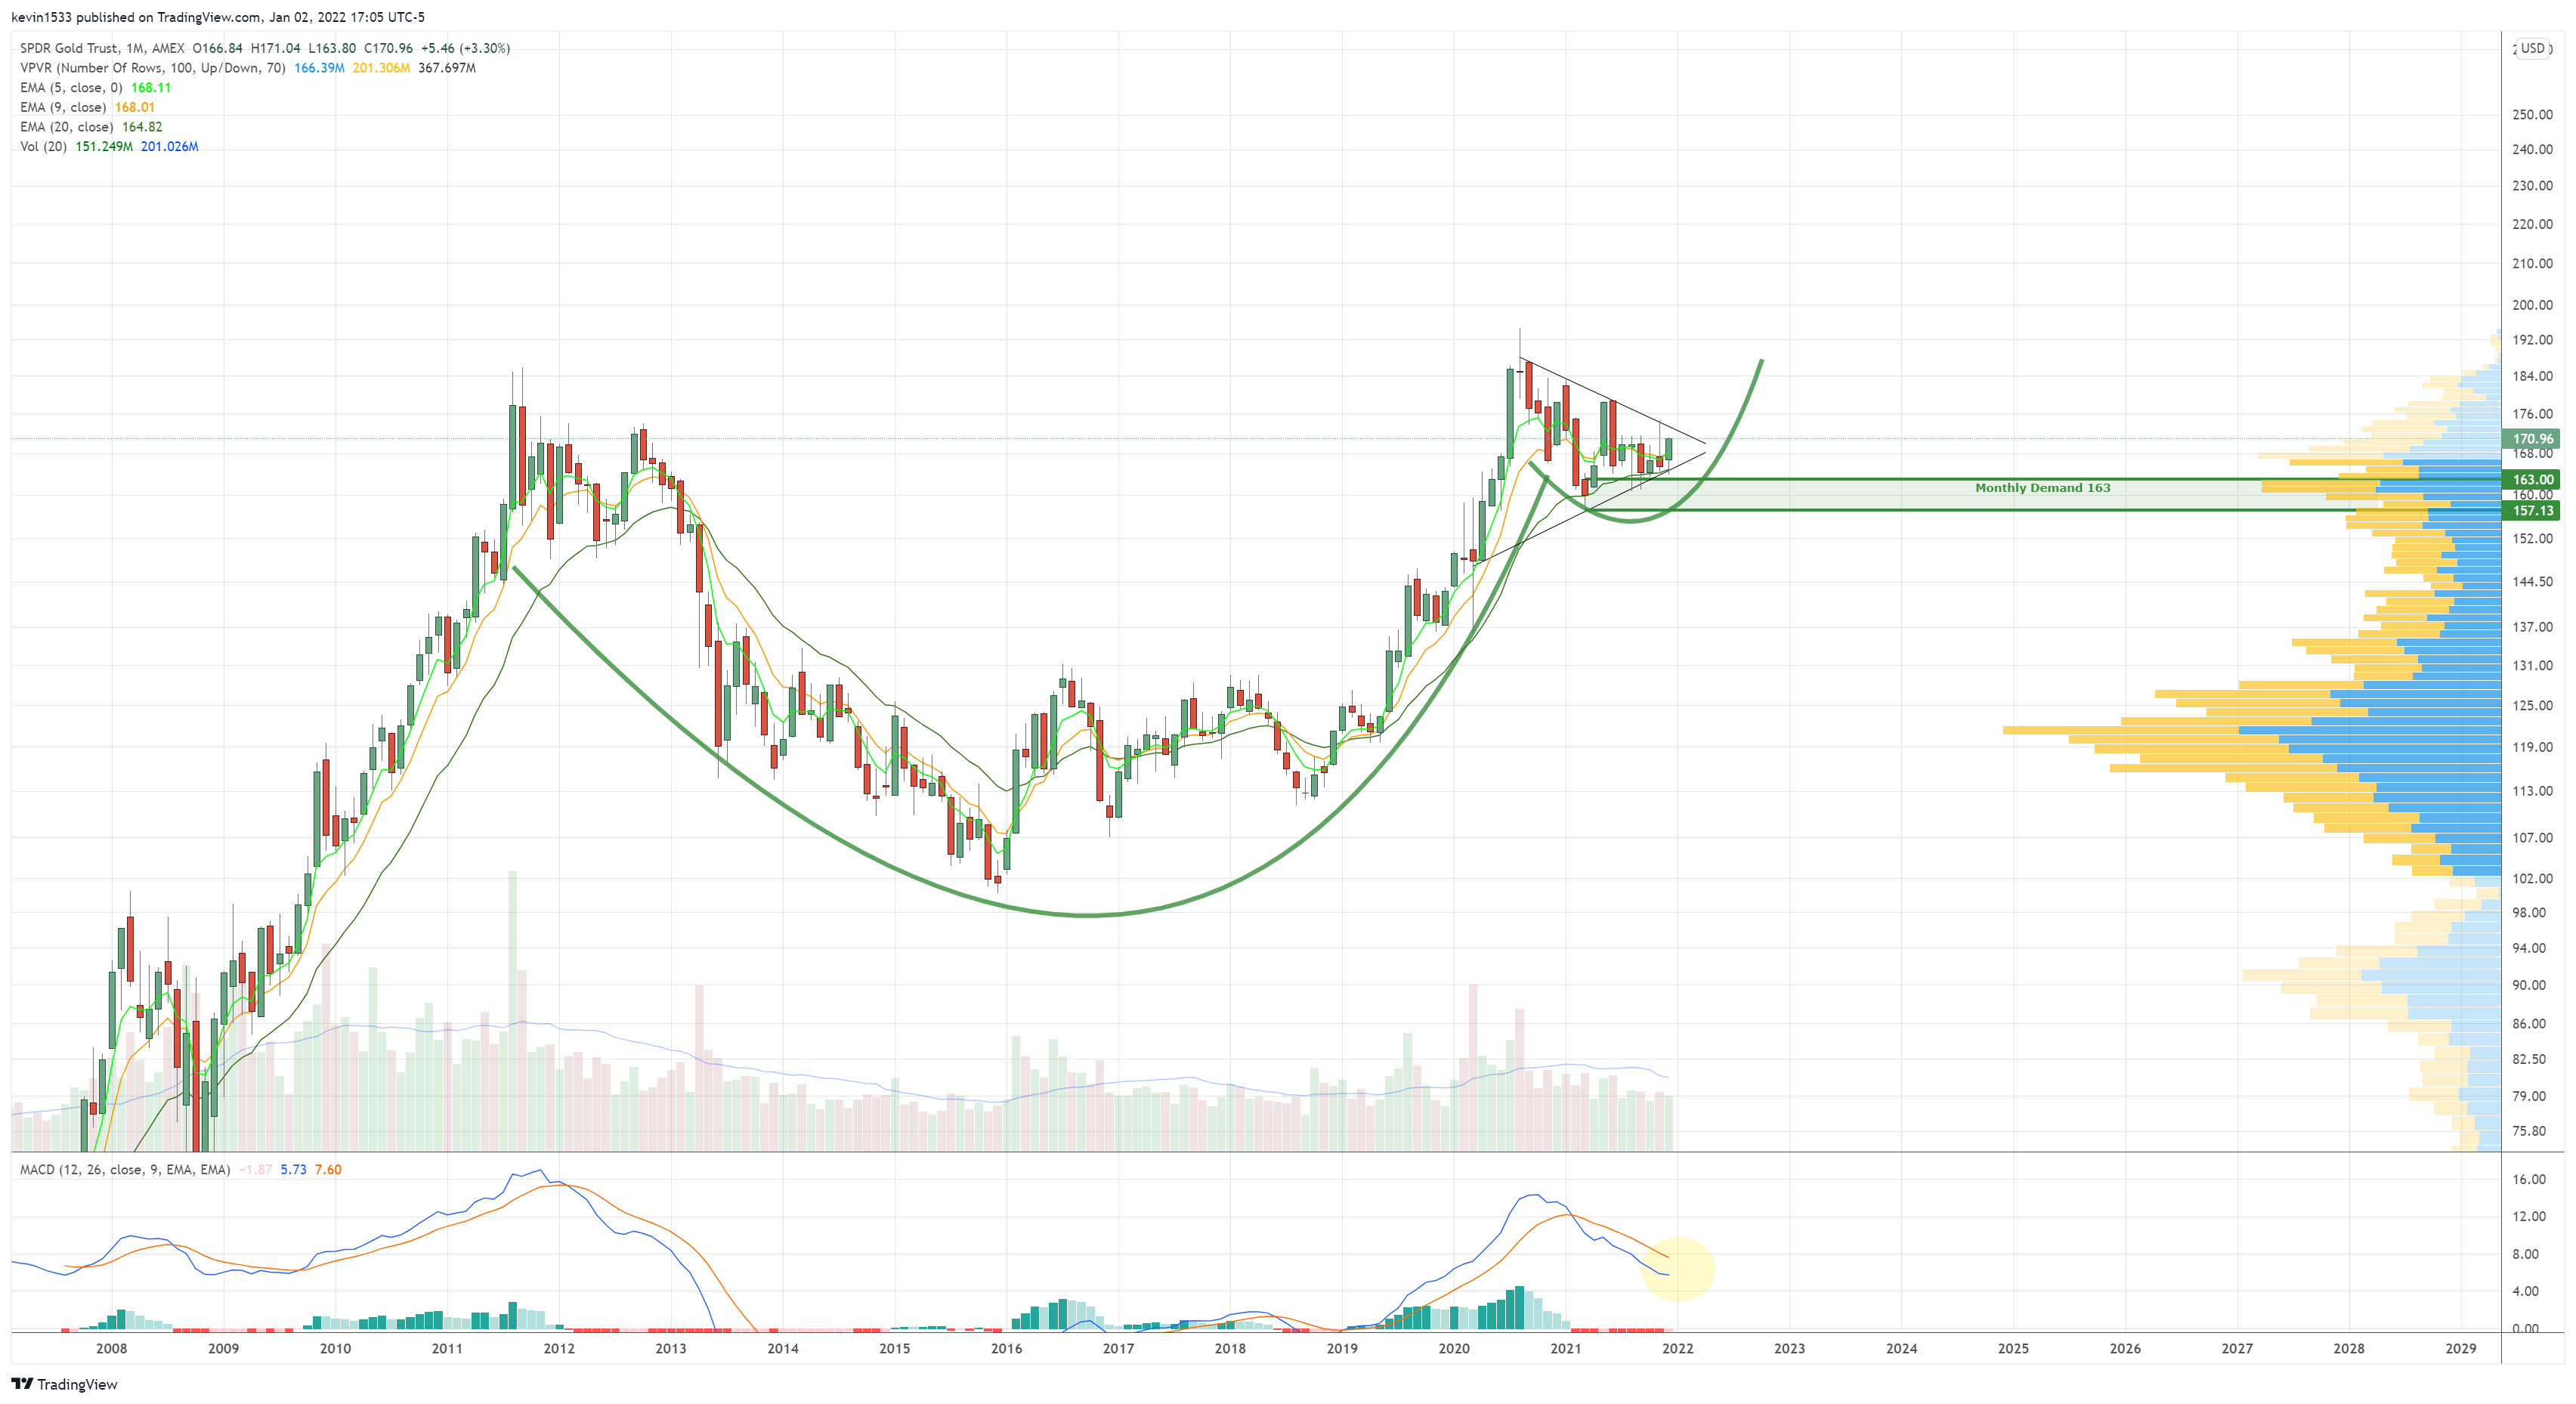
$GLD (monthly) with a strong close above 5/9/20ema following consolidation over monthly demand.

Let’s Look at the leader
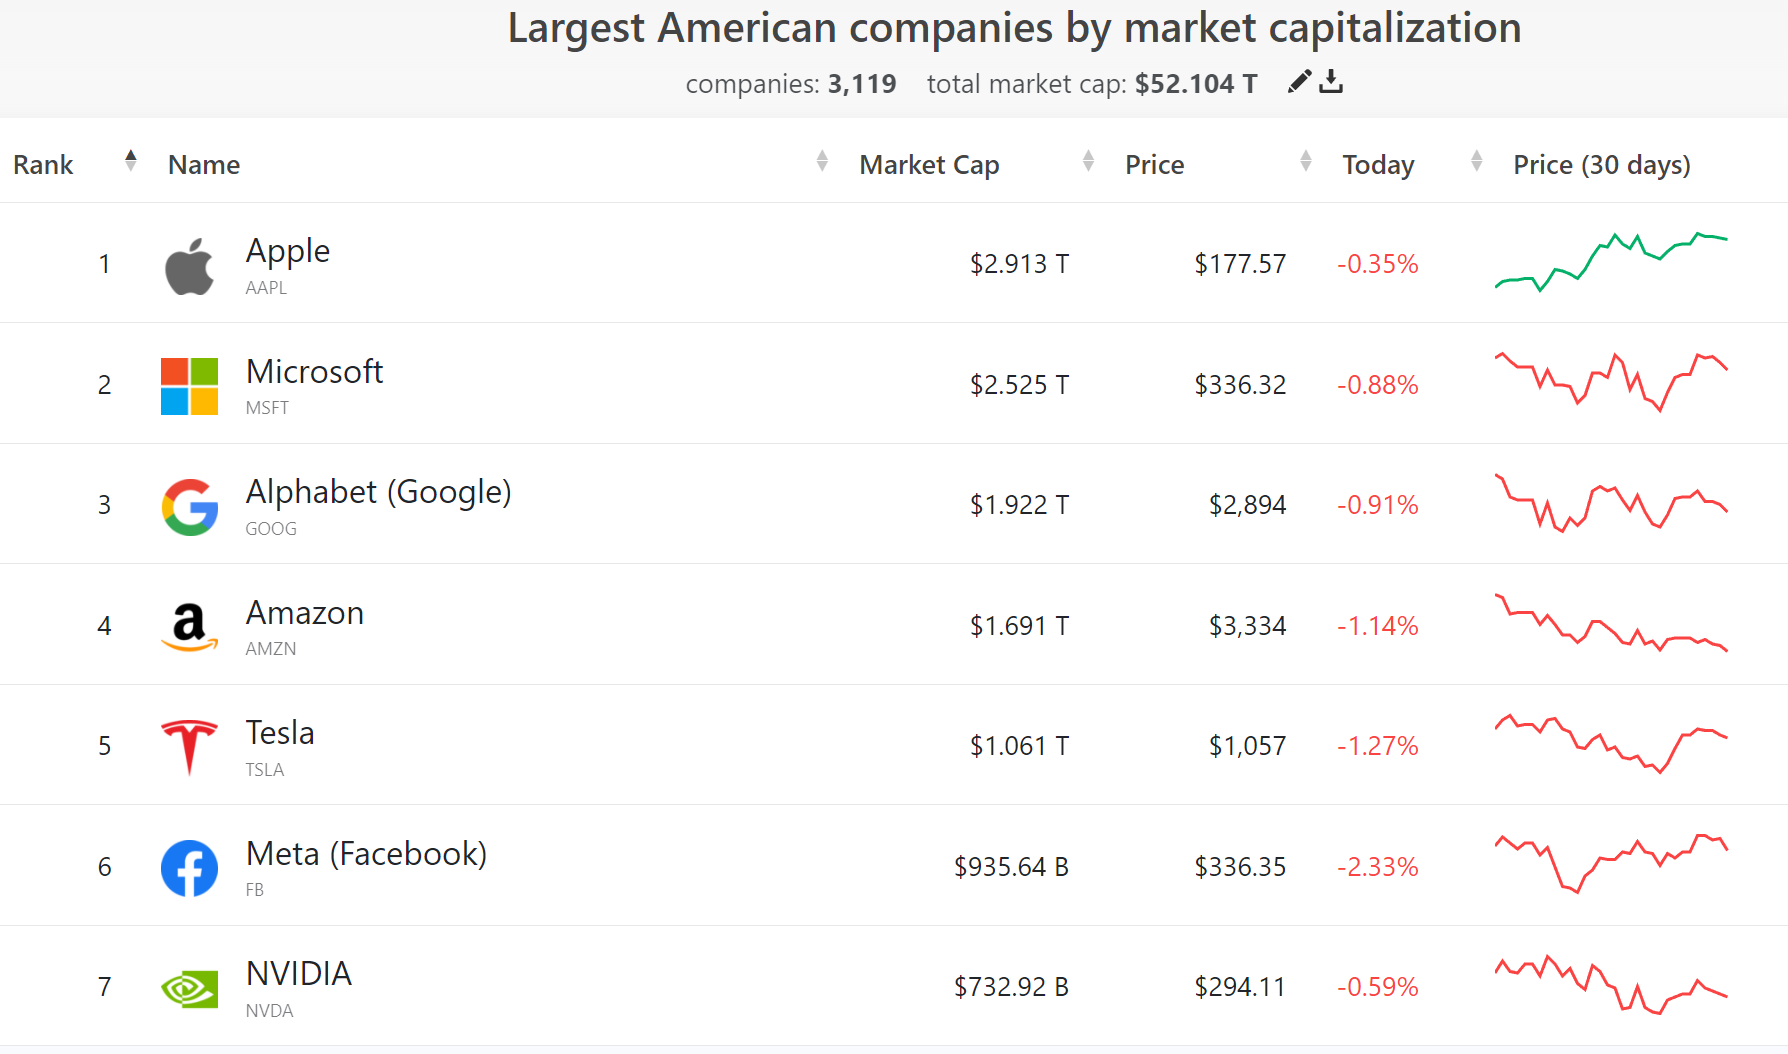
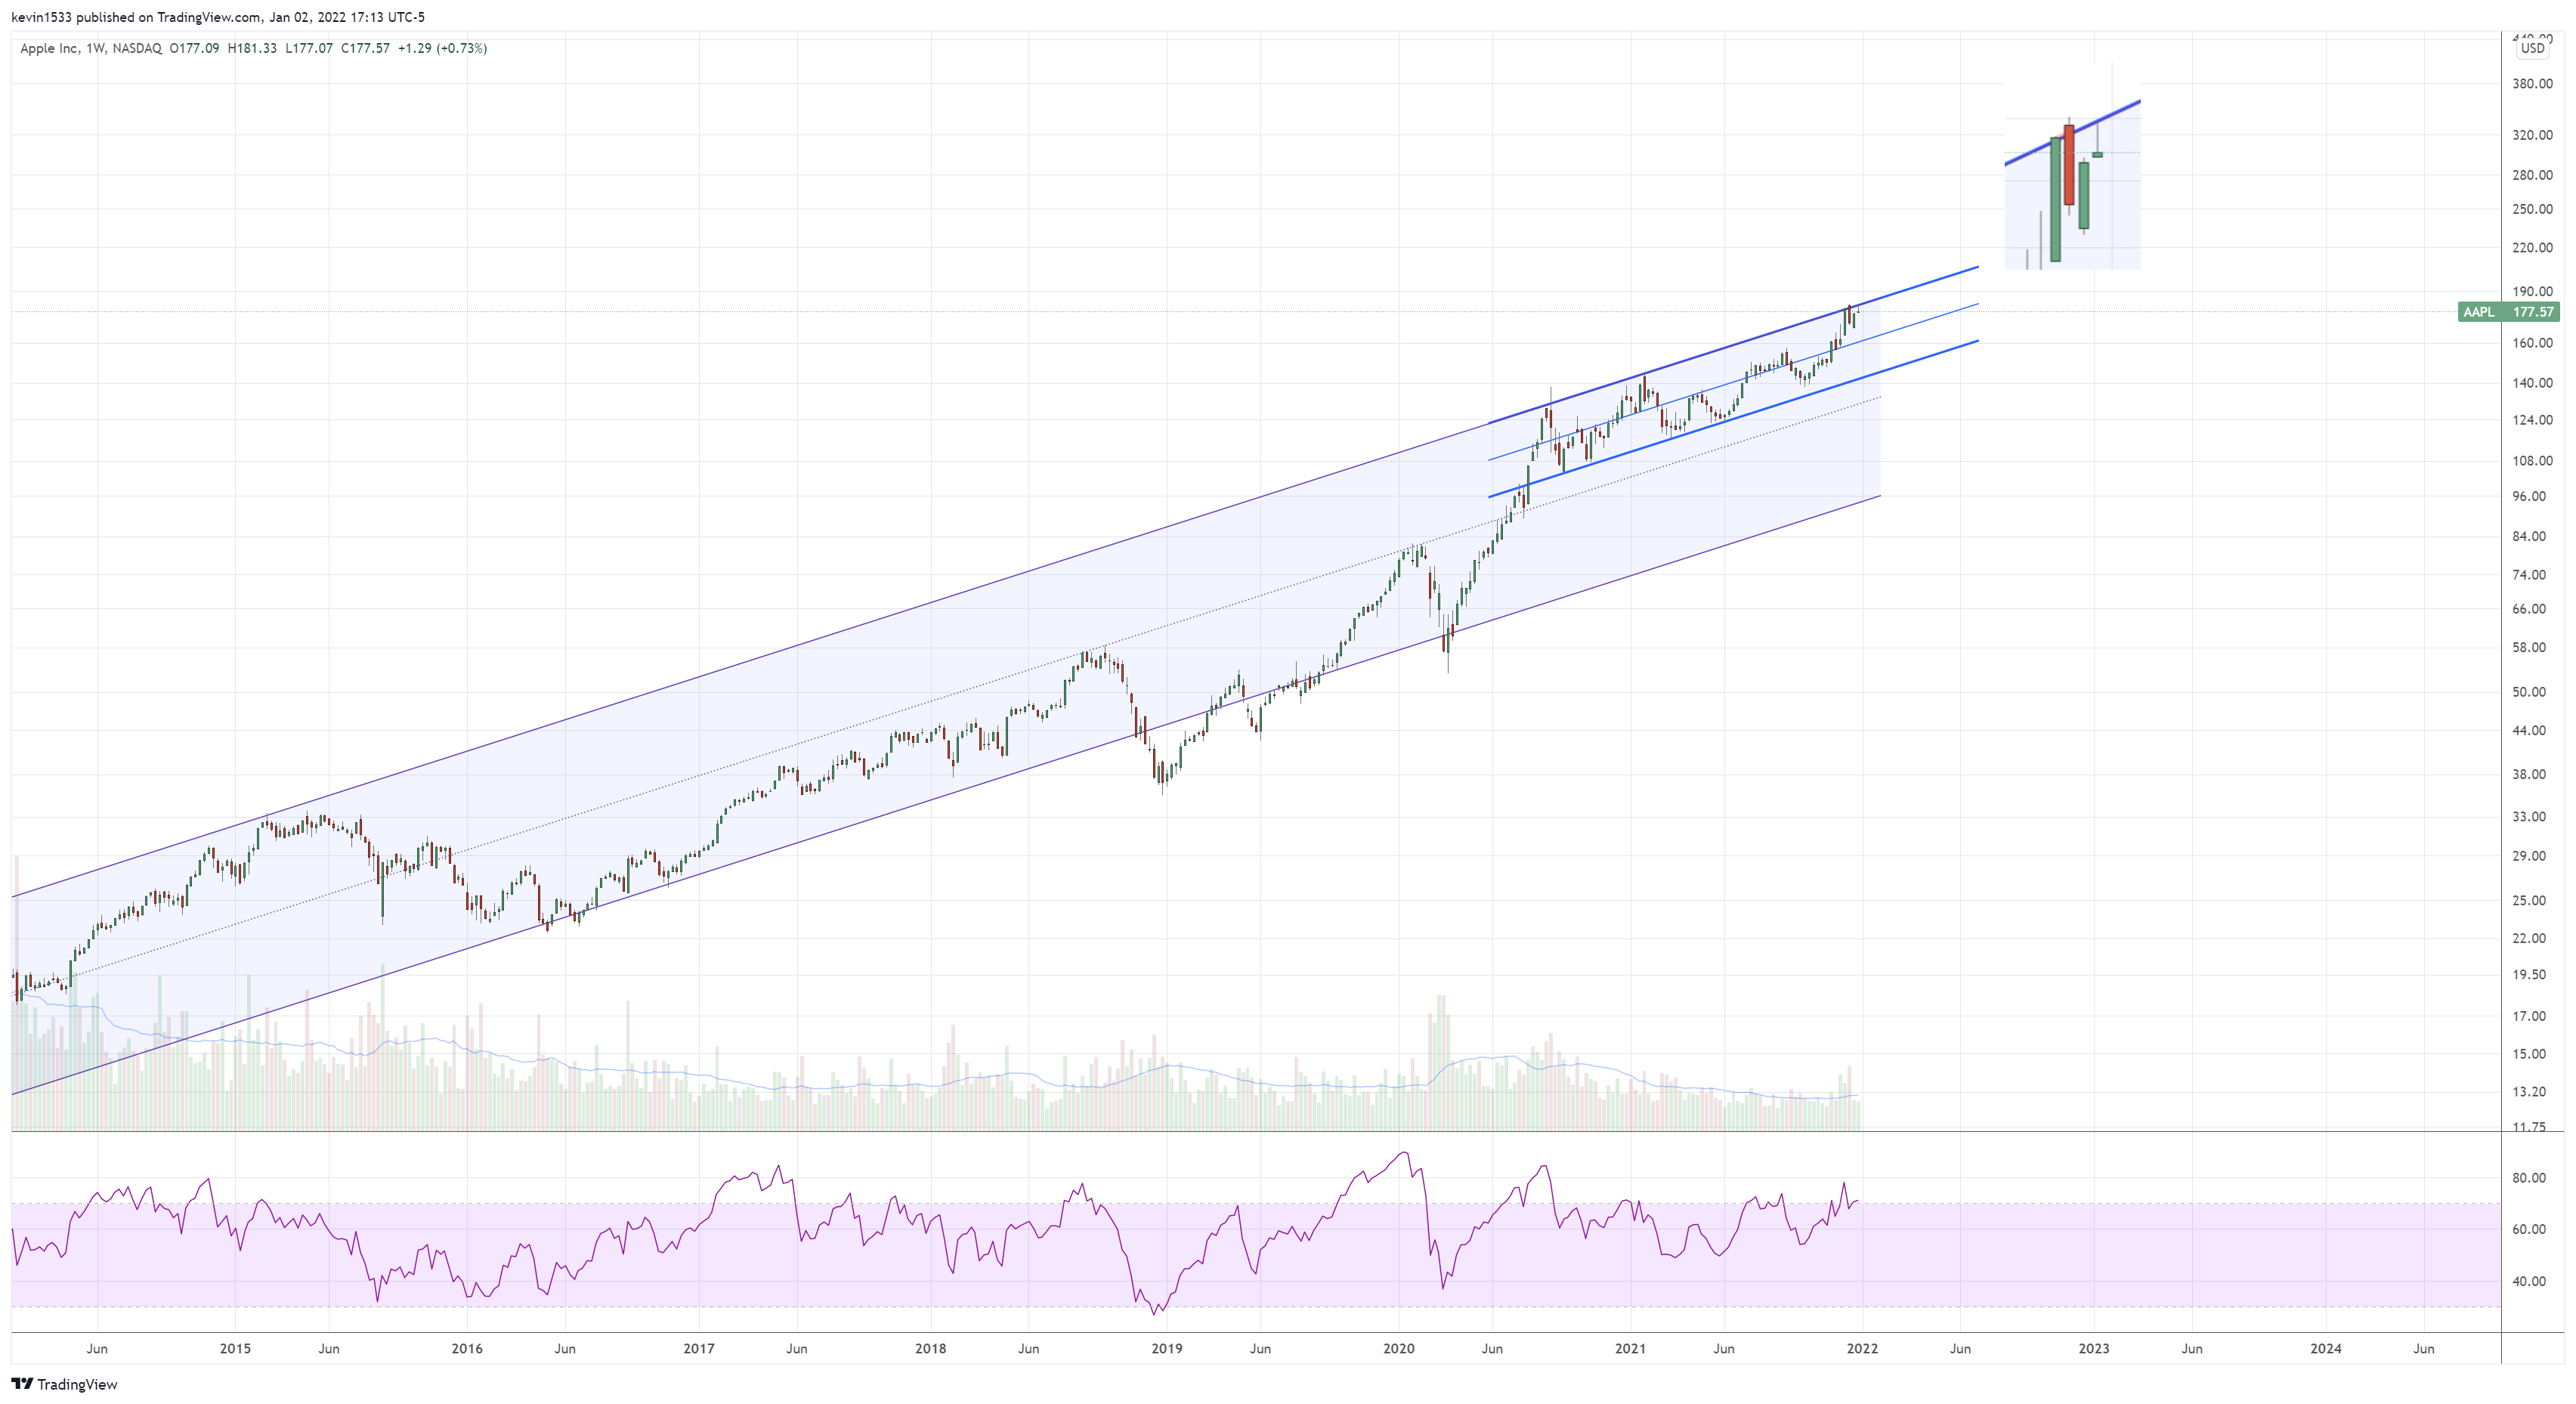
$AAPL (weekly) Dark cloud cover off major channel resistance and then the green candle this week followed by shooting star rejection off channel resistance. Until we get a weekly close above the red candle to negate the reversal, bears are in control.
$MSFT (monthly) November monthly candle was a gravestone doji at ATHs, rejecting at the 9 year channel top. December monthly candle was a spinning top(indecision, and potential reversal signal as well. Negative RSI divergence in play.

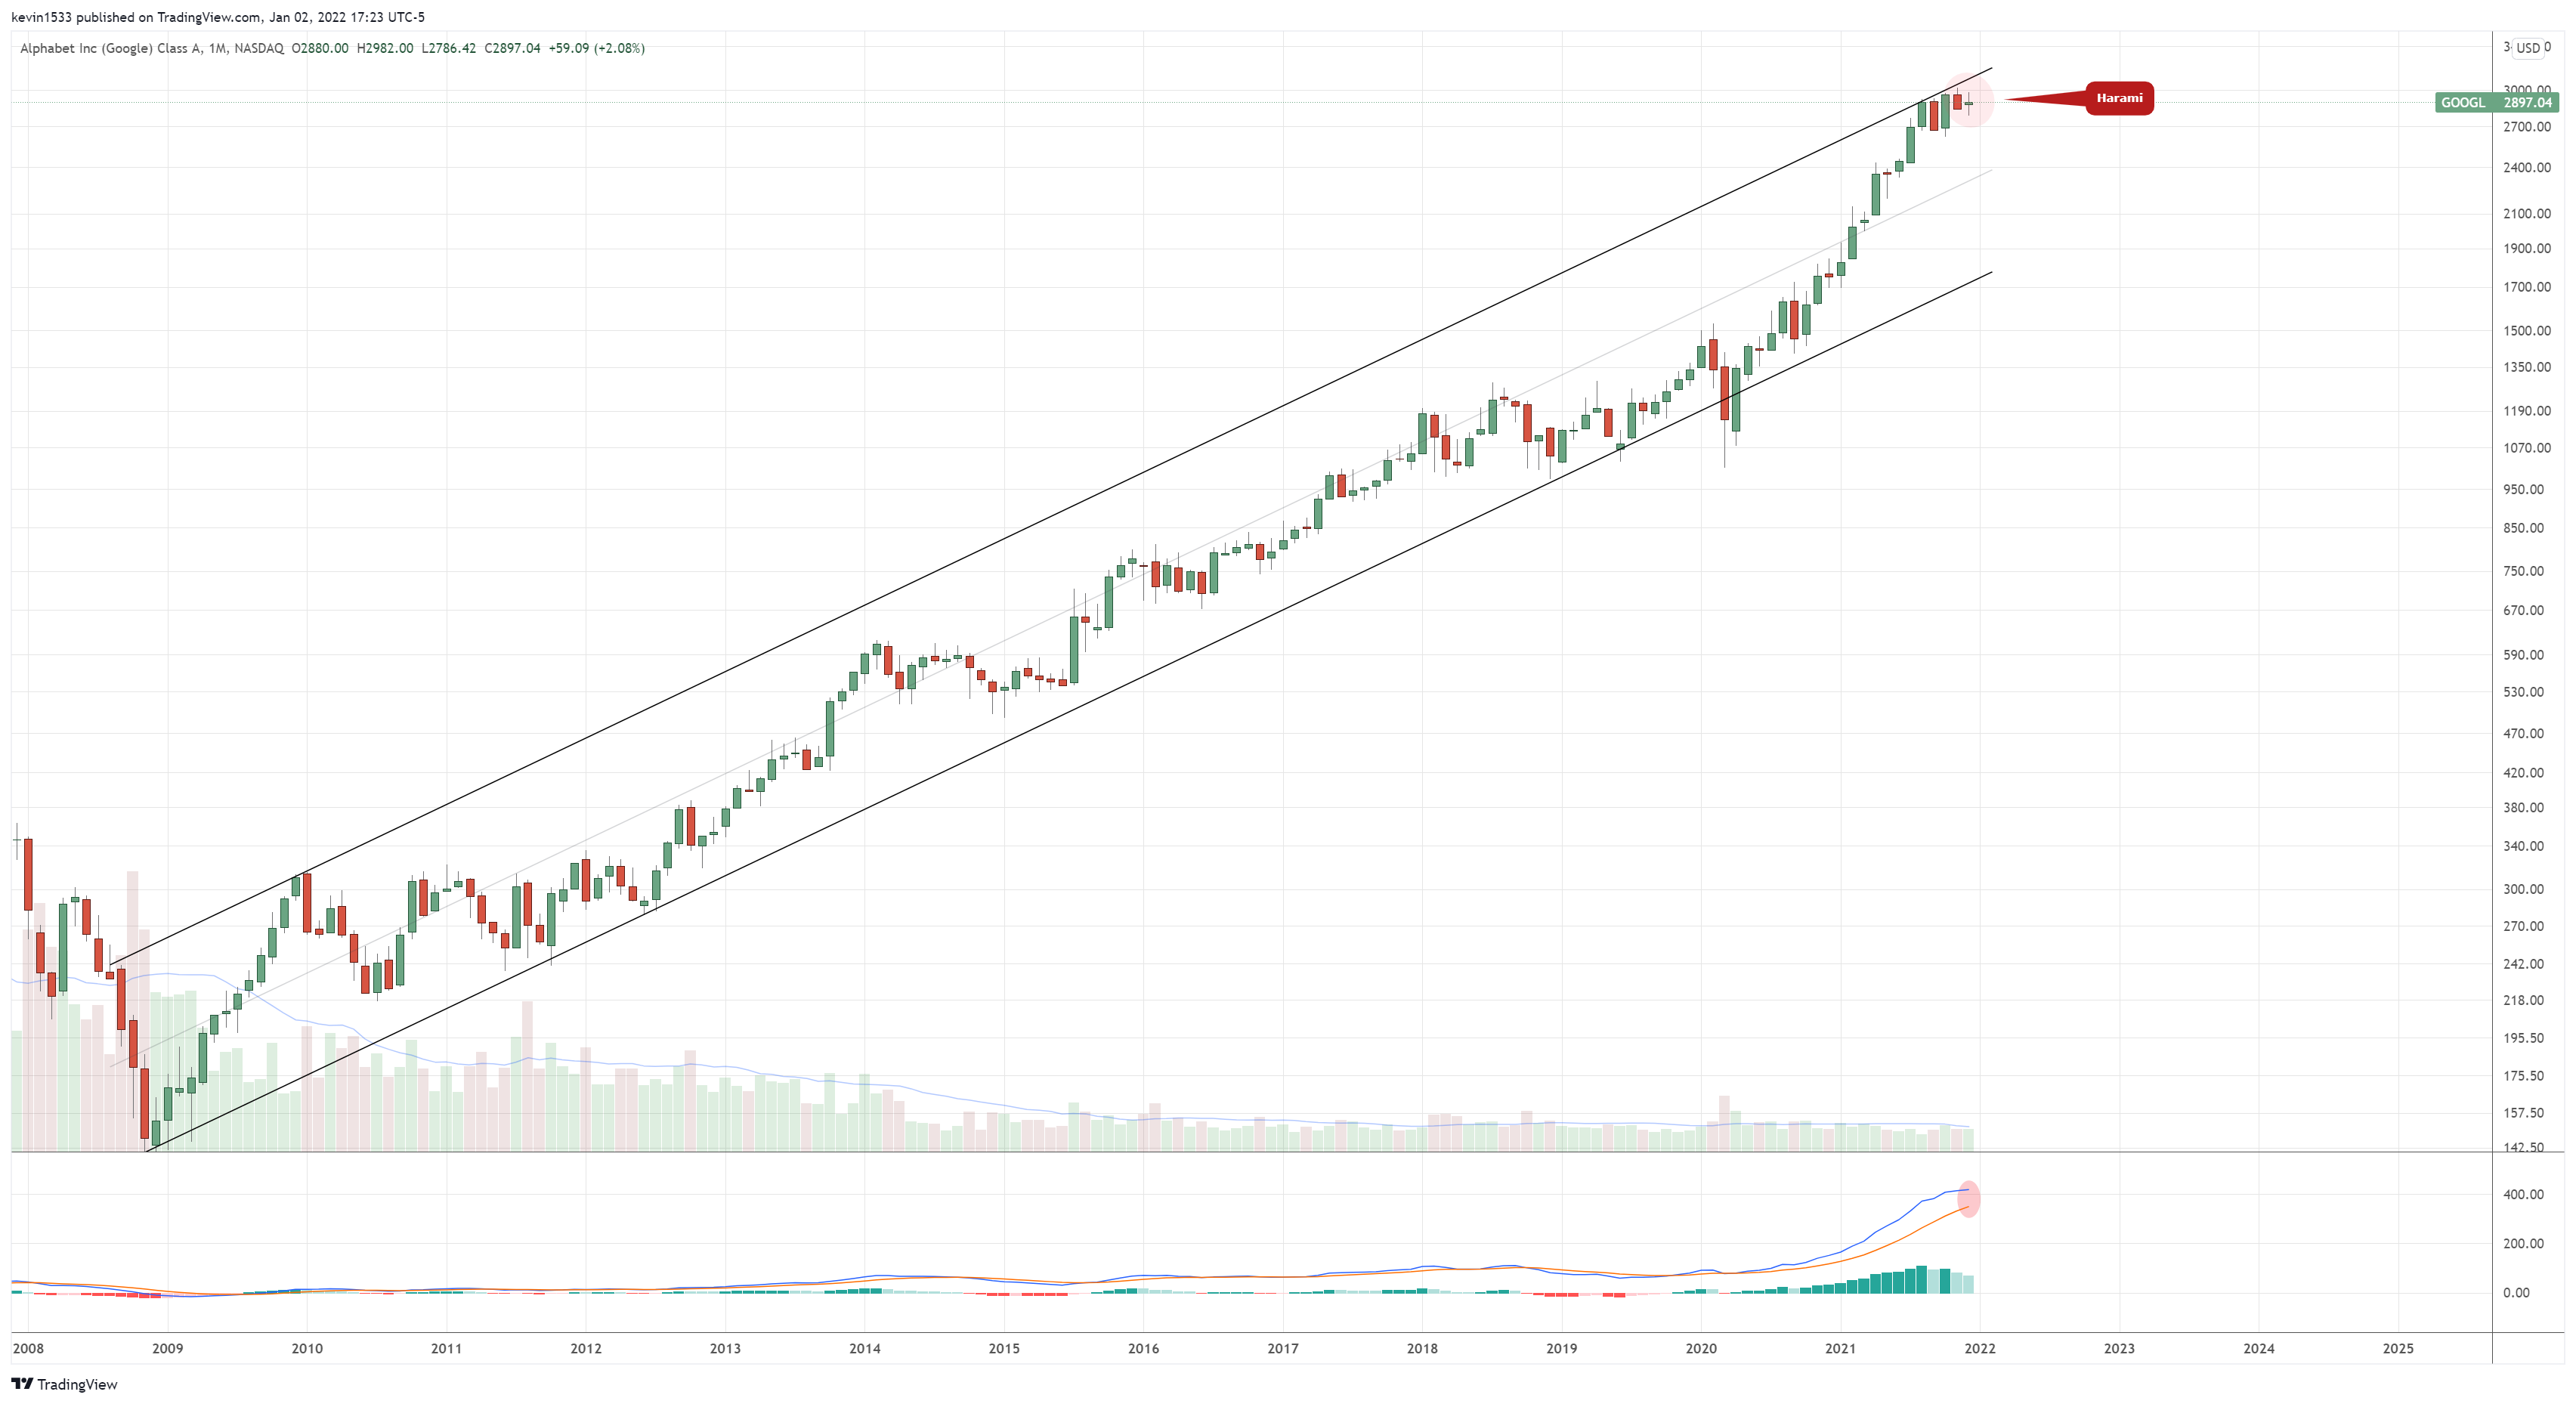
$GOOGL (monthly) Harami at the top of 13 year channel. If the resistance holds and we resolve to the downside, MACD ready to fuel a strong move.
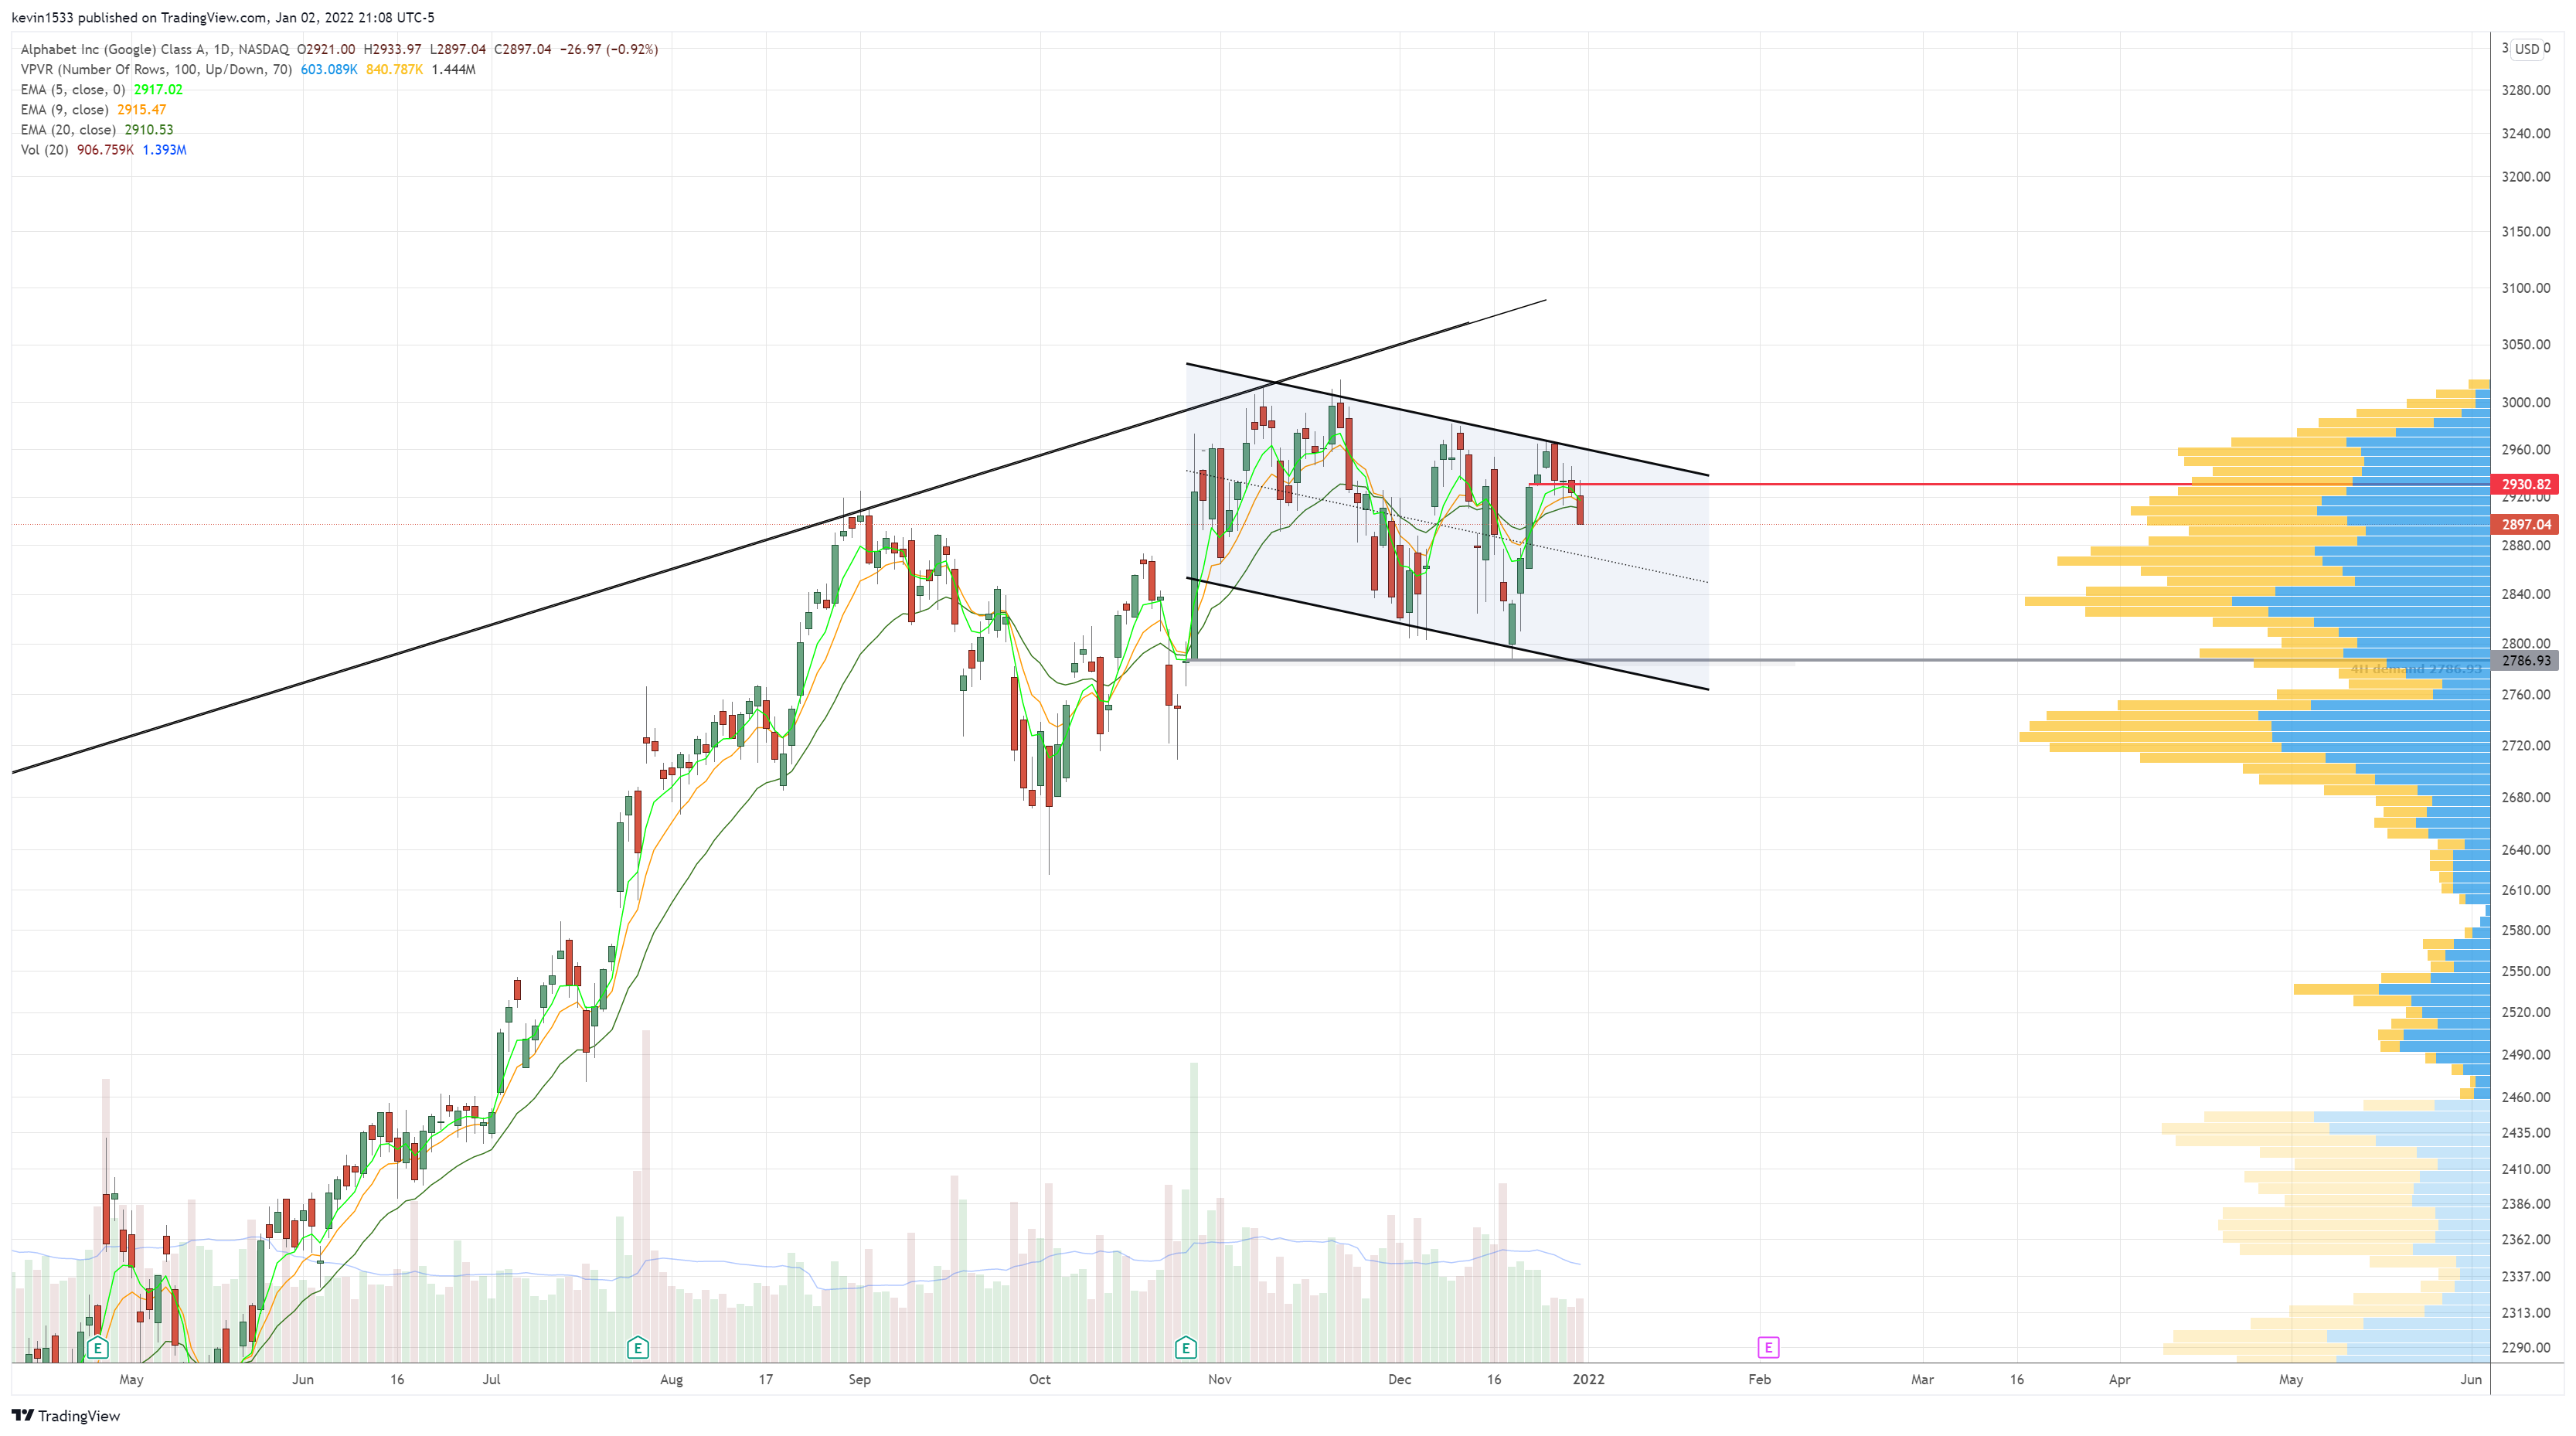
$GOOGL (daily) following bearish engulfing rejection at short term downtrend channel, closed below 5/9/20ema converged
$AMZN (monthly) failed breakout reversal with 5/9ema converged. Bears have the edge.

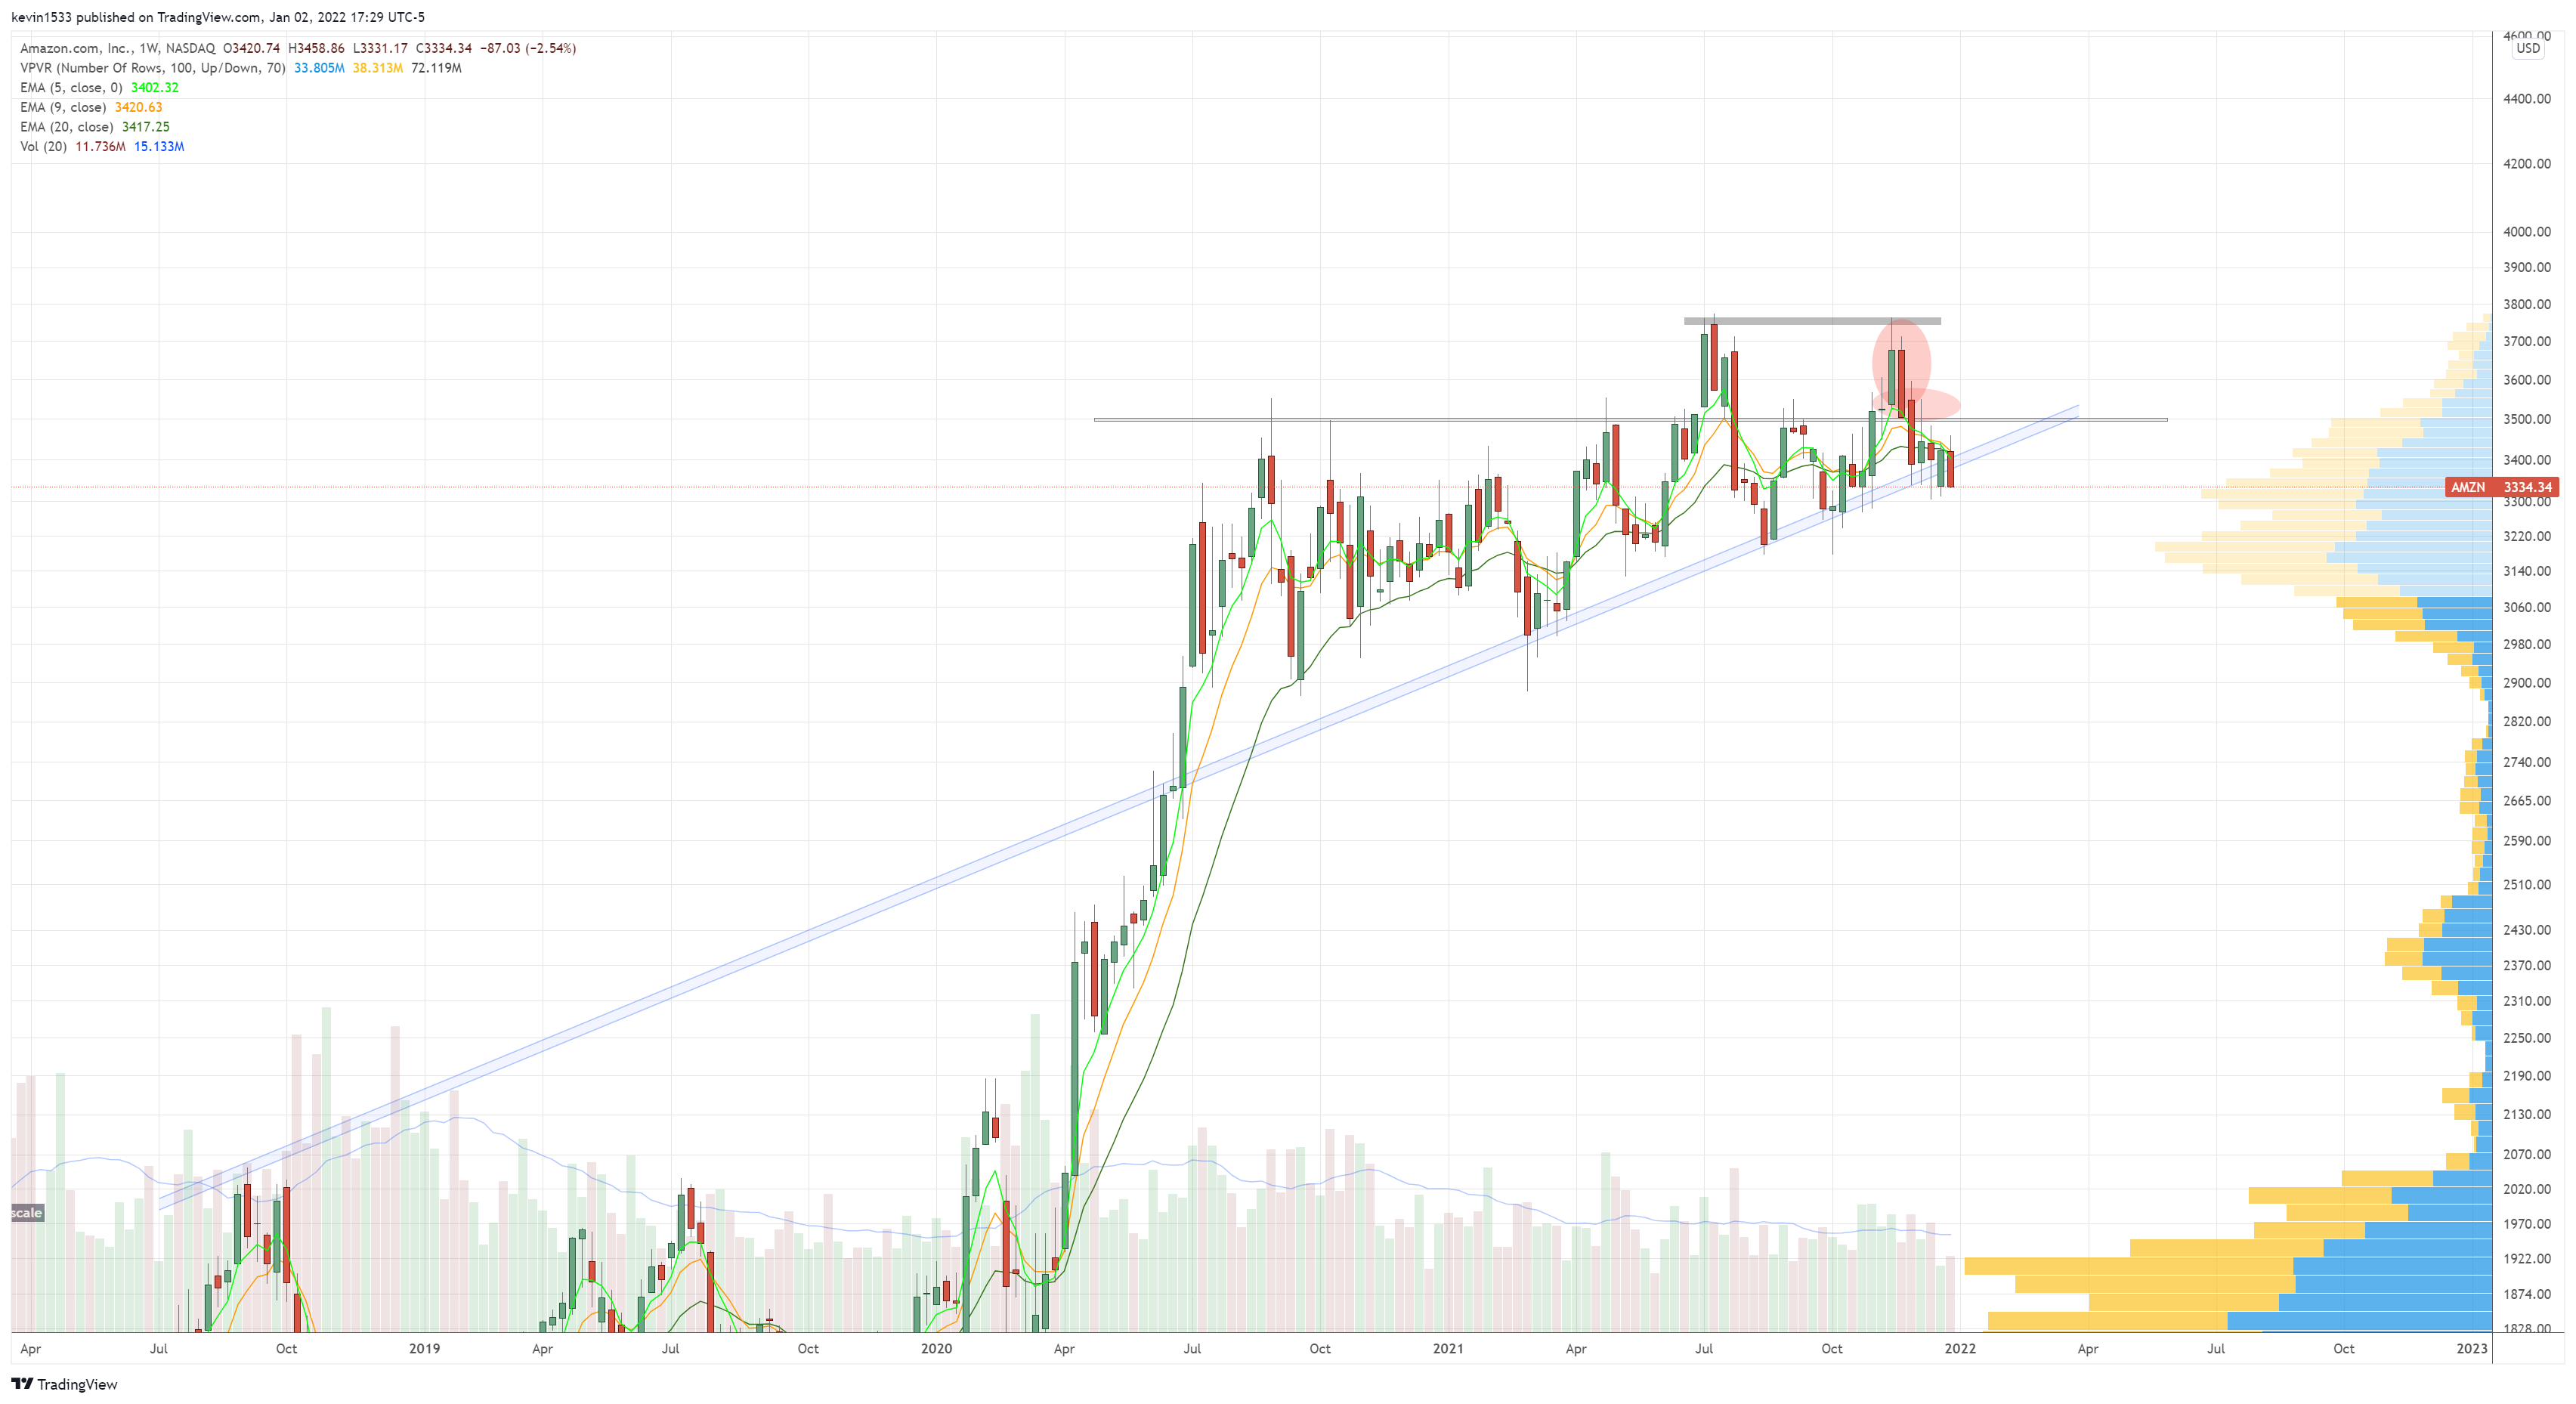
$AMZN (weekly) So far double top and failed breakout and now rejected at 5/9/20ema converged resistance with close back below uptrend line resistance
$TSLA (monthly) Doji at major channel resistance at ATHs. Let’s see if current monthly candle confirms a bearish reversal. RSI negative divergence in play.

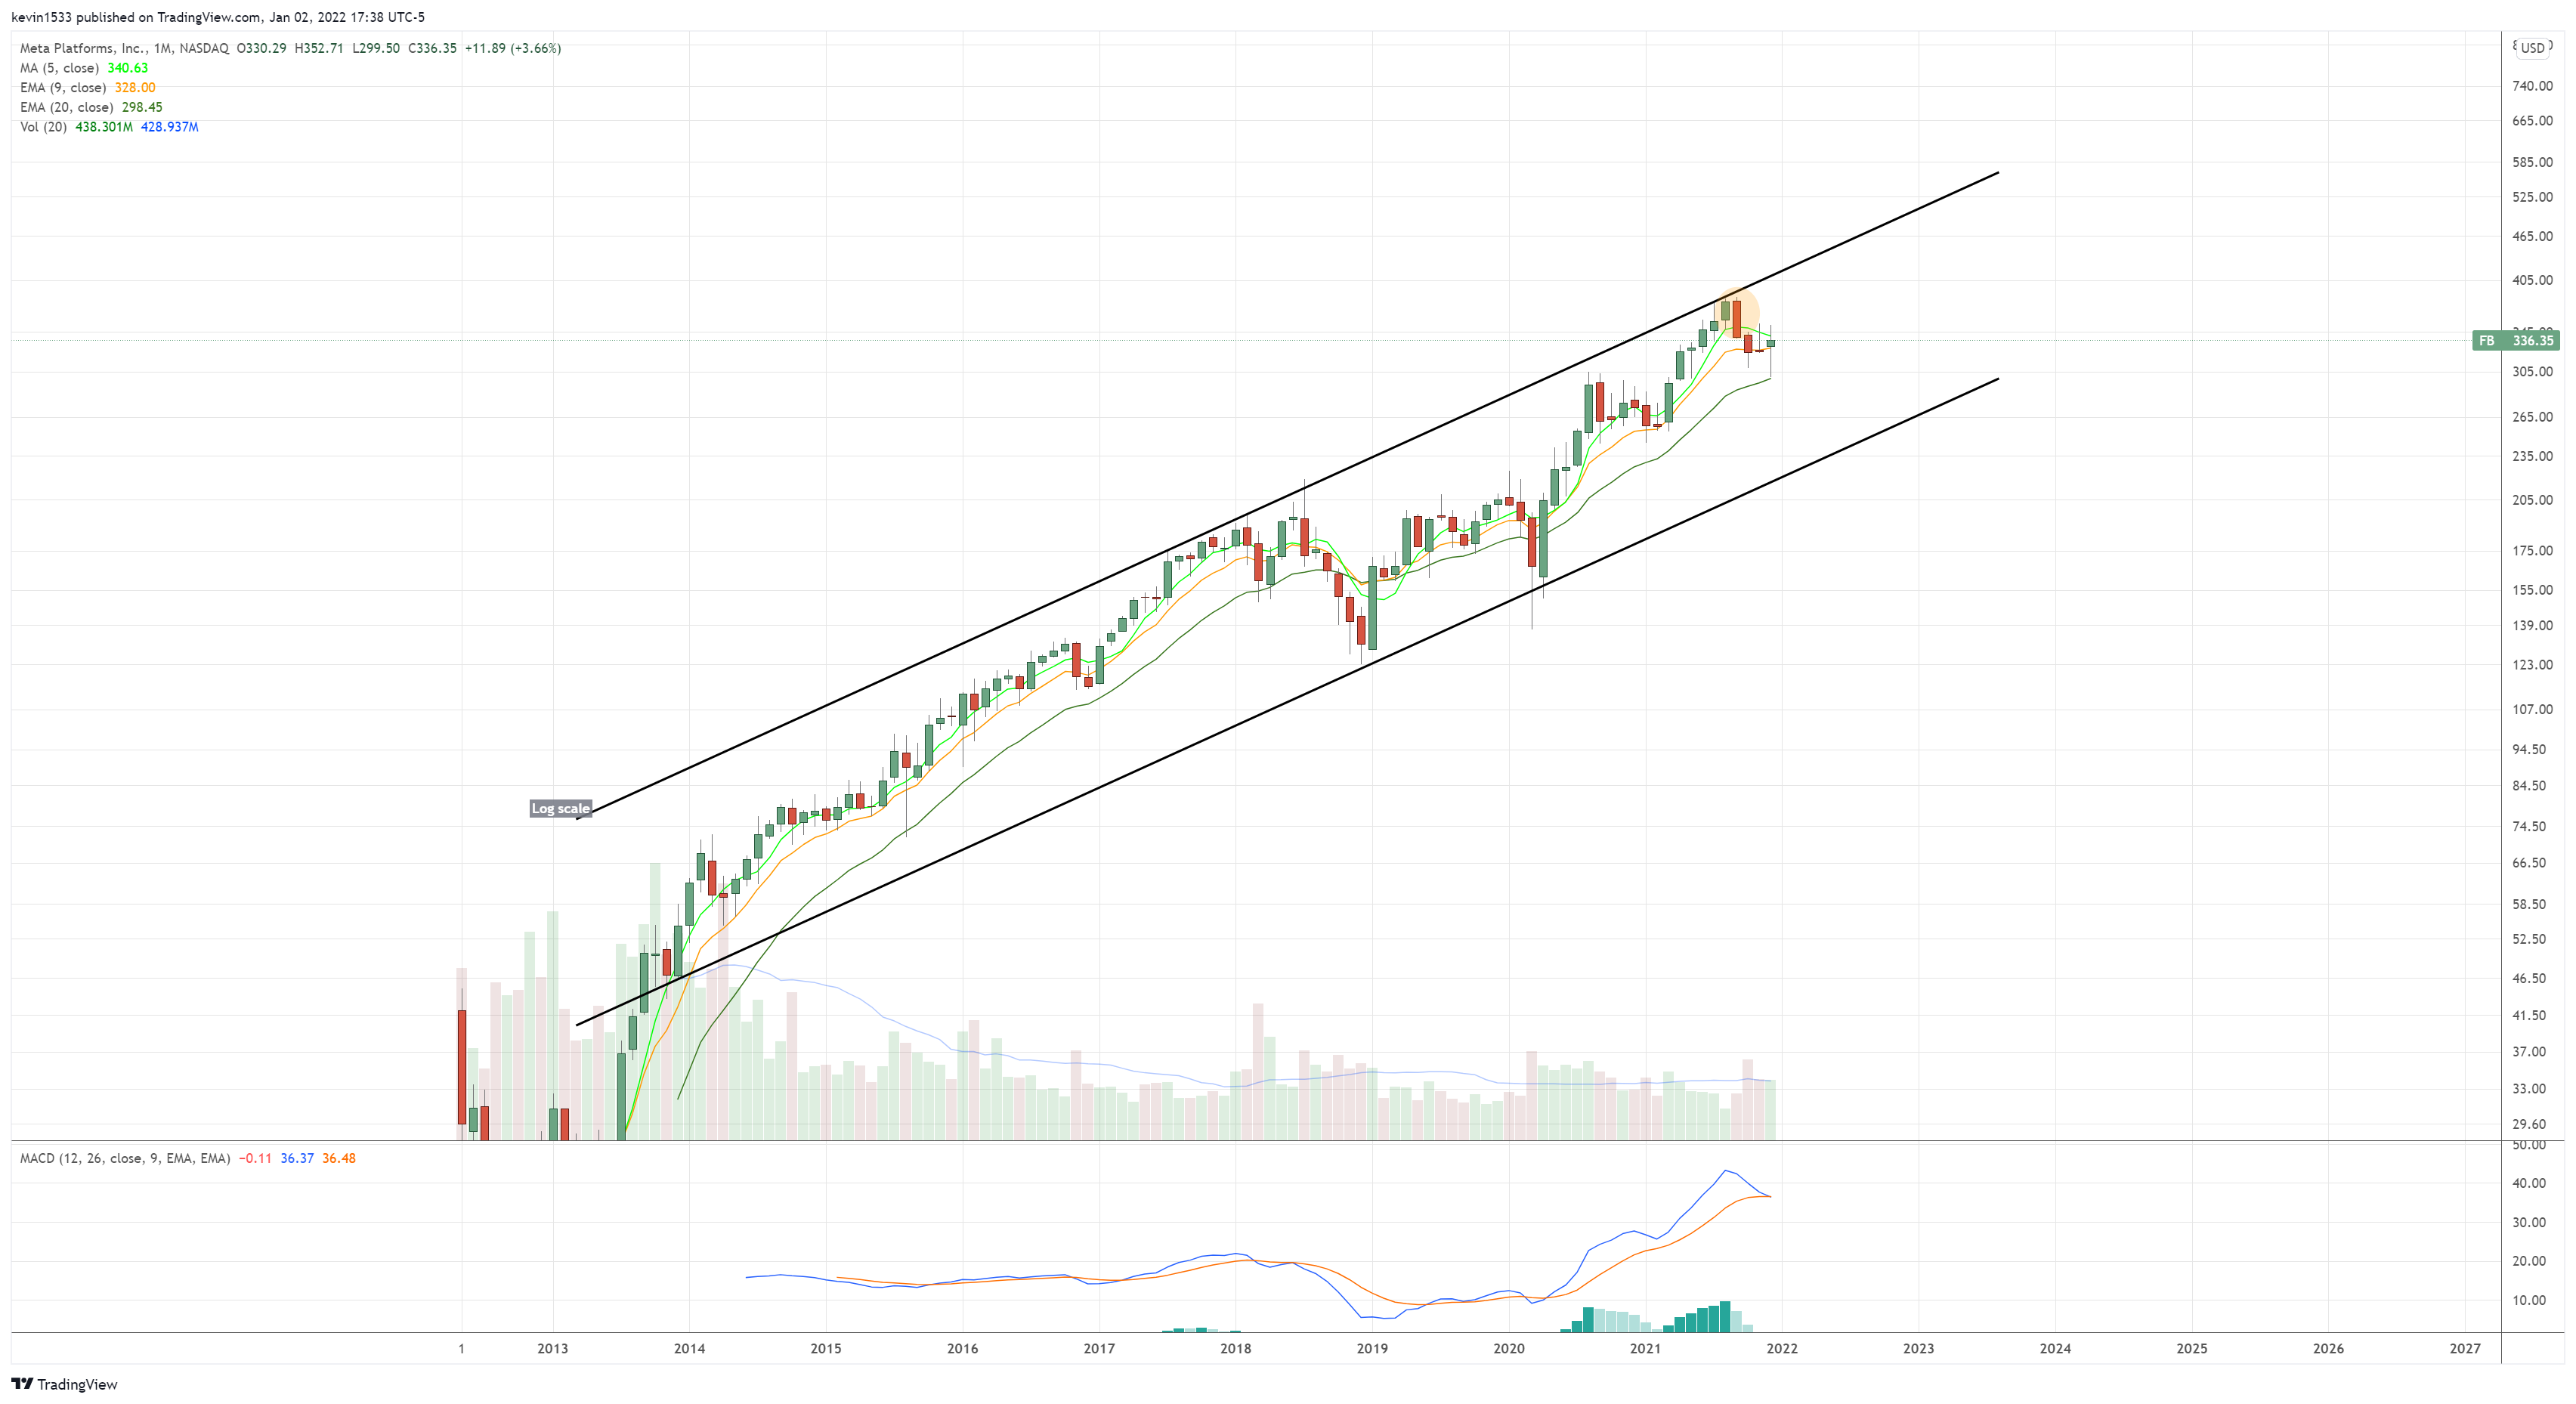
$FB (monthly) Bearish engulfing at major channel resistance is still the dominant active signal. Monthly 5/9/20ema converged
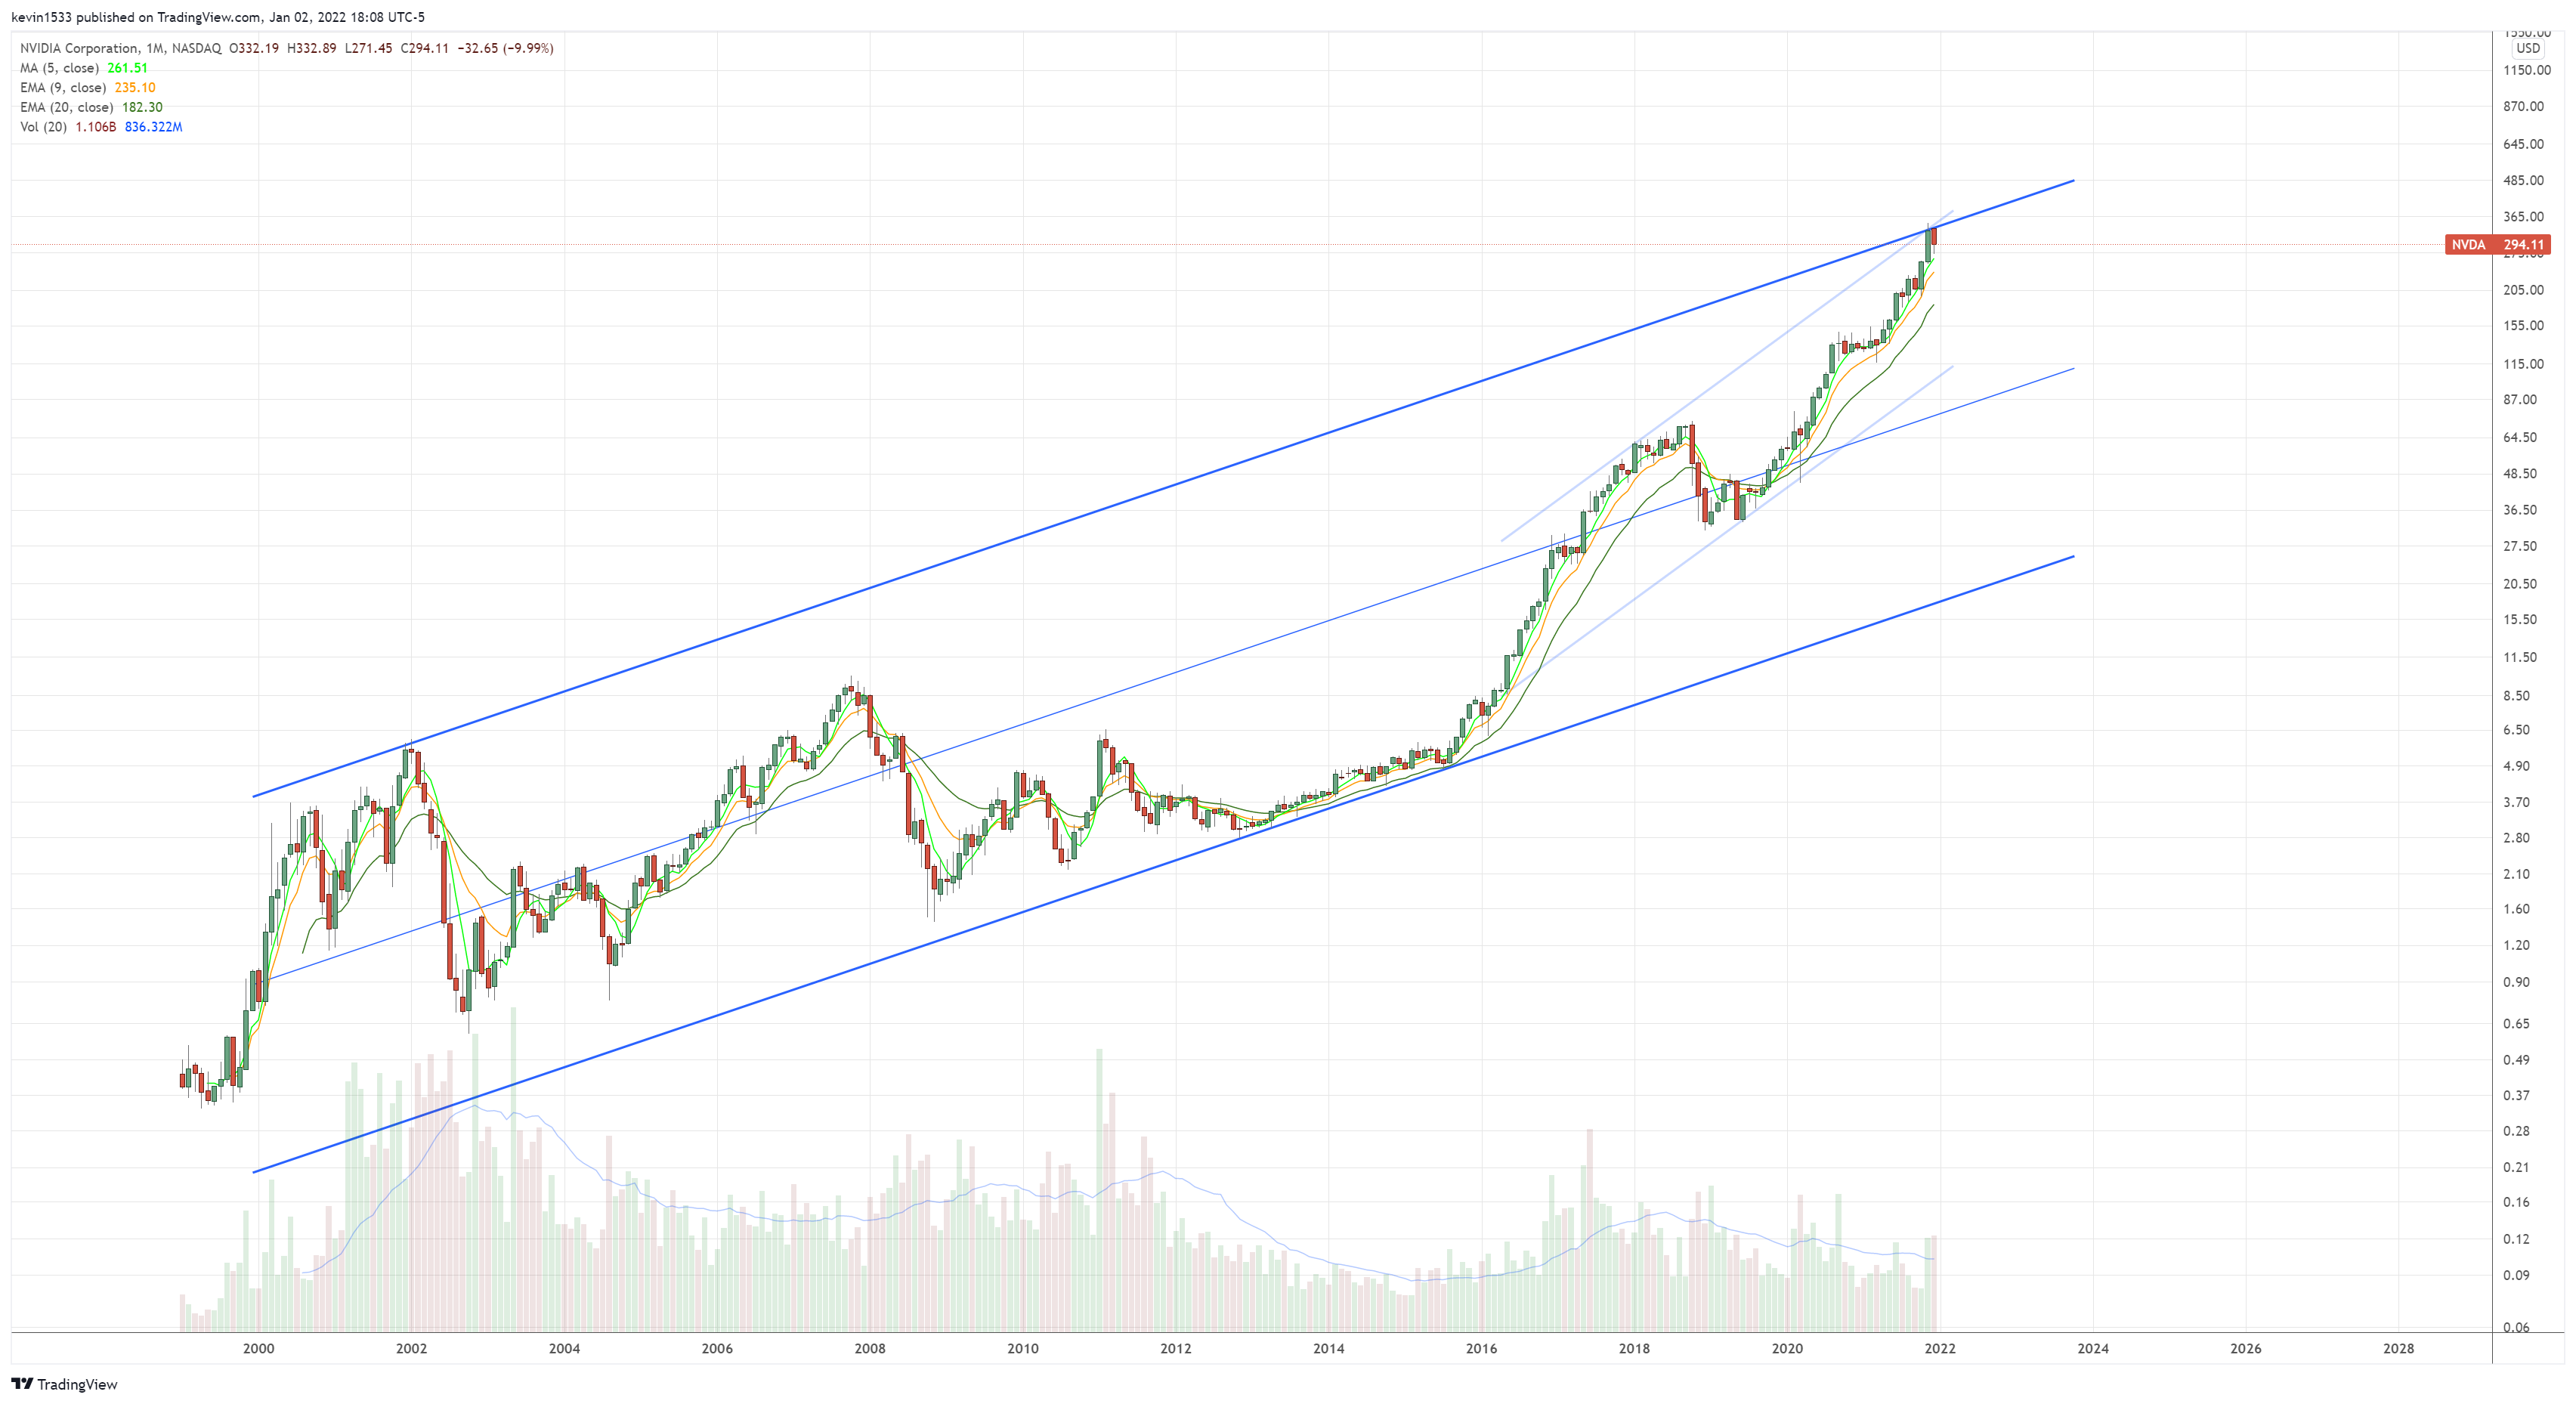
$NVDA (monthly) rejection at dual channel resistance
Most of the setups are demand/long setups. Remember you can be a bearish outlook in the market and still daytrade these levels when they trigger for intraday gains. Remember to always review prior triggered setups and see how they react.
$AAPL (daily) long setup at 164.02 and 150.37

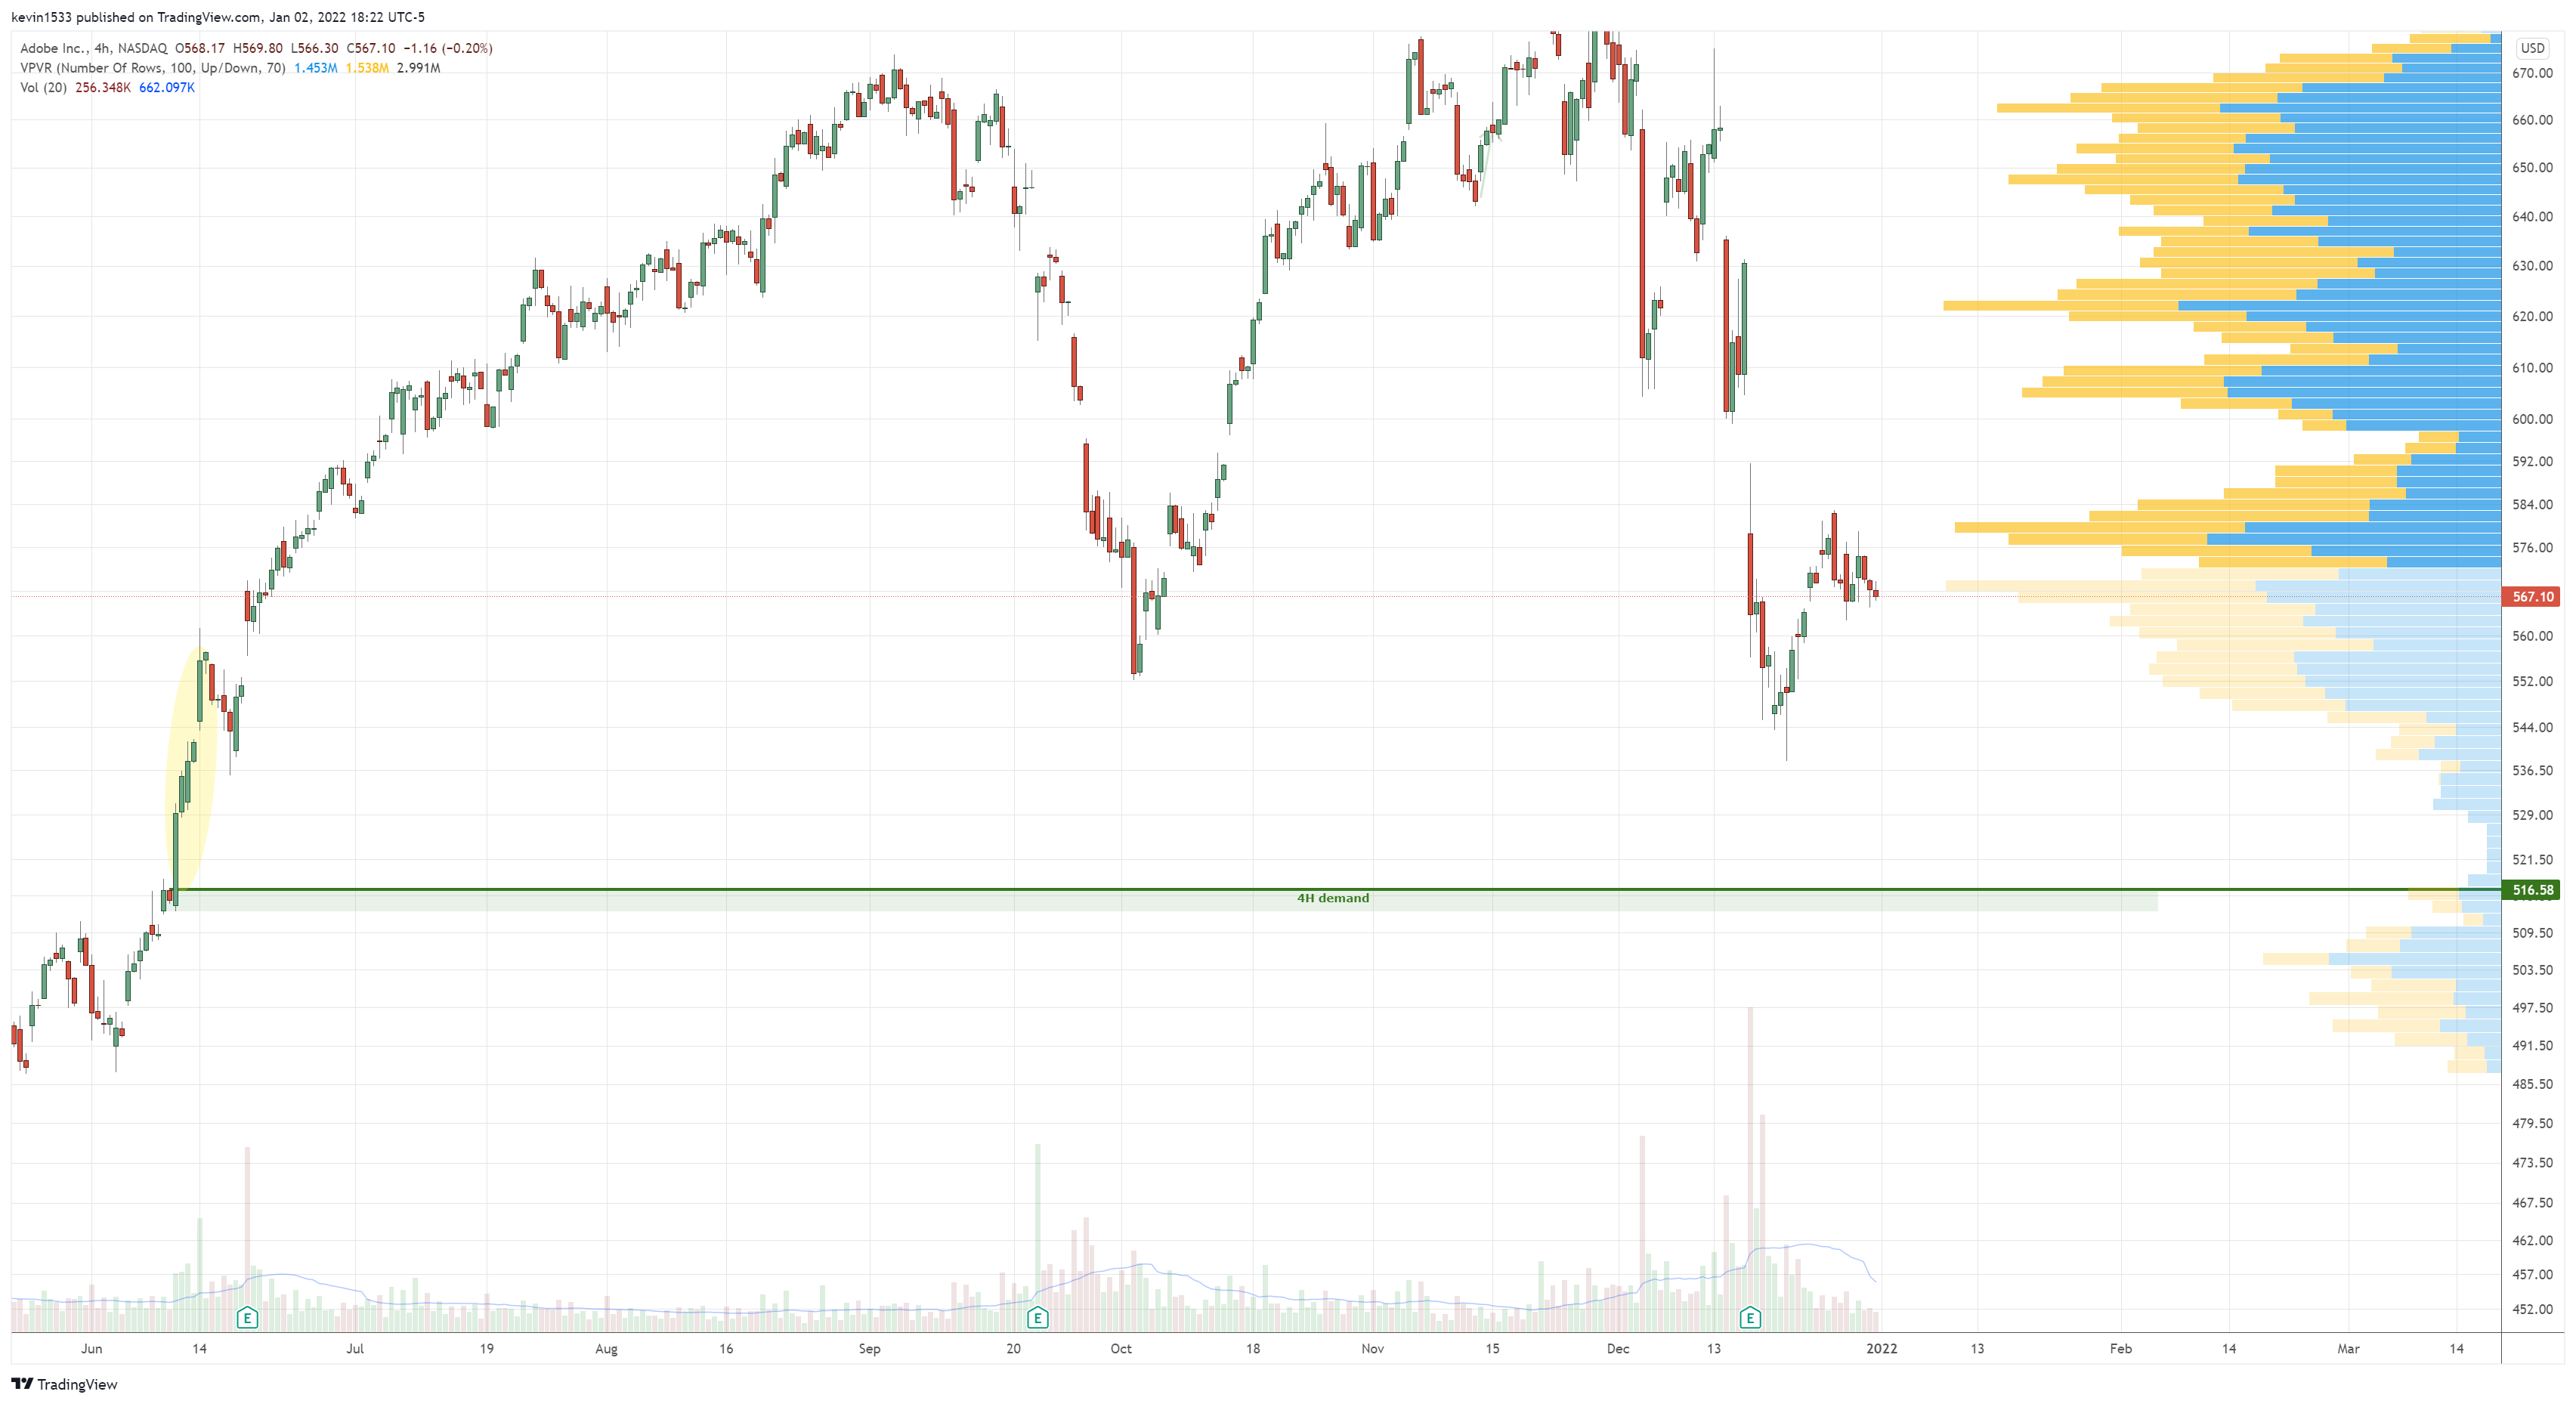
$ADBE (4H) long setup at 516.58
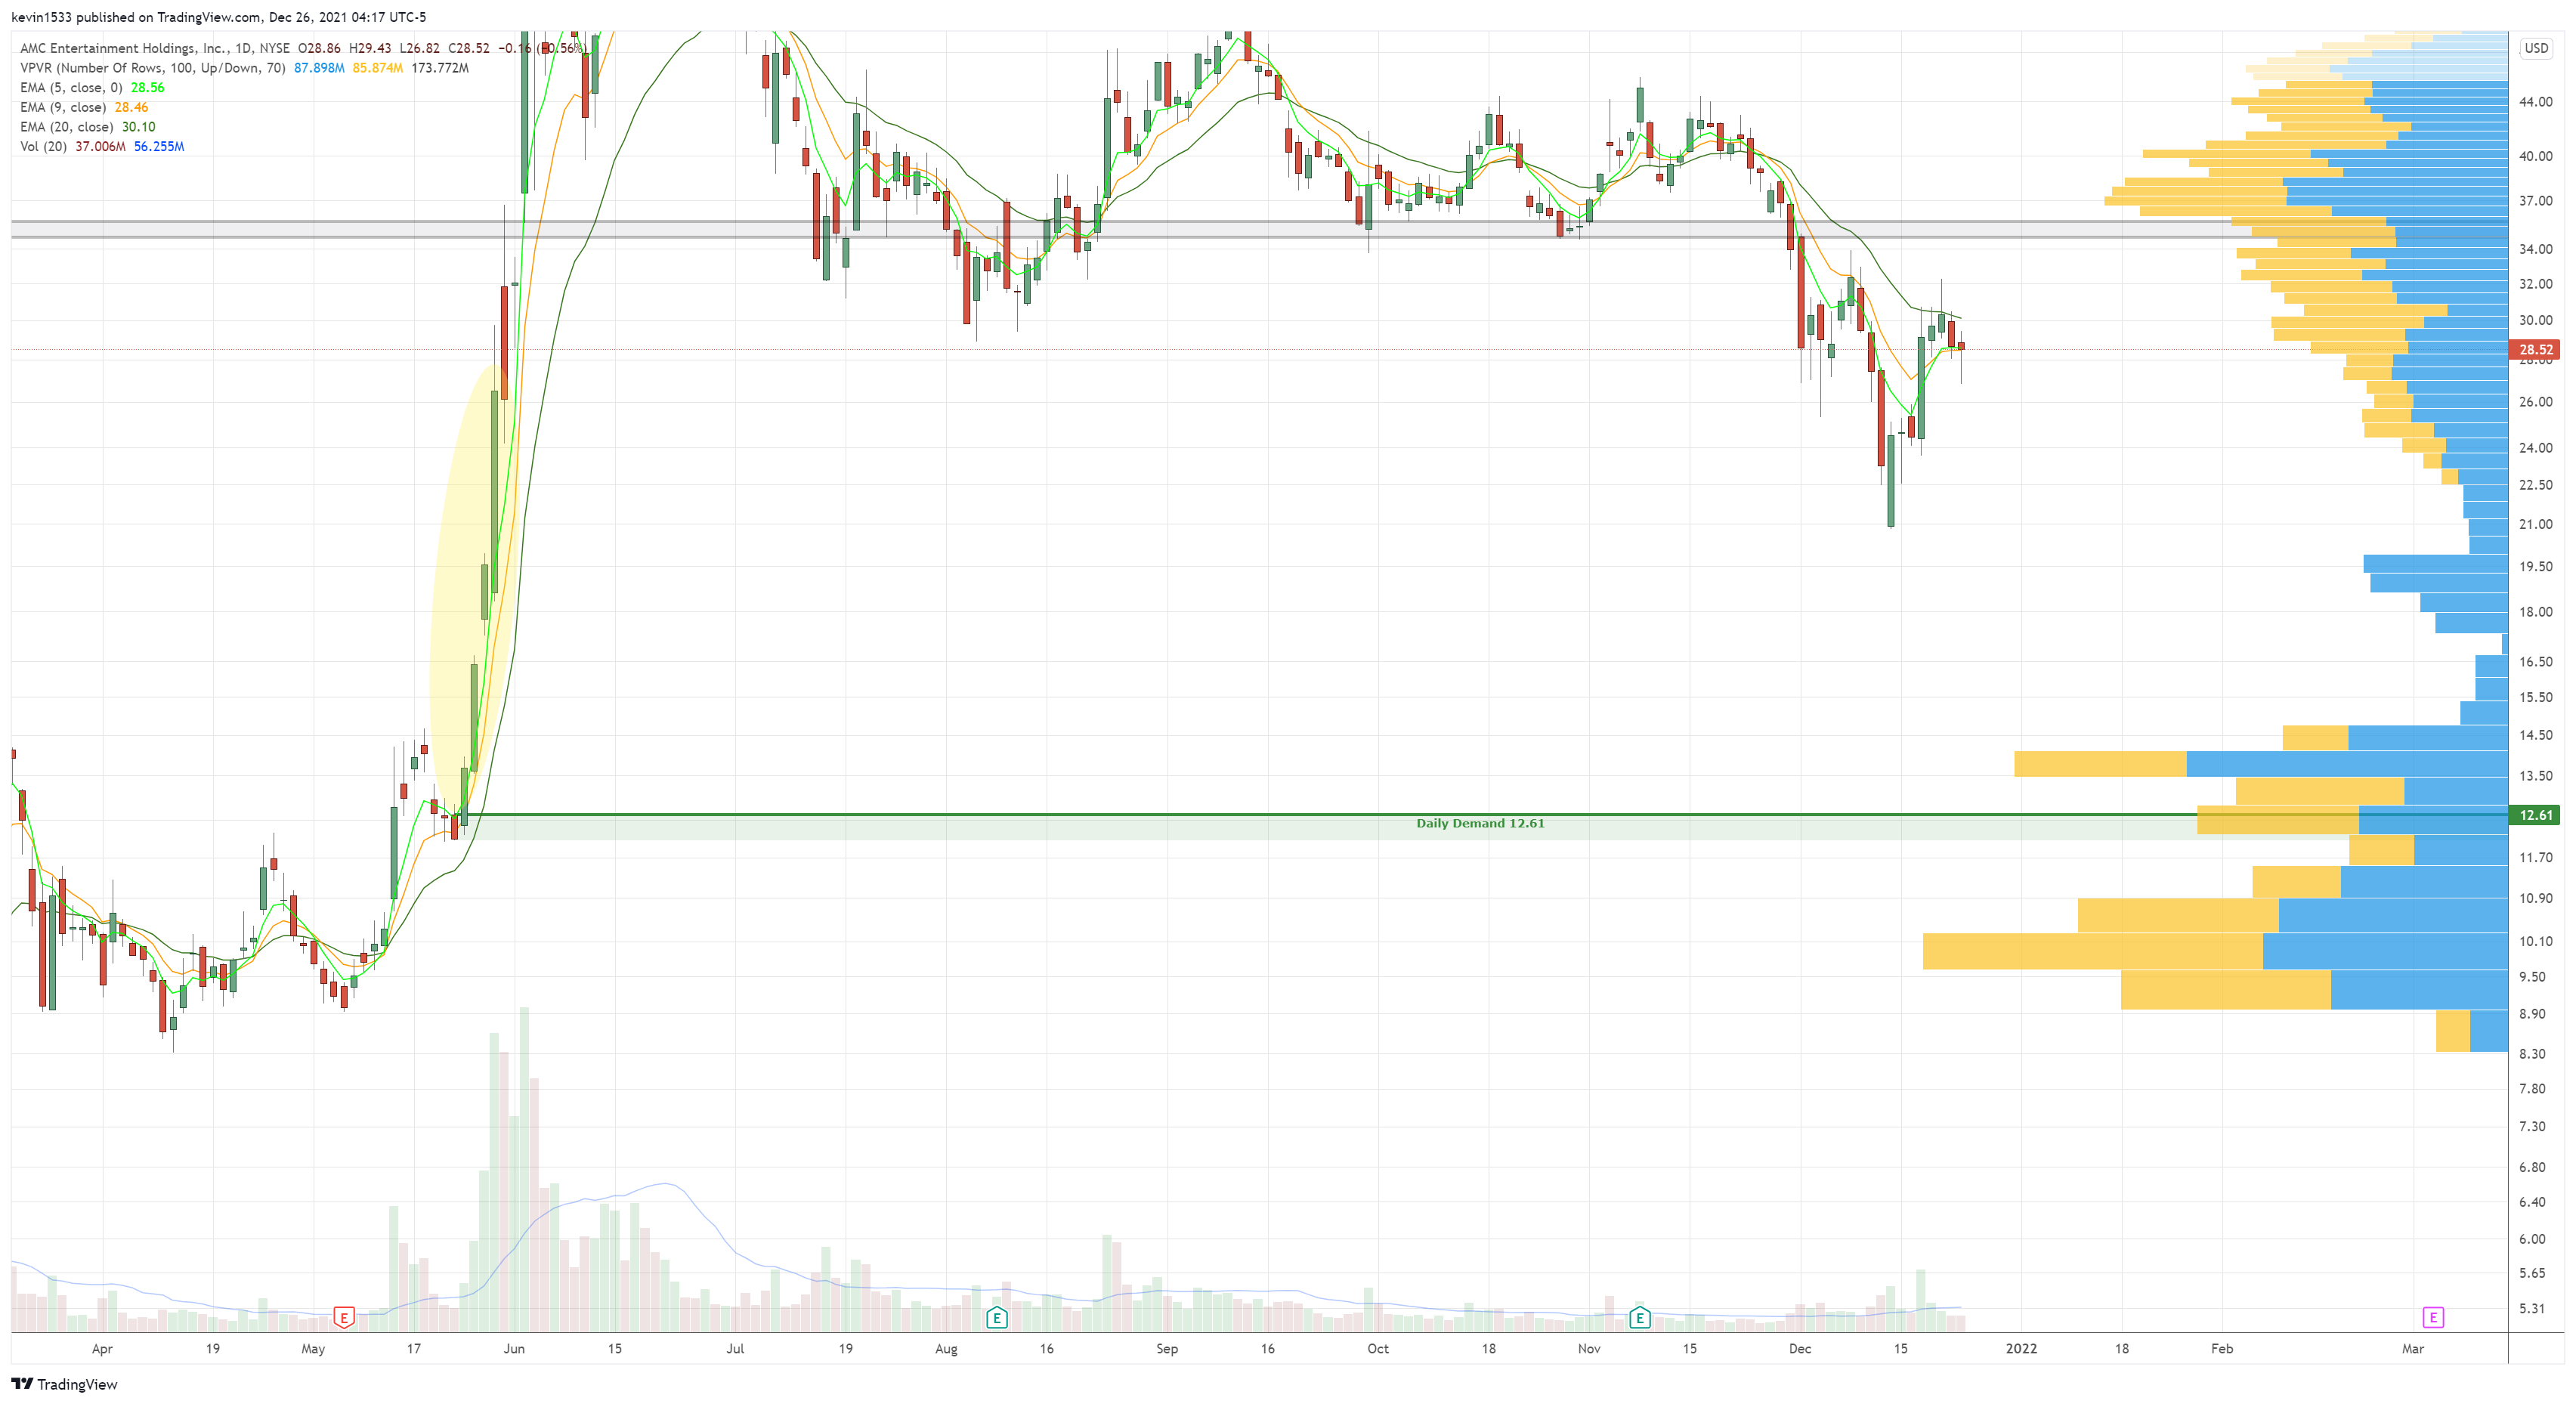
$AMC (daily) long setup at 12.61
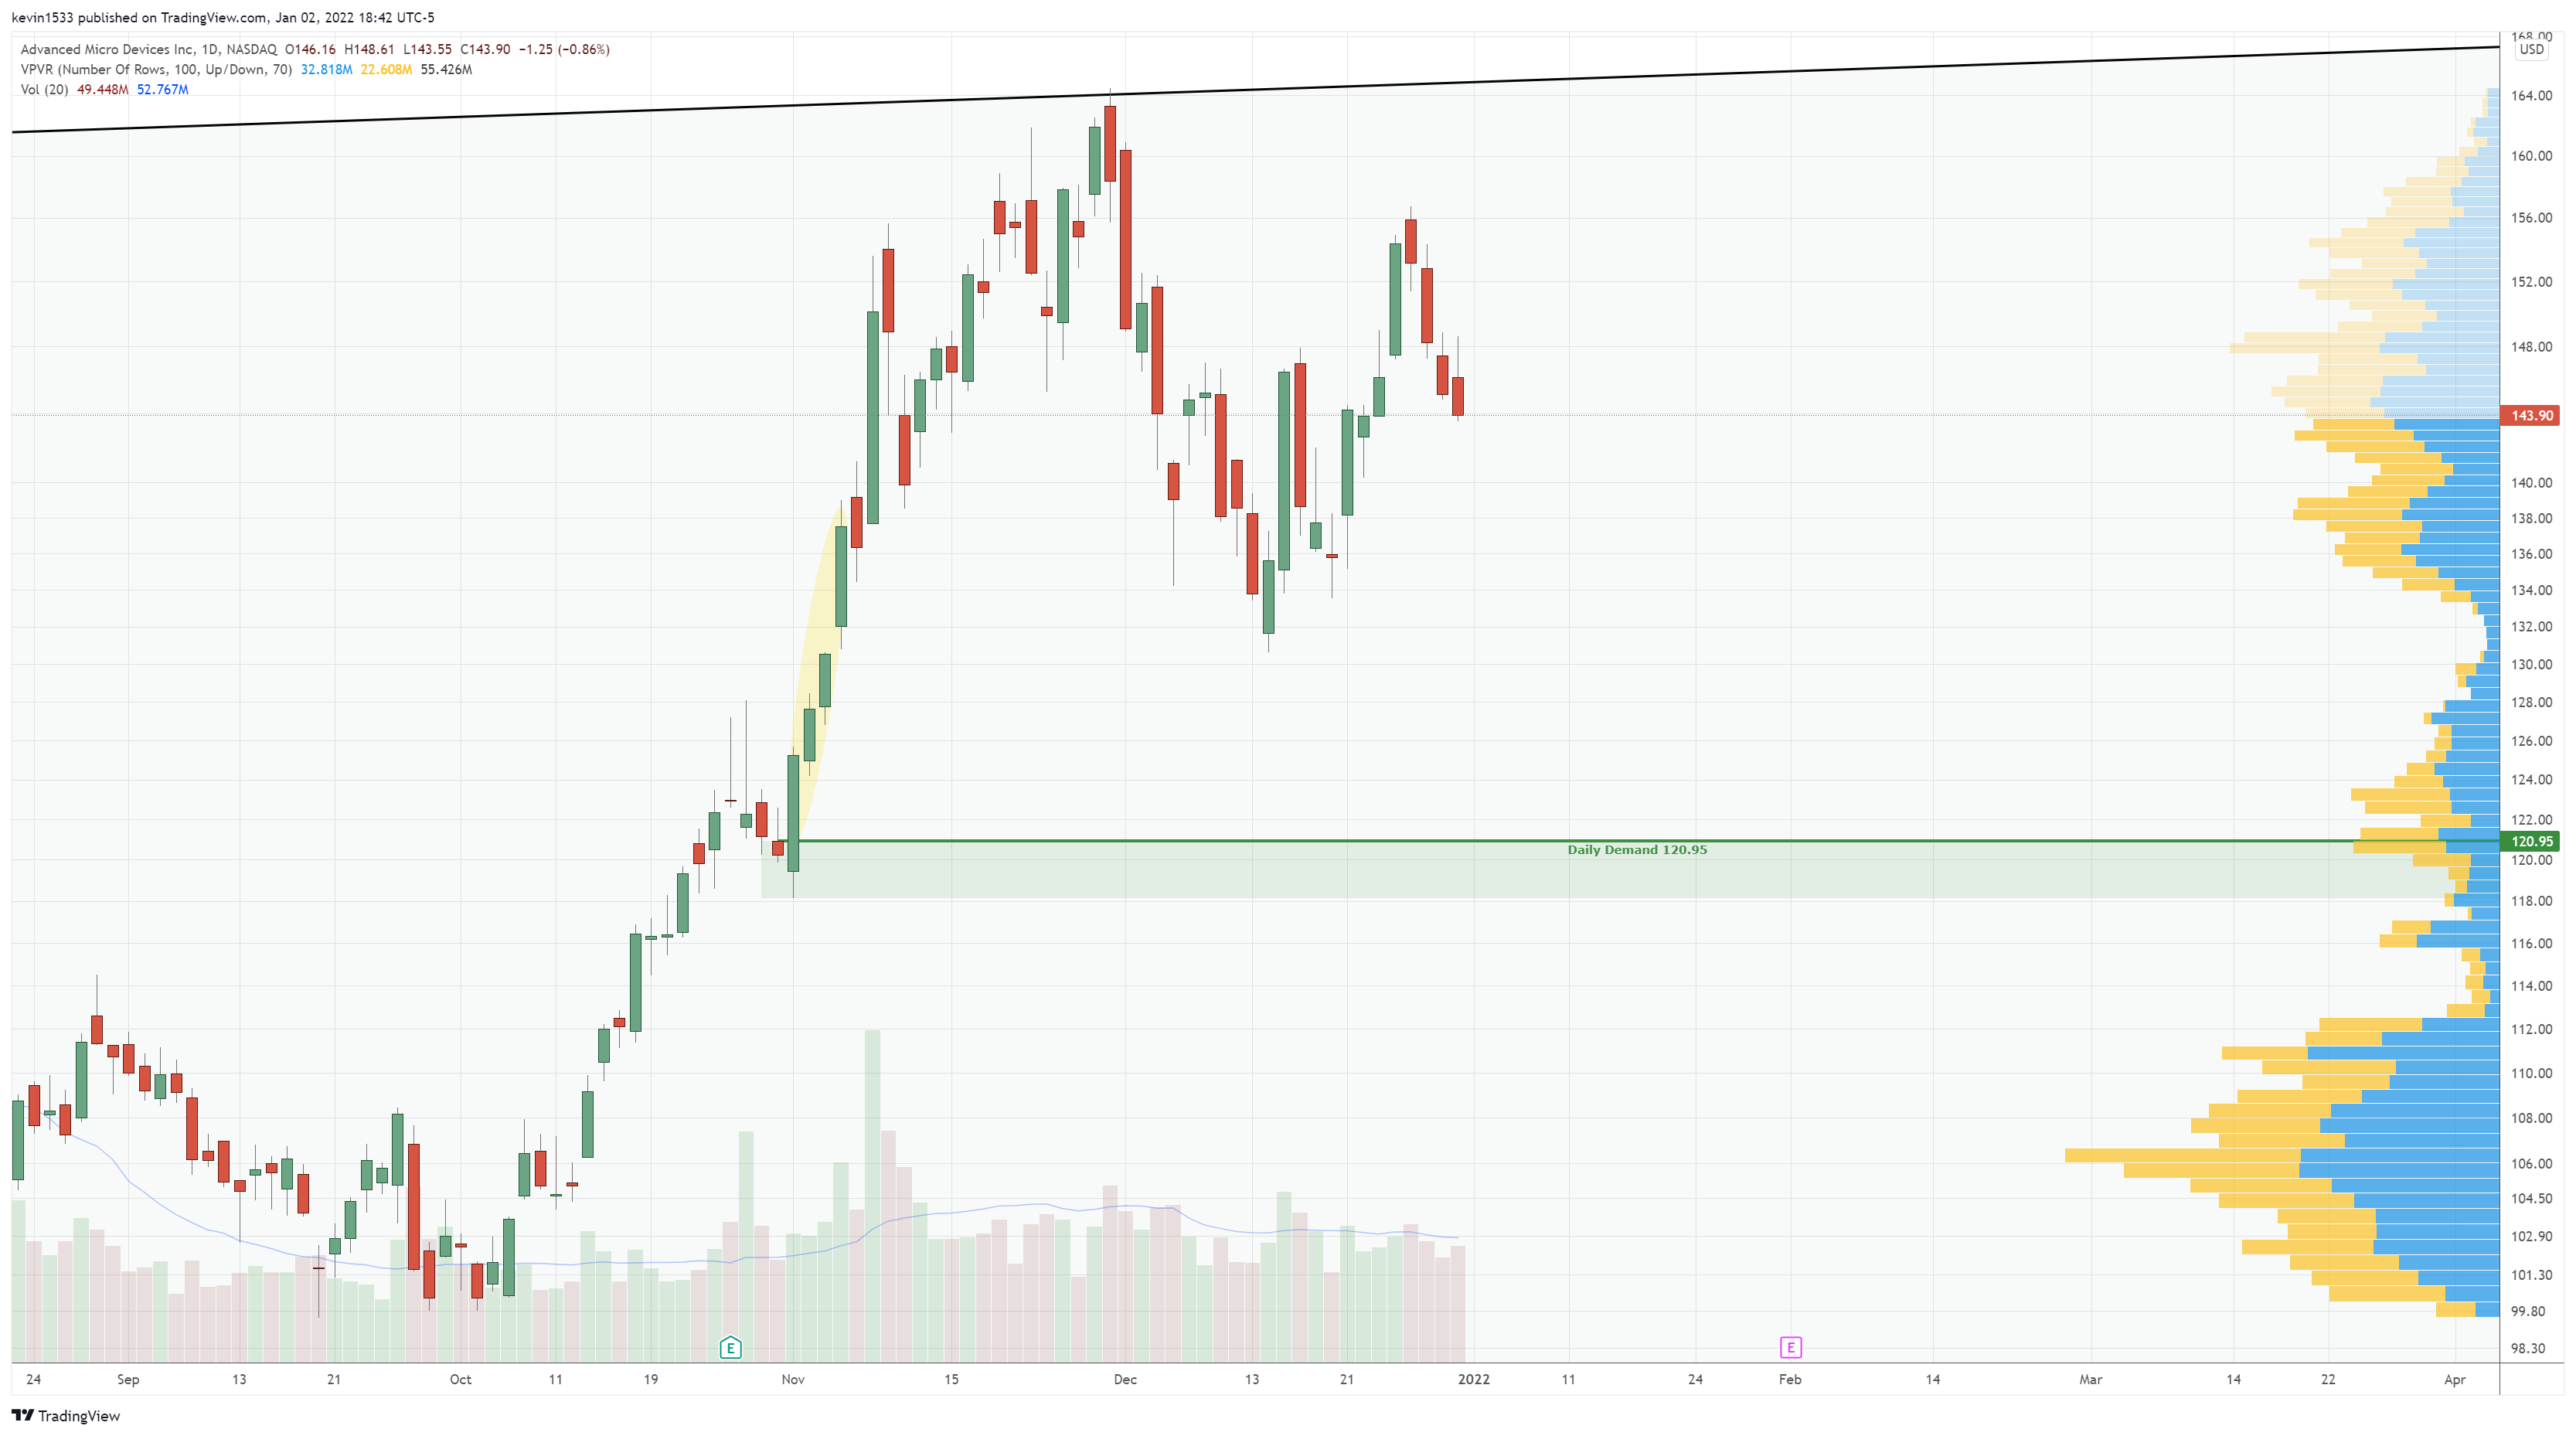
$AMD (daily) long setup at 120.95
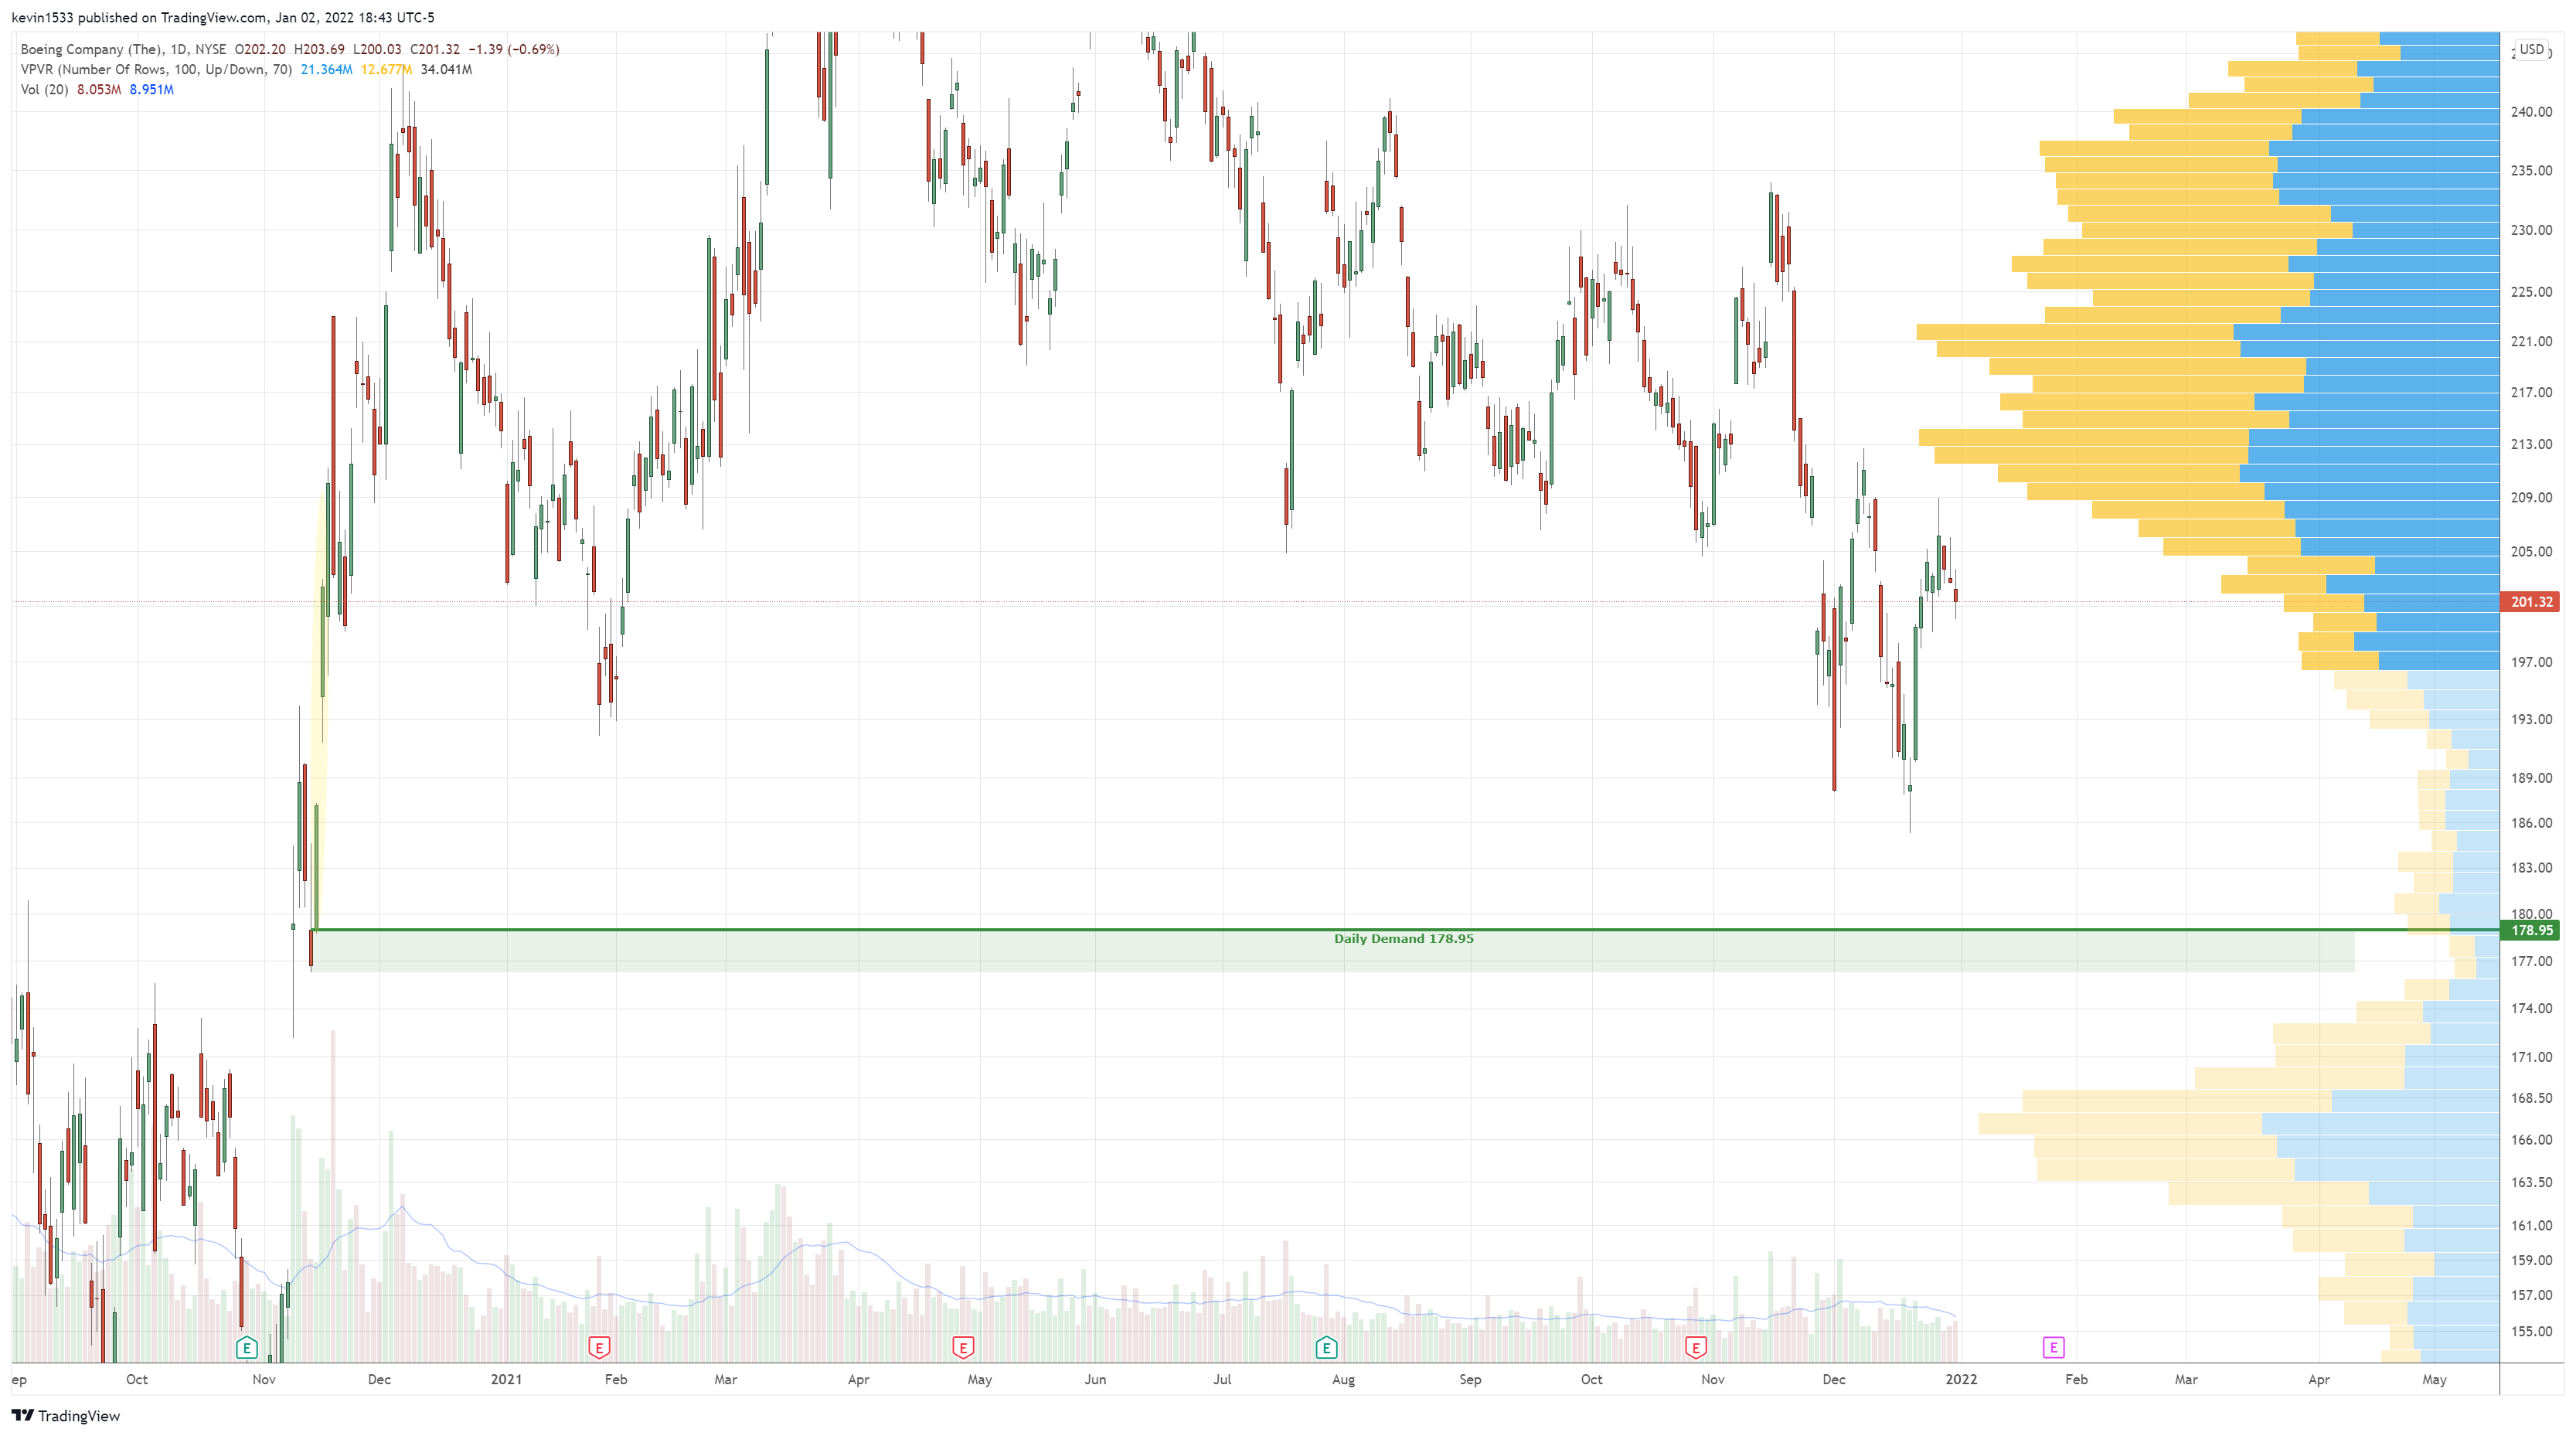
$BA (daily) long setup at 178.95
$CAT (daily) long setup at 190.50

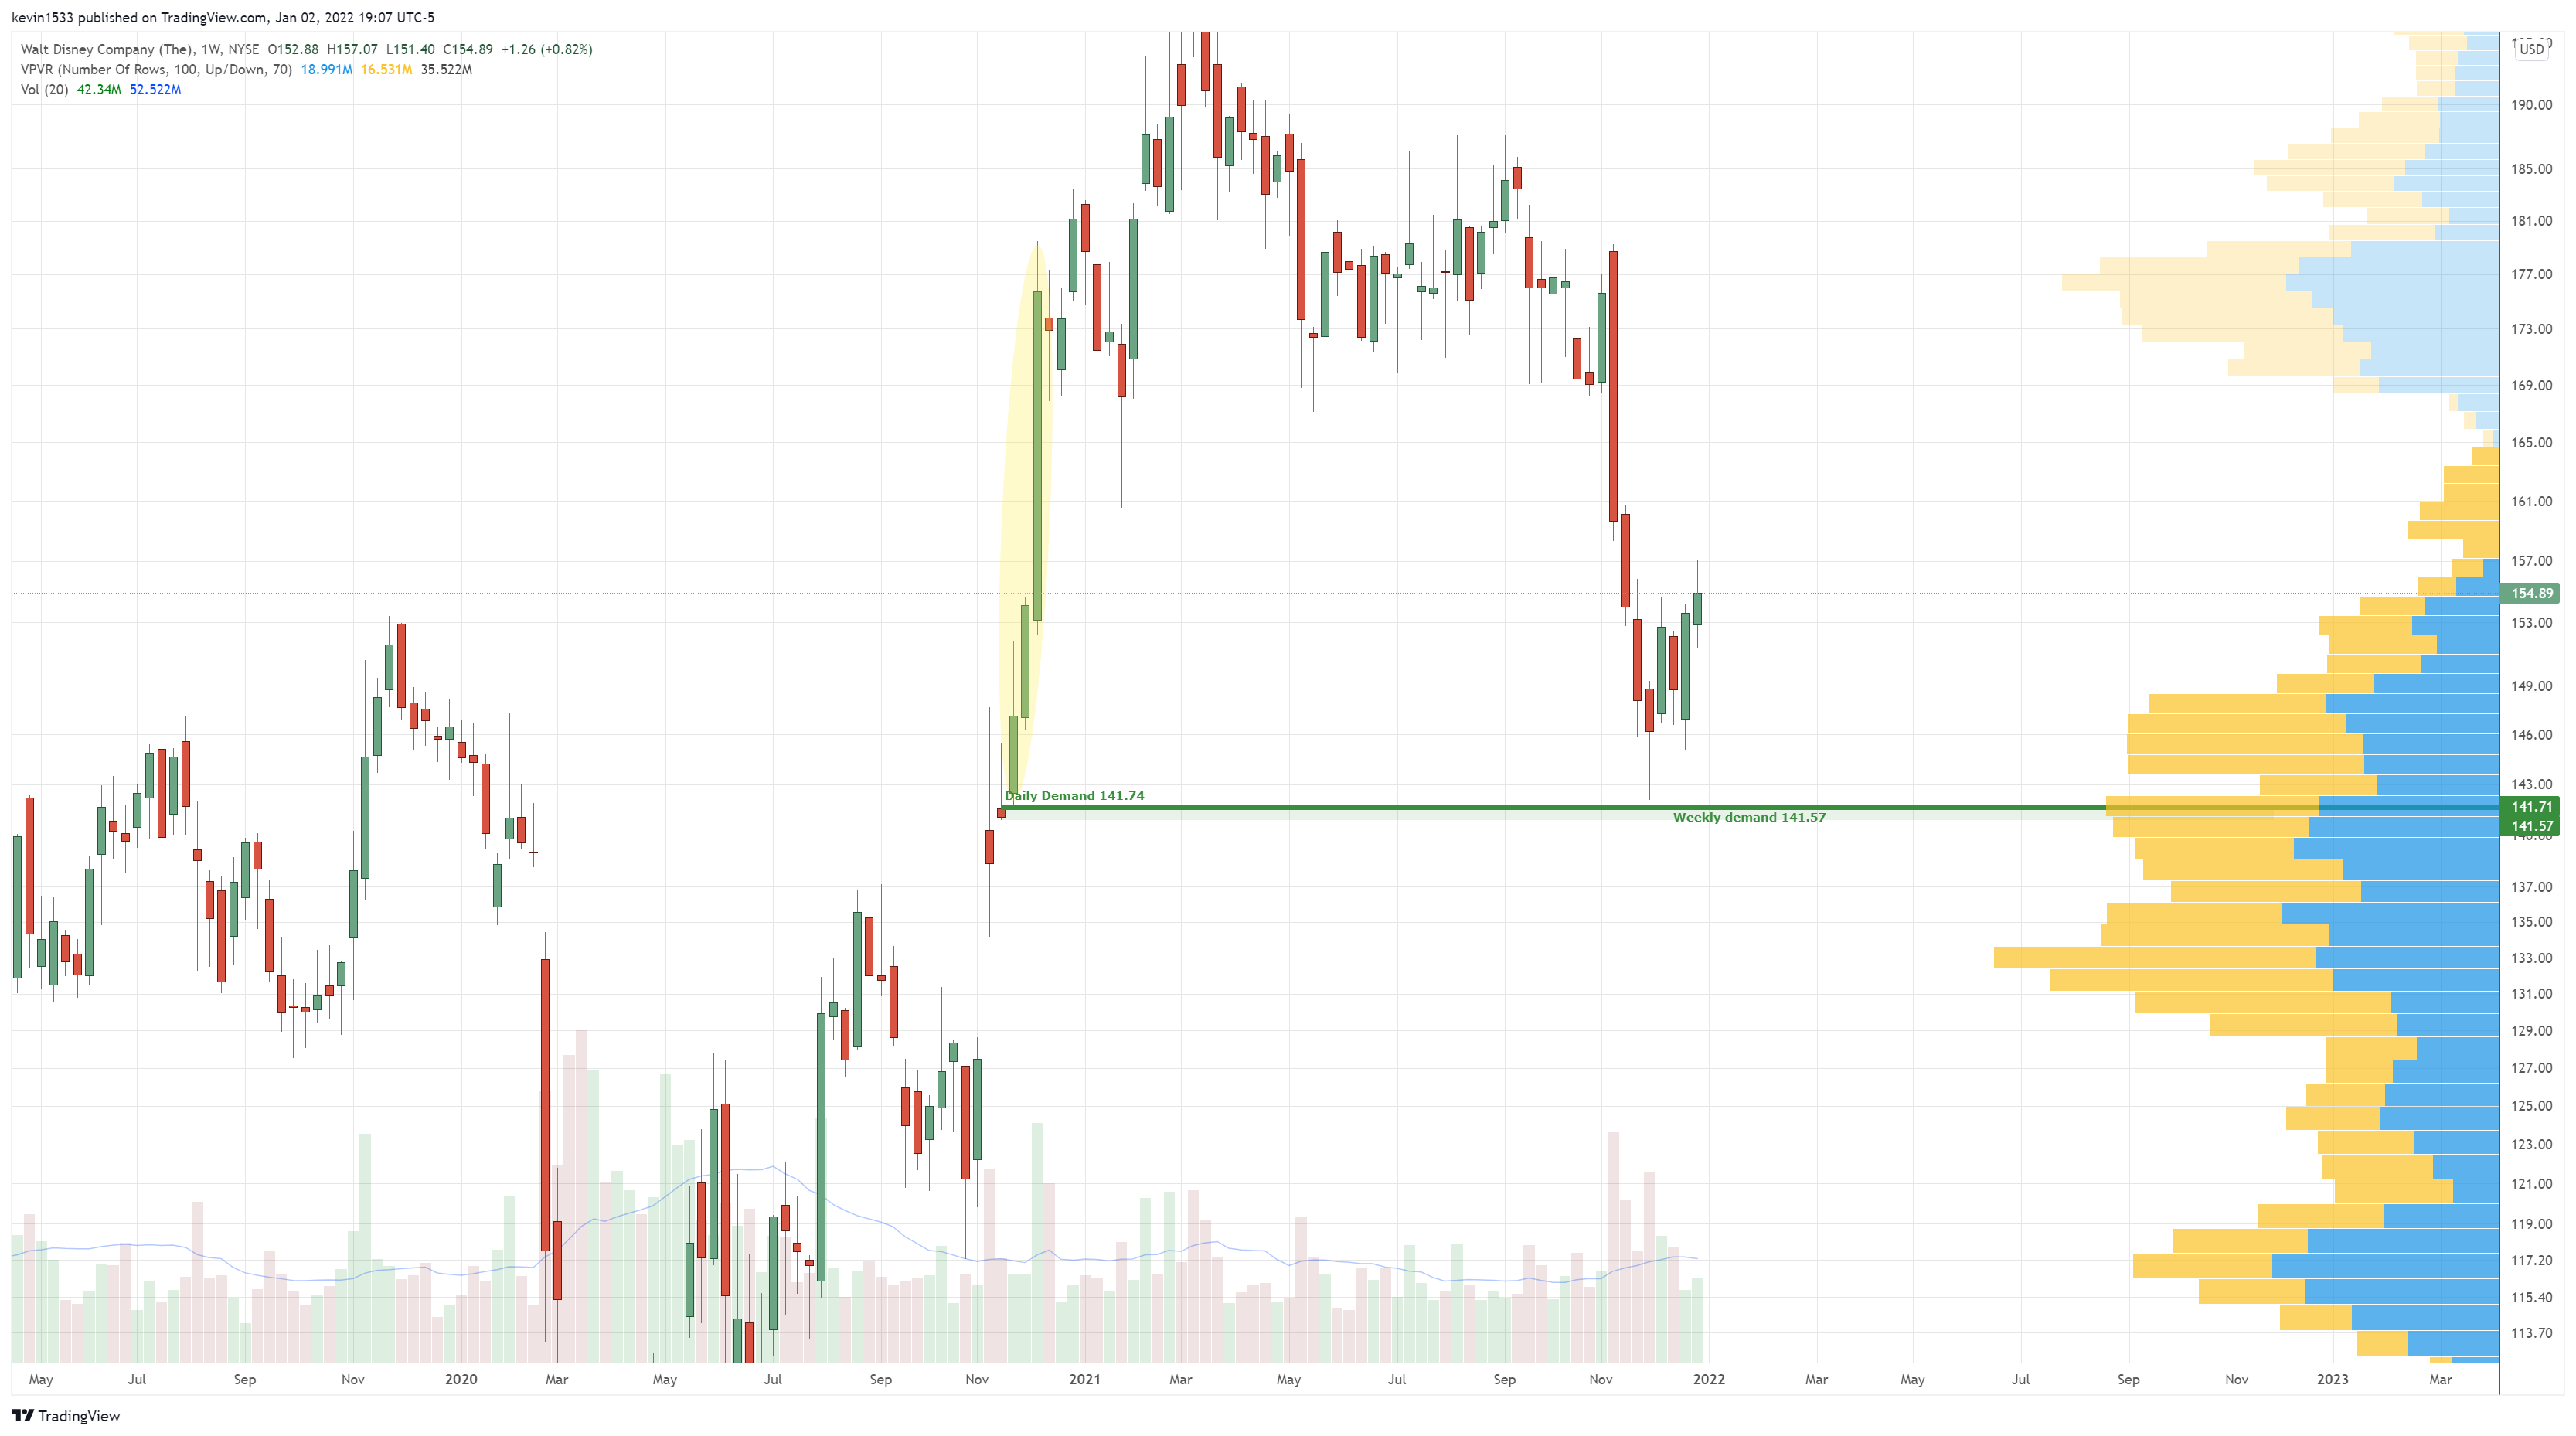
$DIS (weekly) long setup at 141.57-141.74
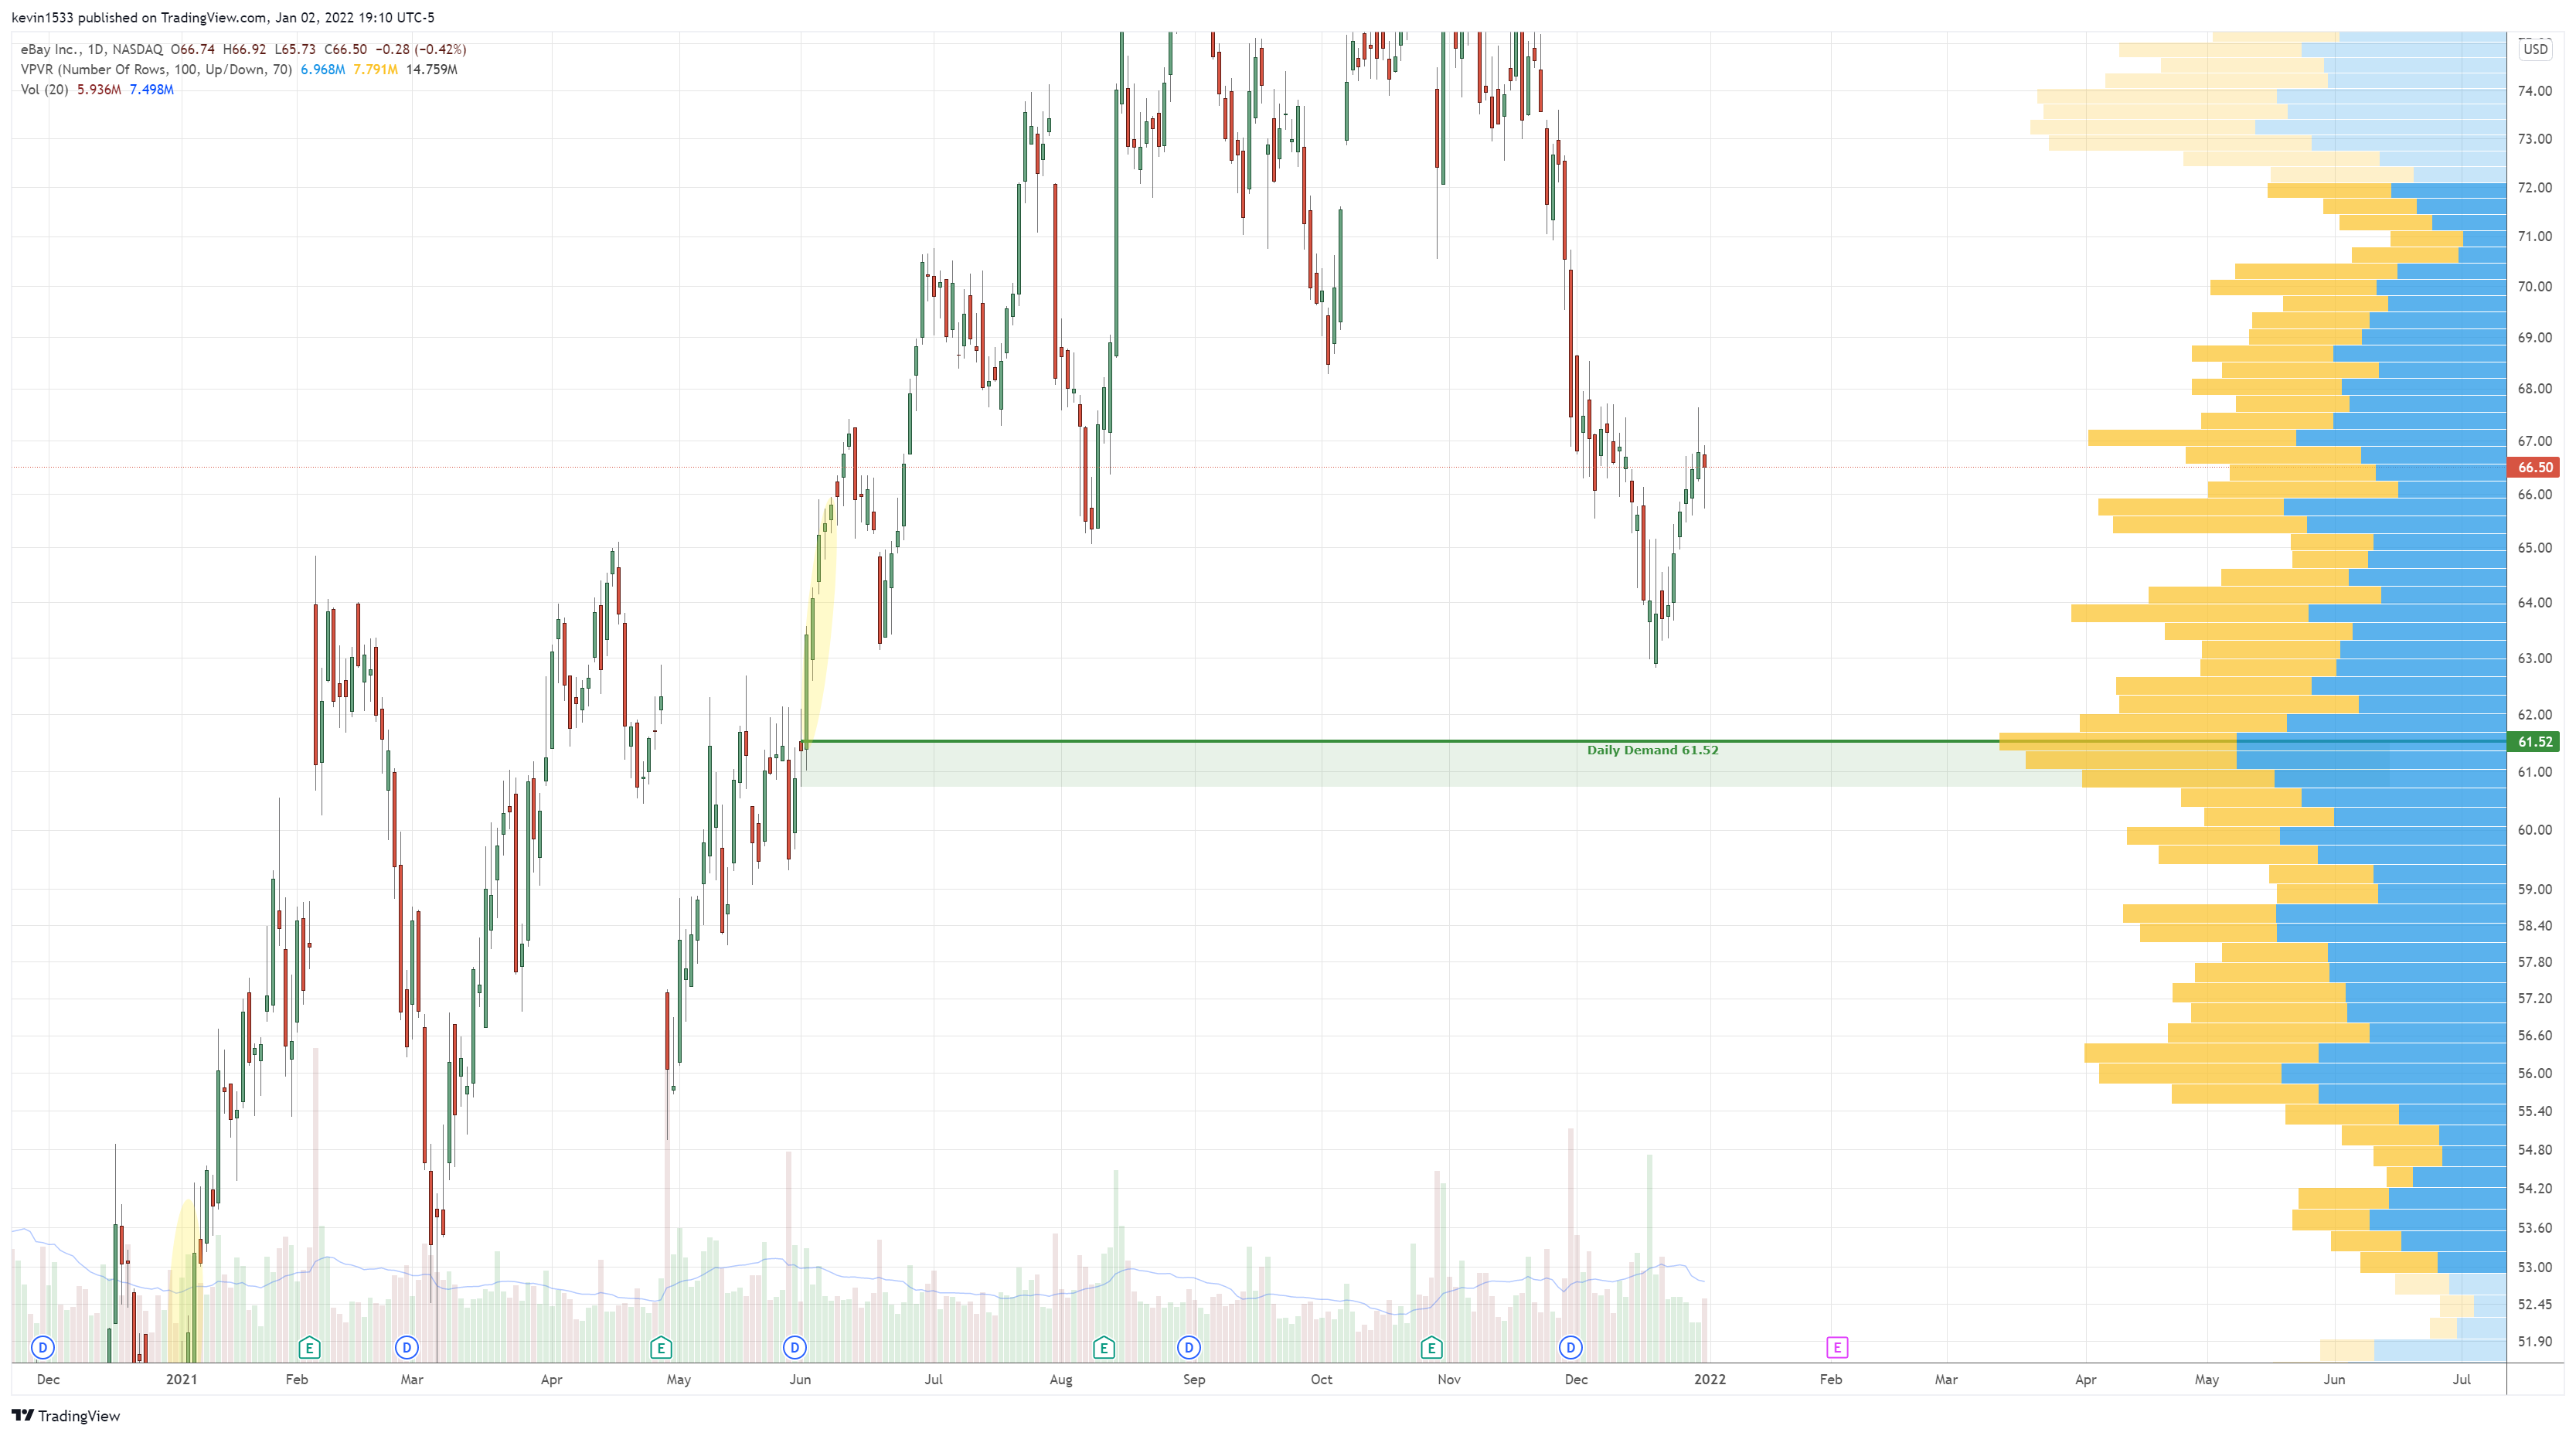
$EBAY (daily) long setup at 61.52
$FB (daily ) long setup at 290.45-289.83 and 281

$GM (daily) long setup at 49.57

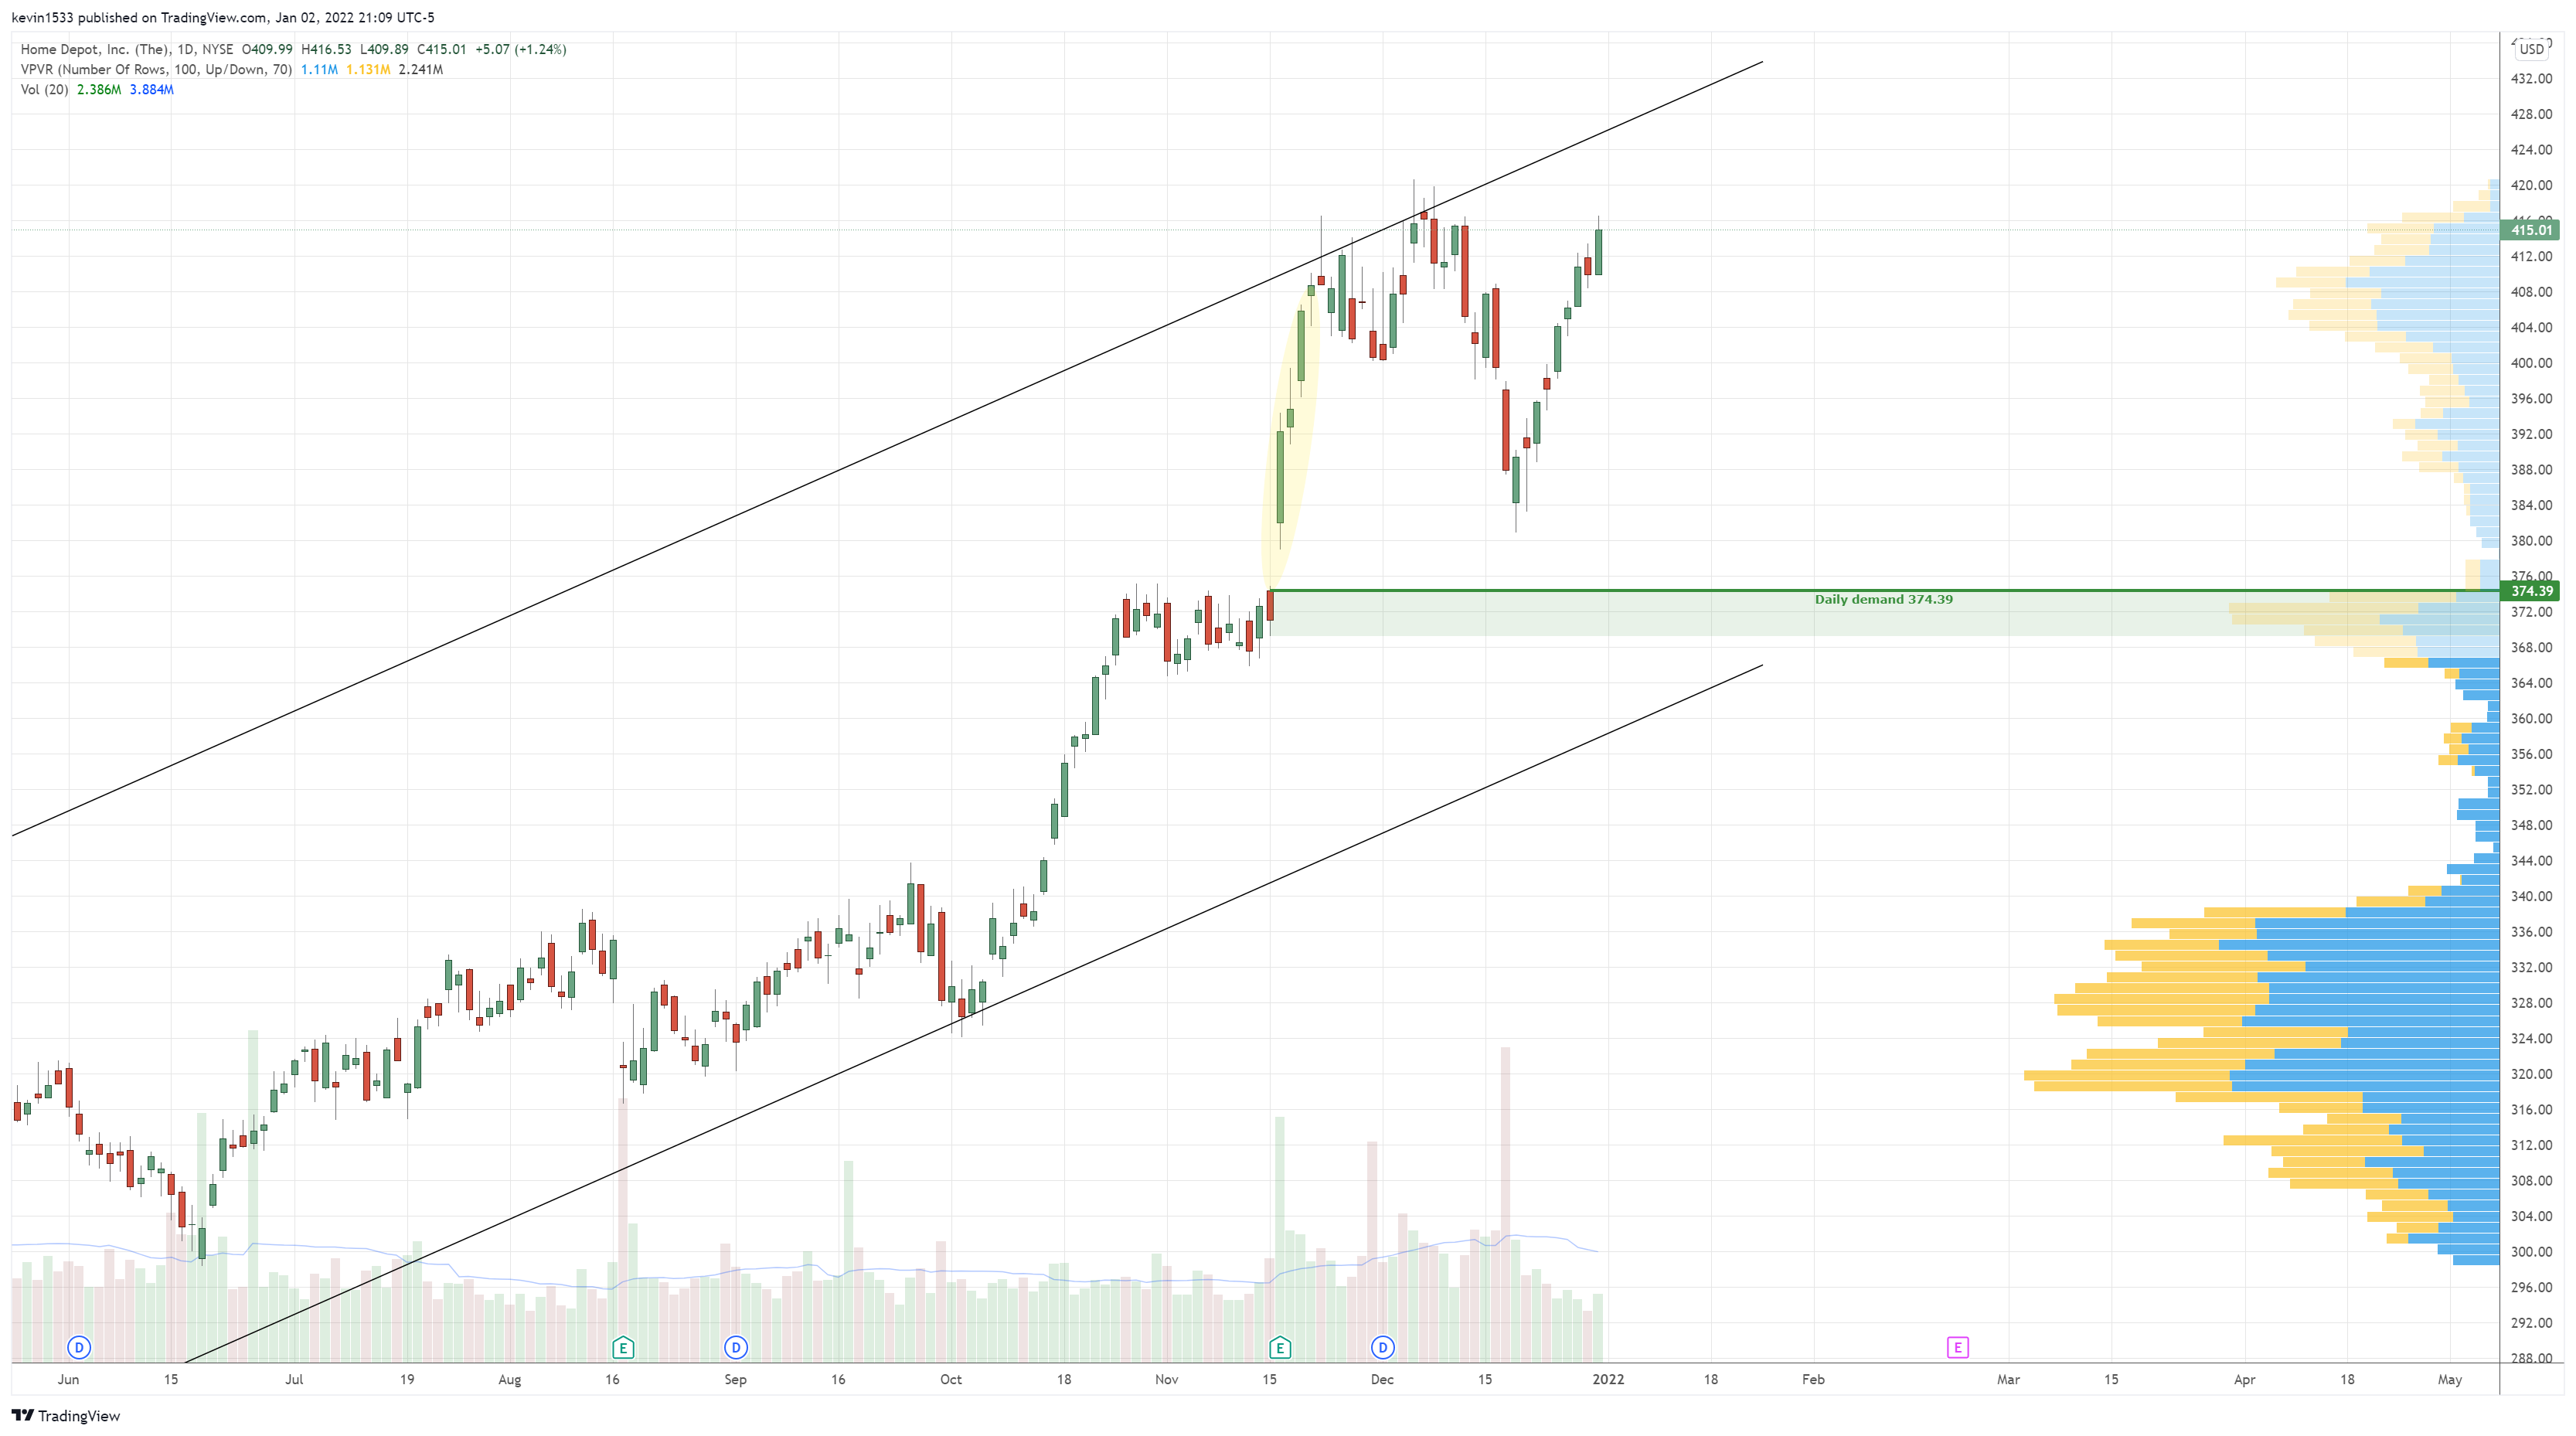
$HD (daily) long setup at 374.39
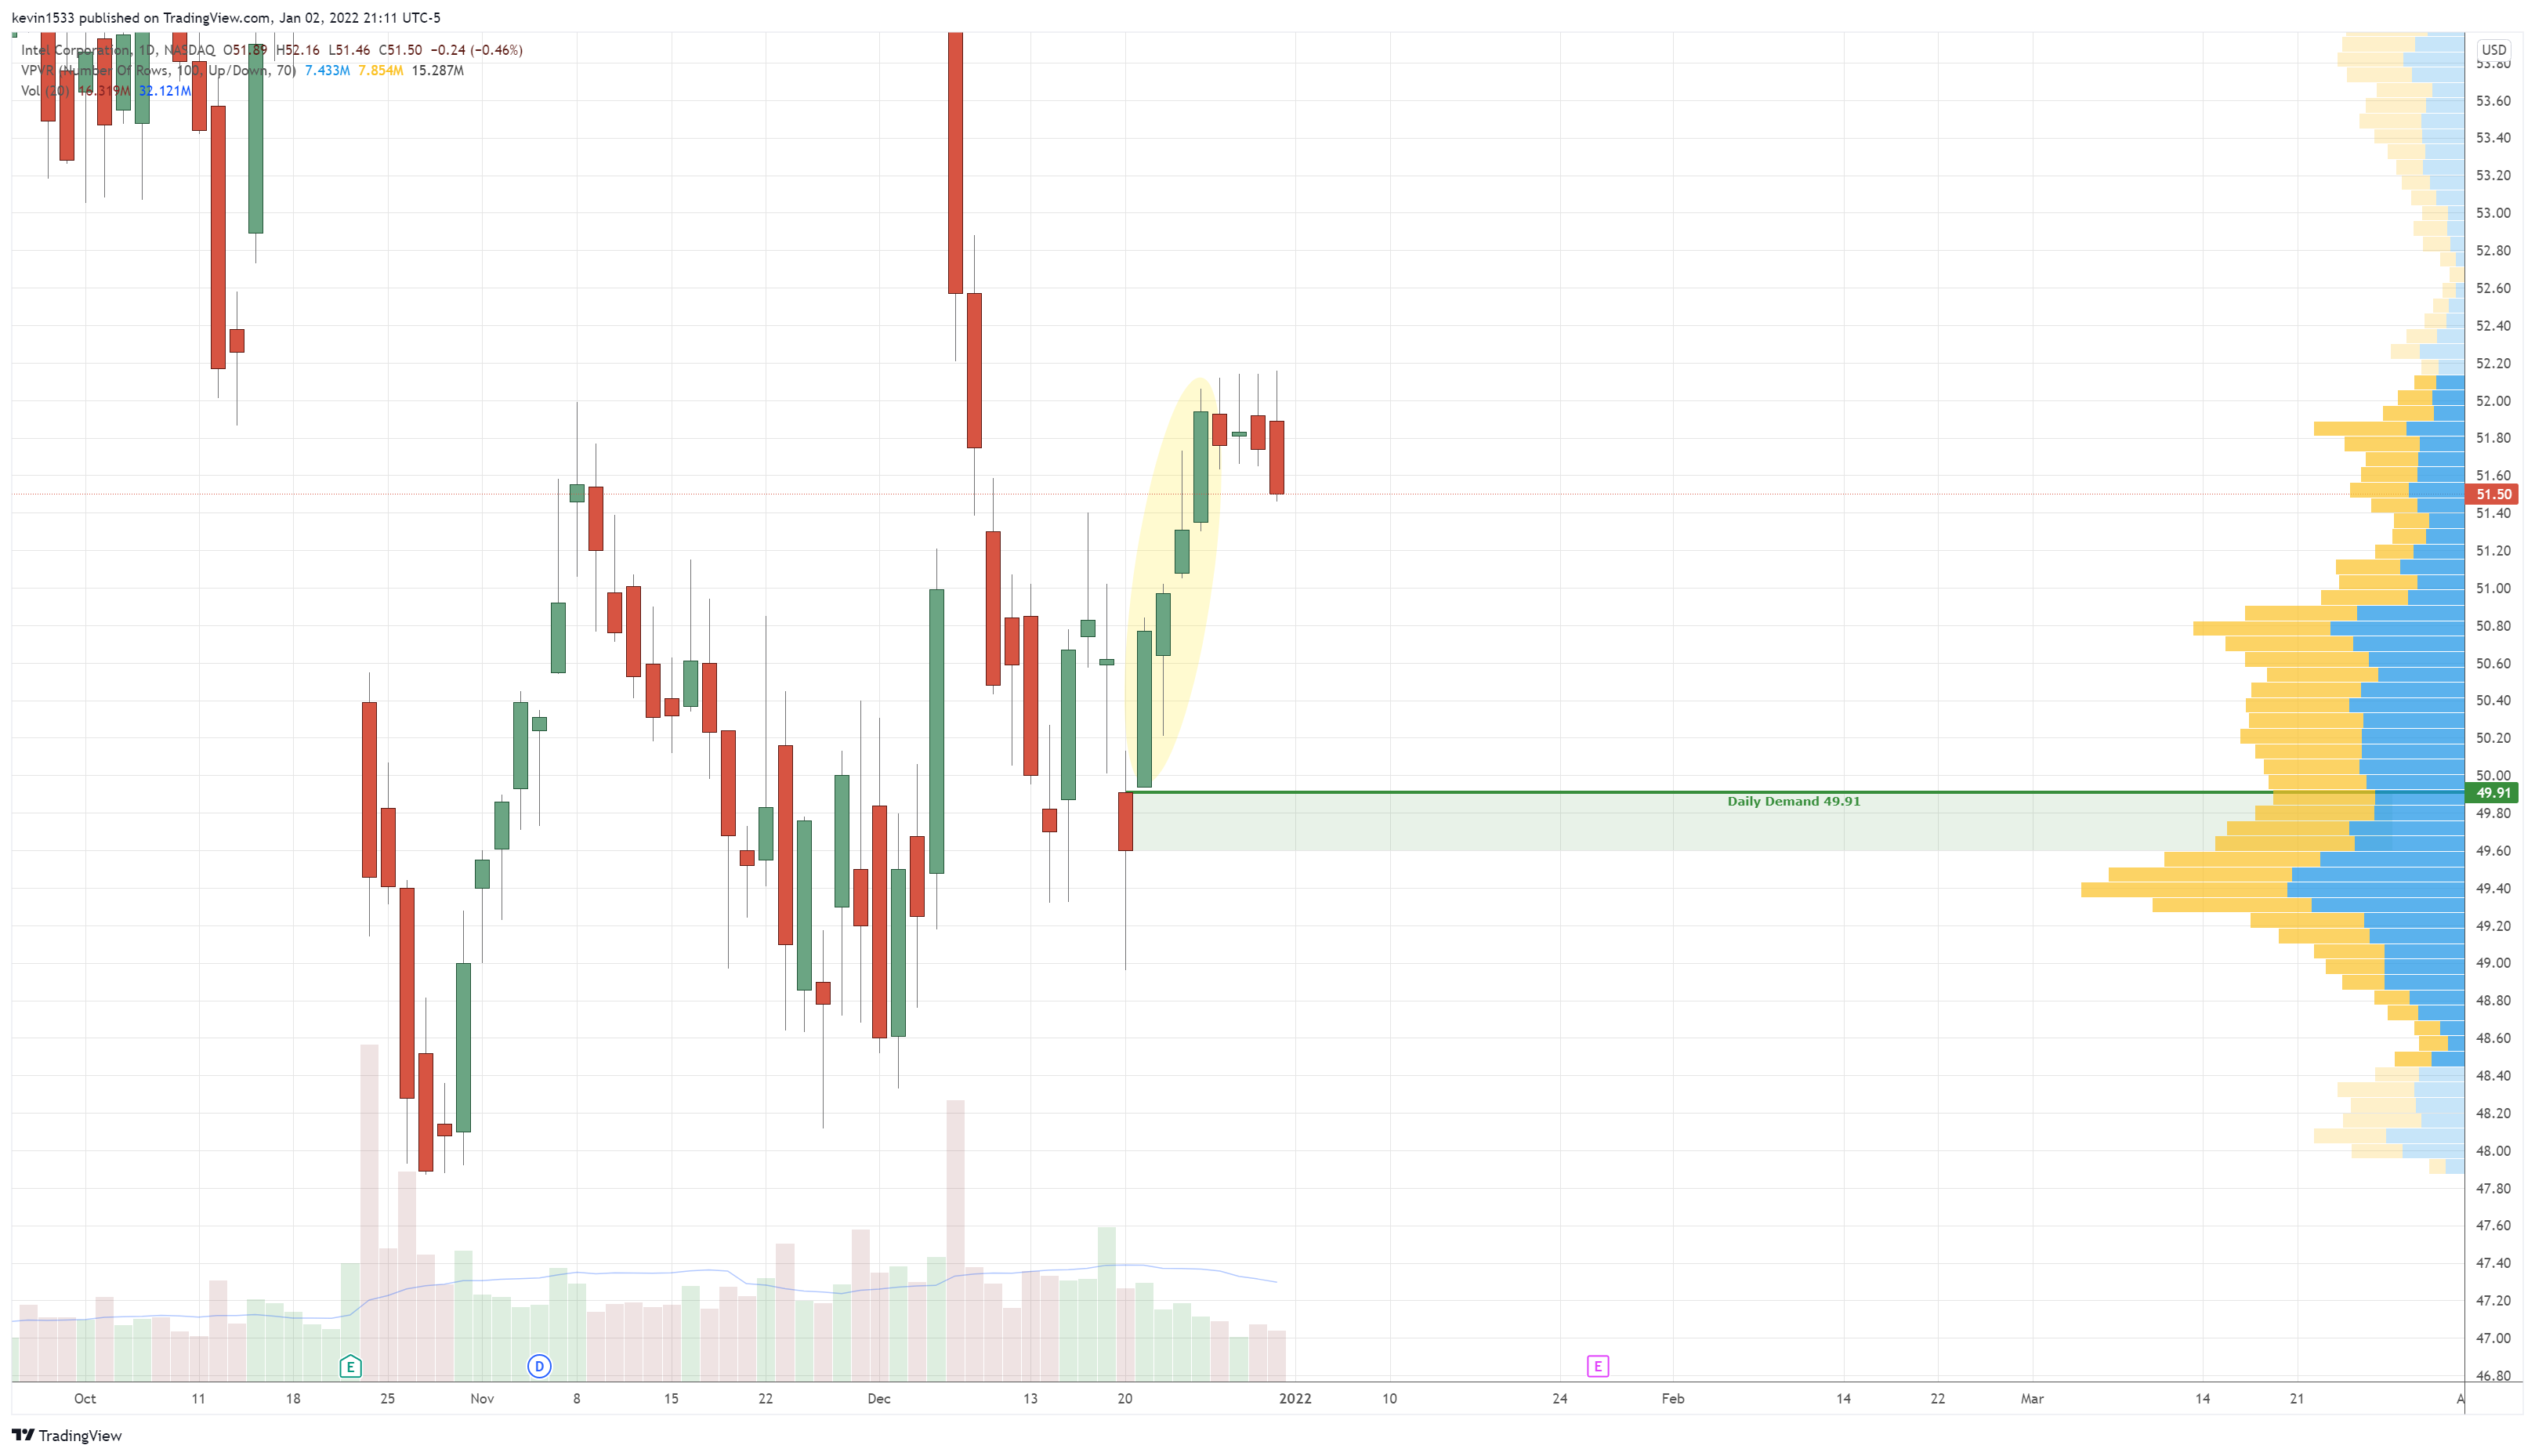
$INTC (daily) Long setup at 49.91
$JMIA (daily) long setup at 8.11

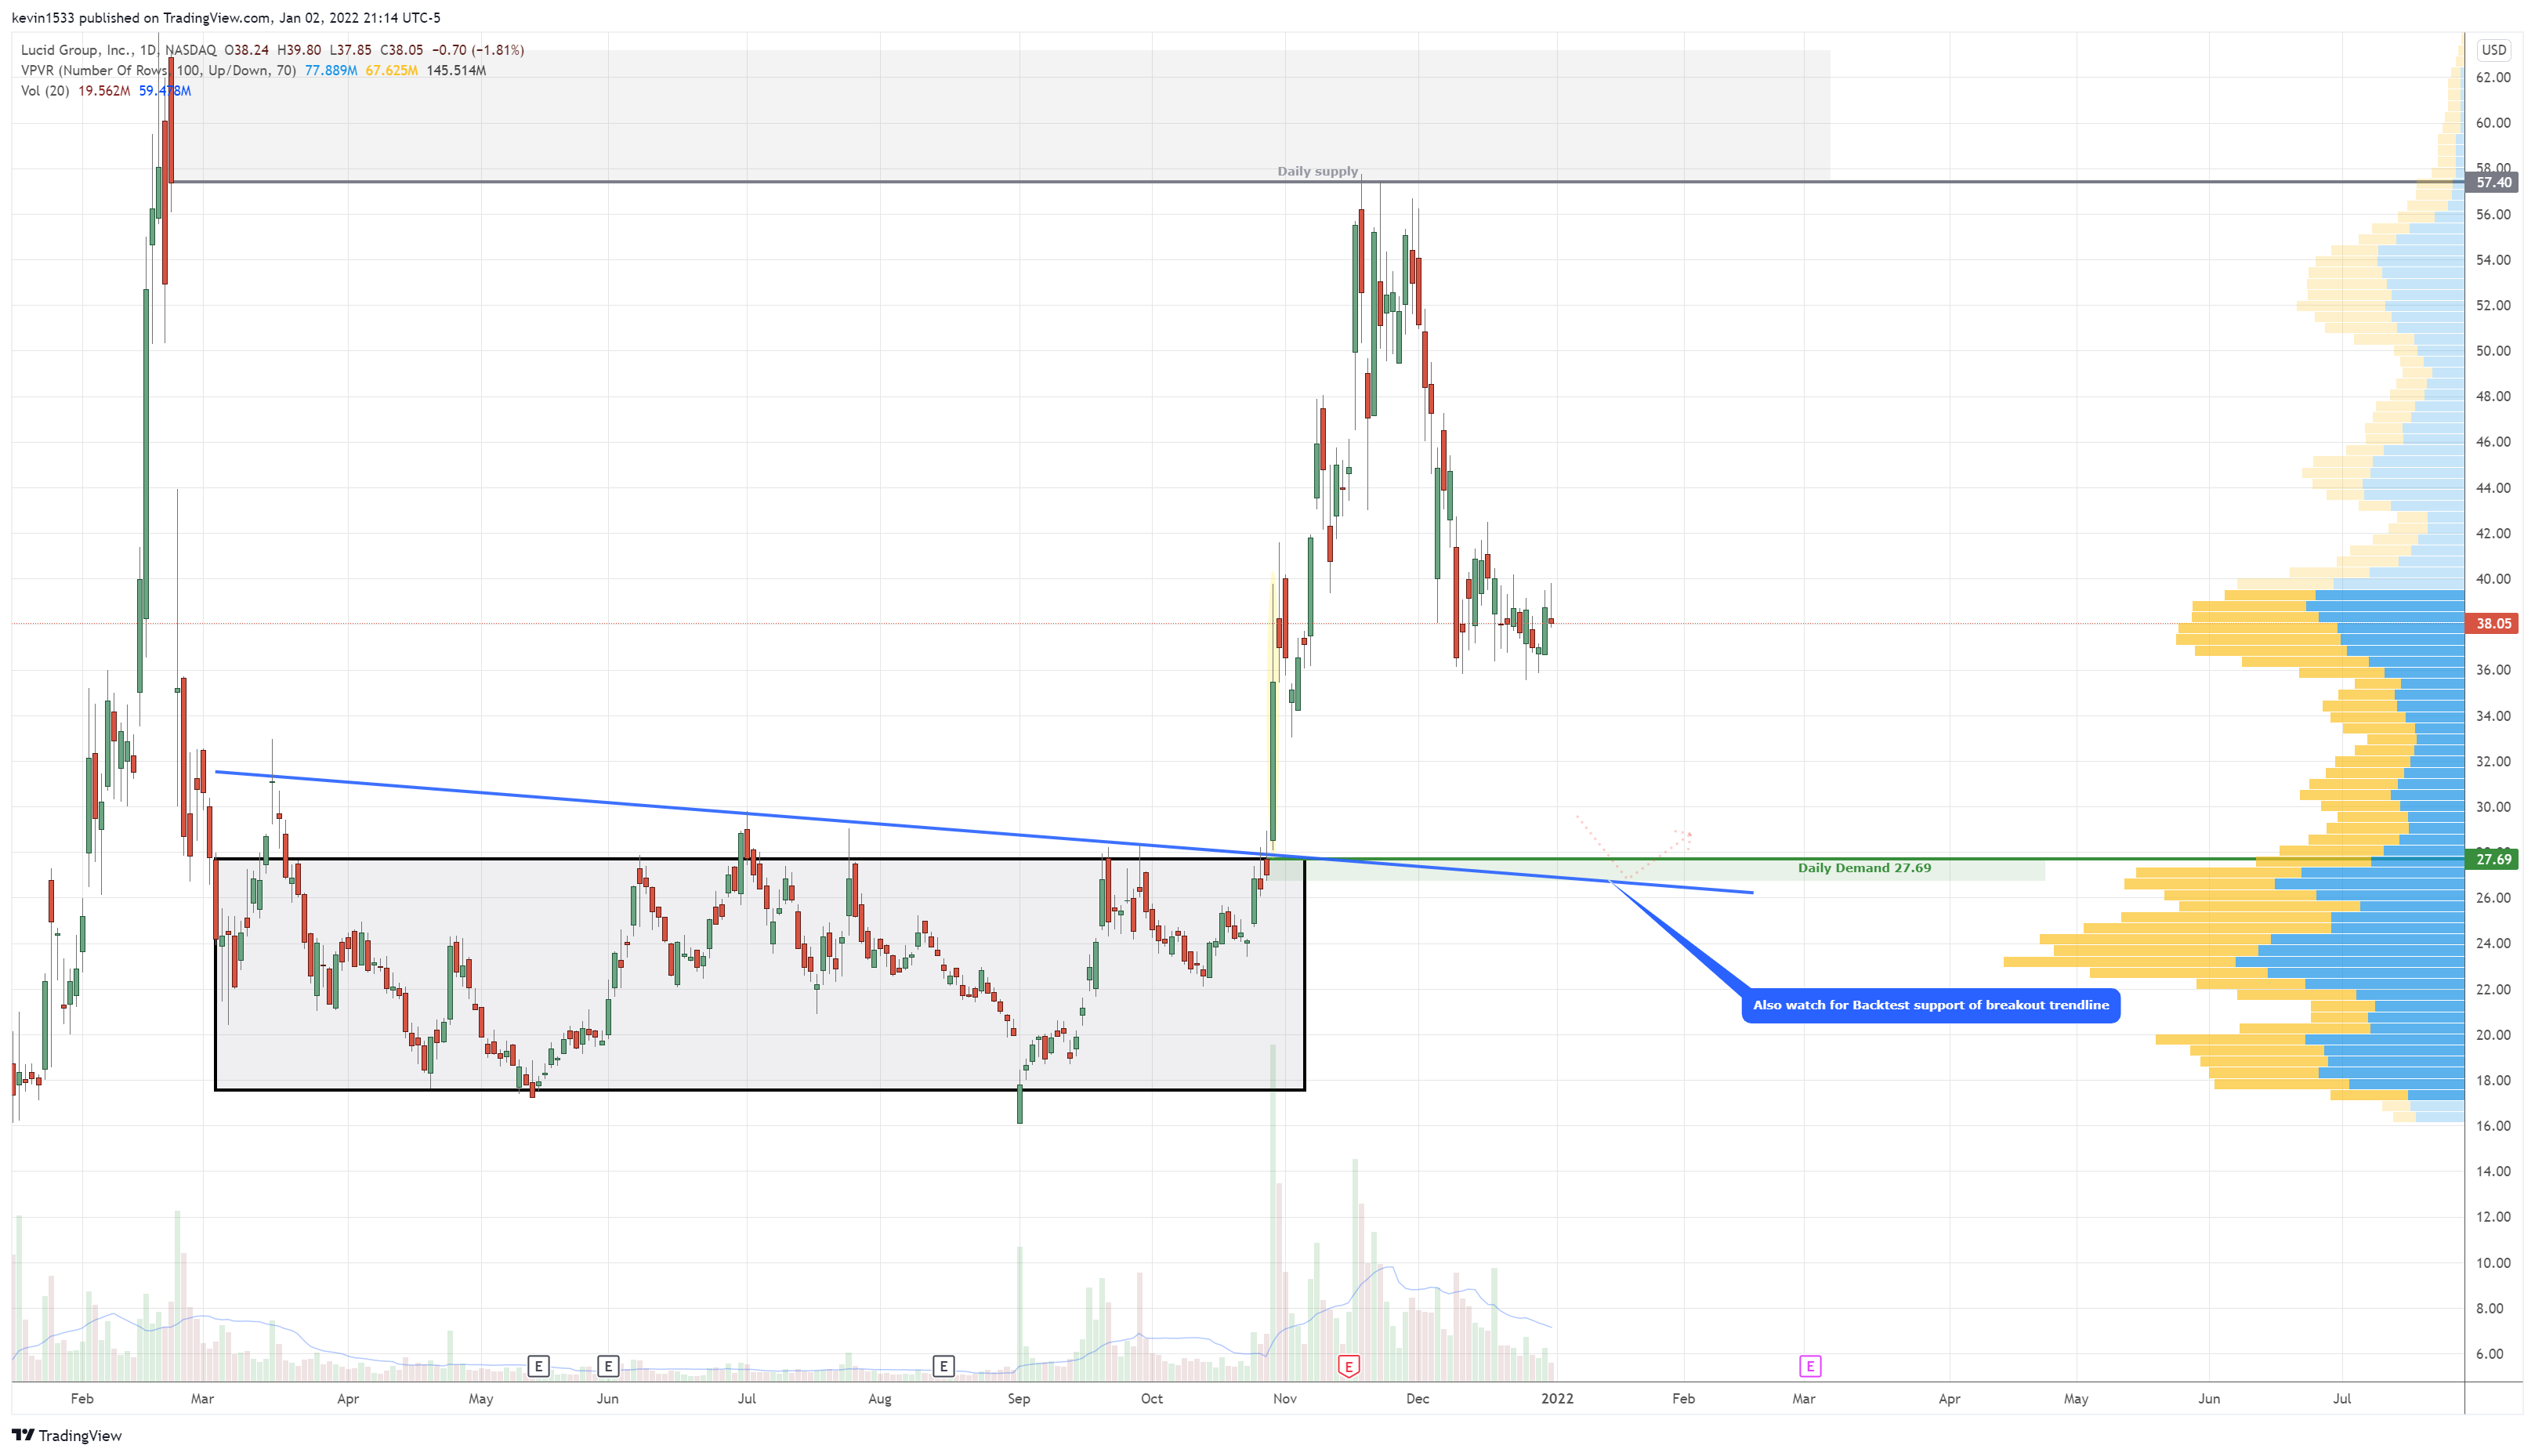
$LCID (daily) long setup at 27.69
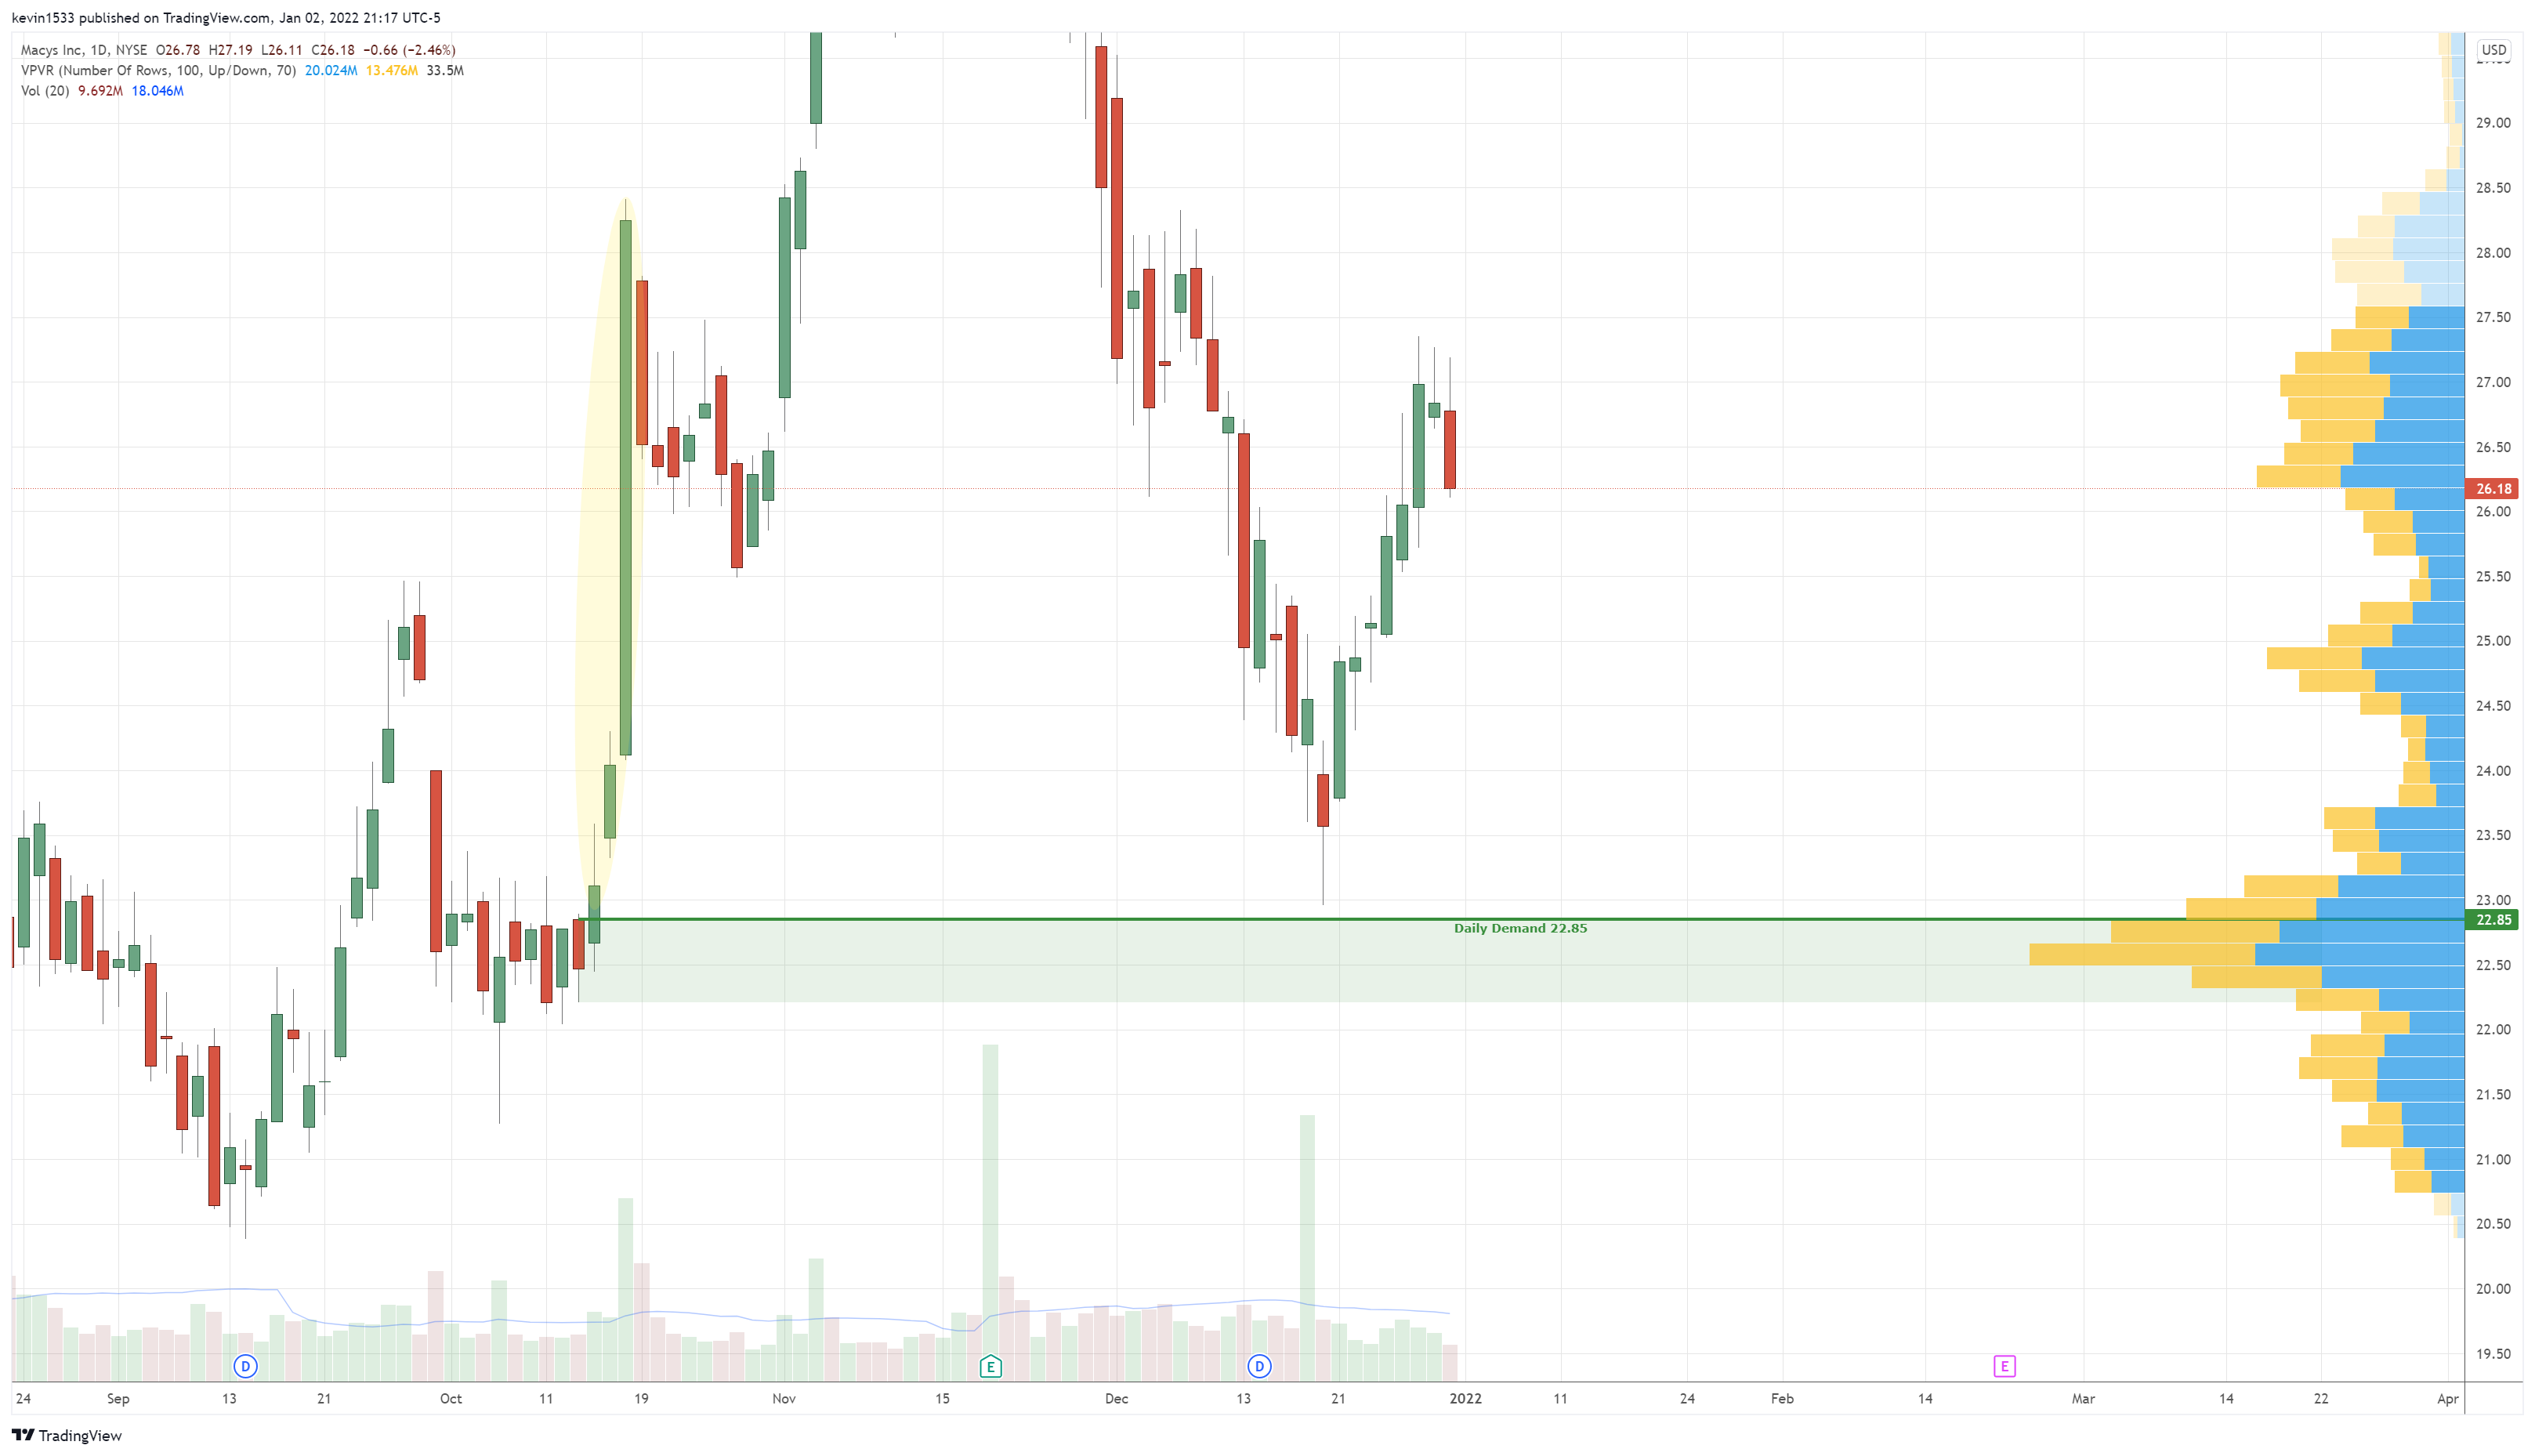
$M (daily) long setup at 22.85
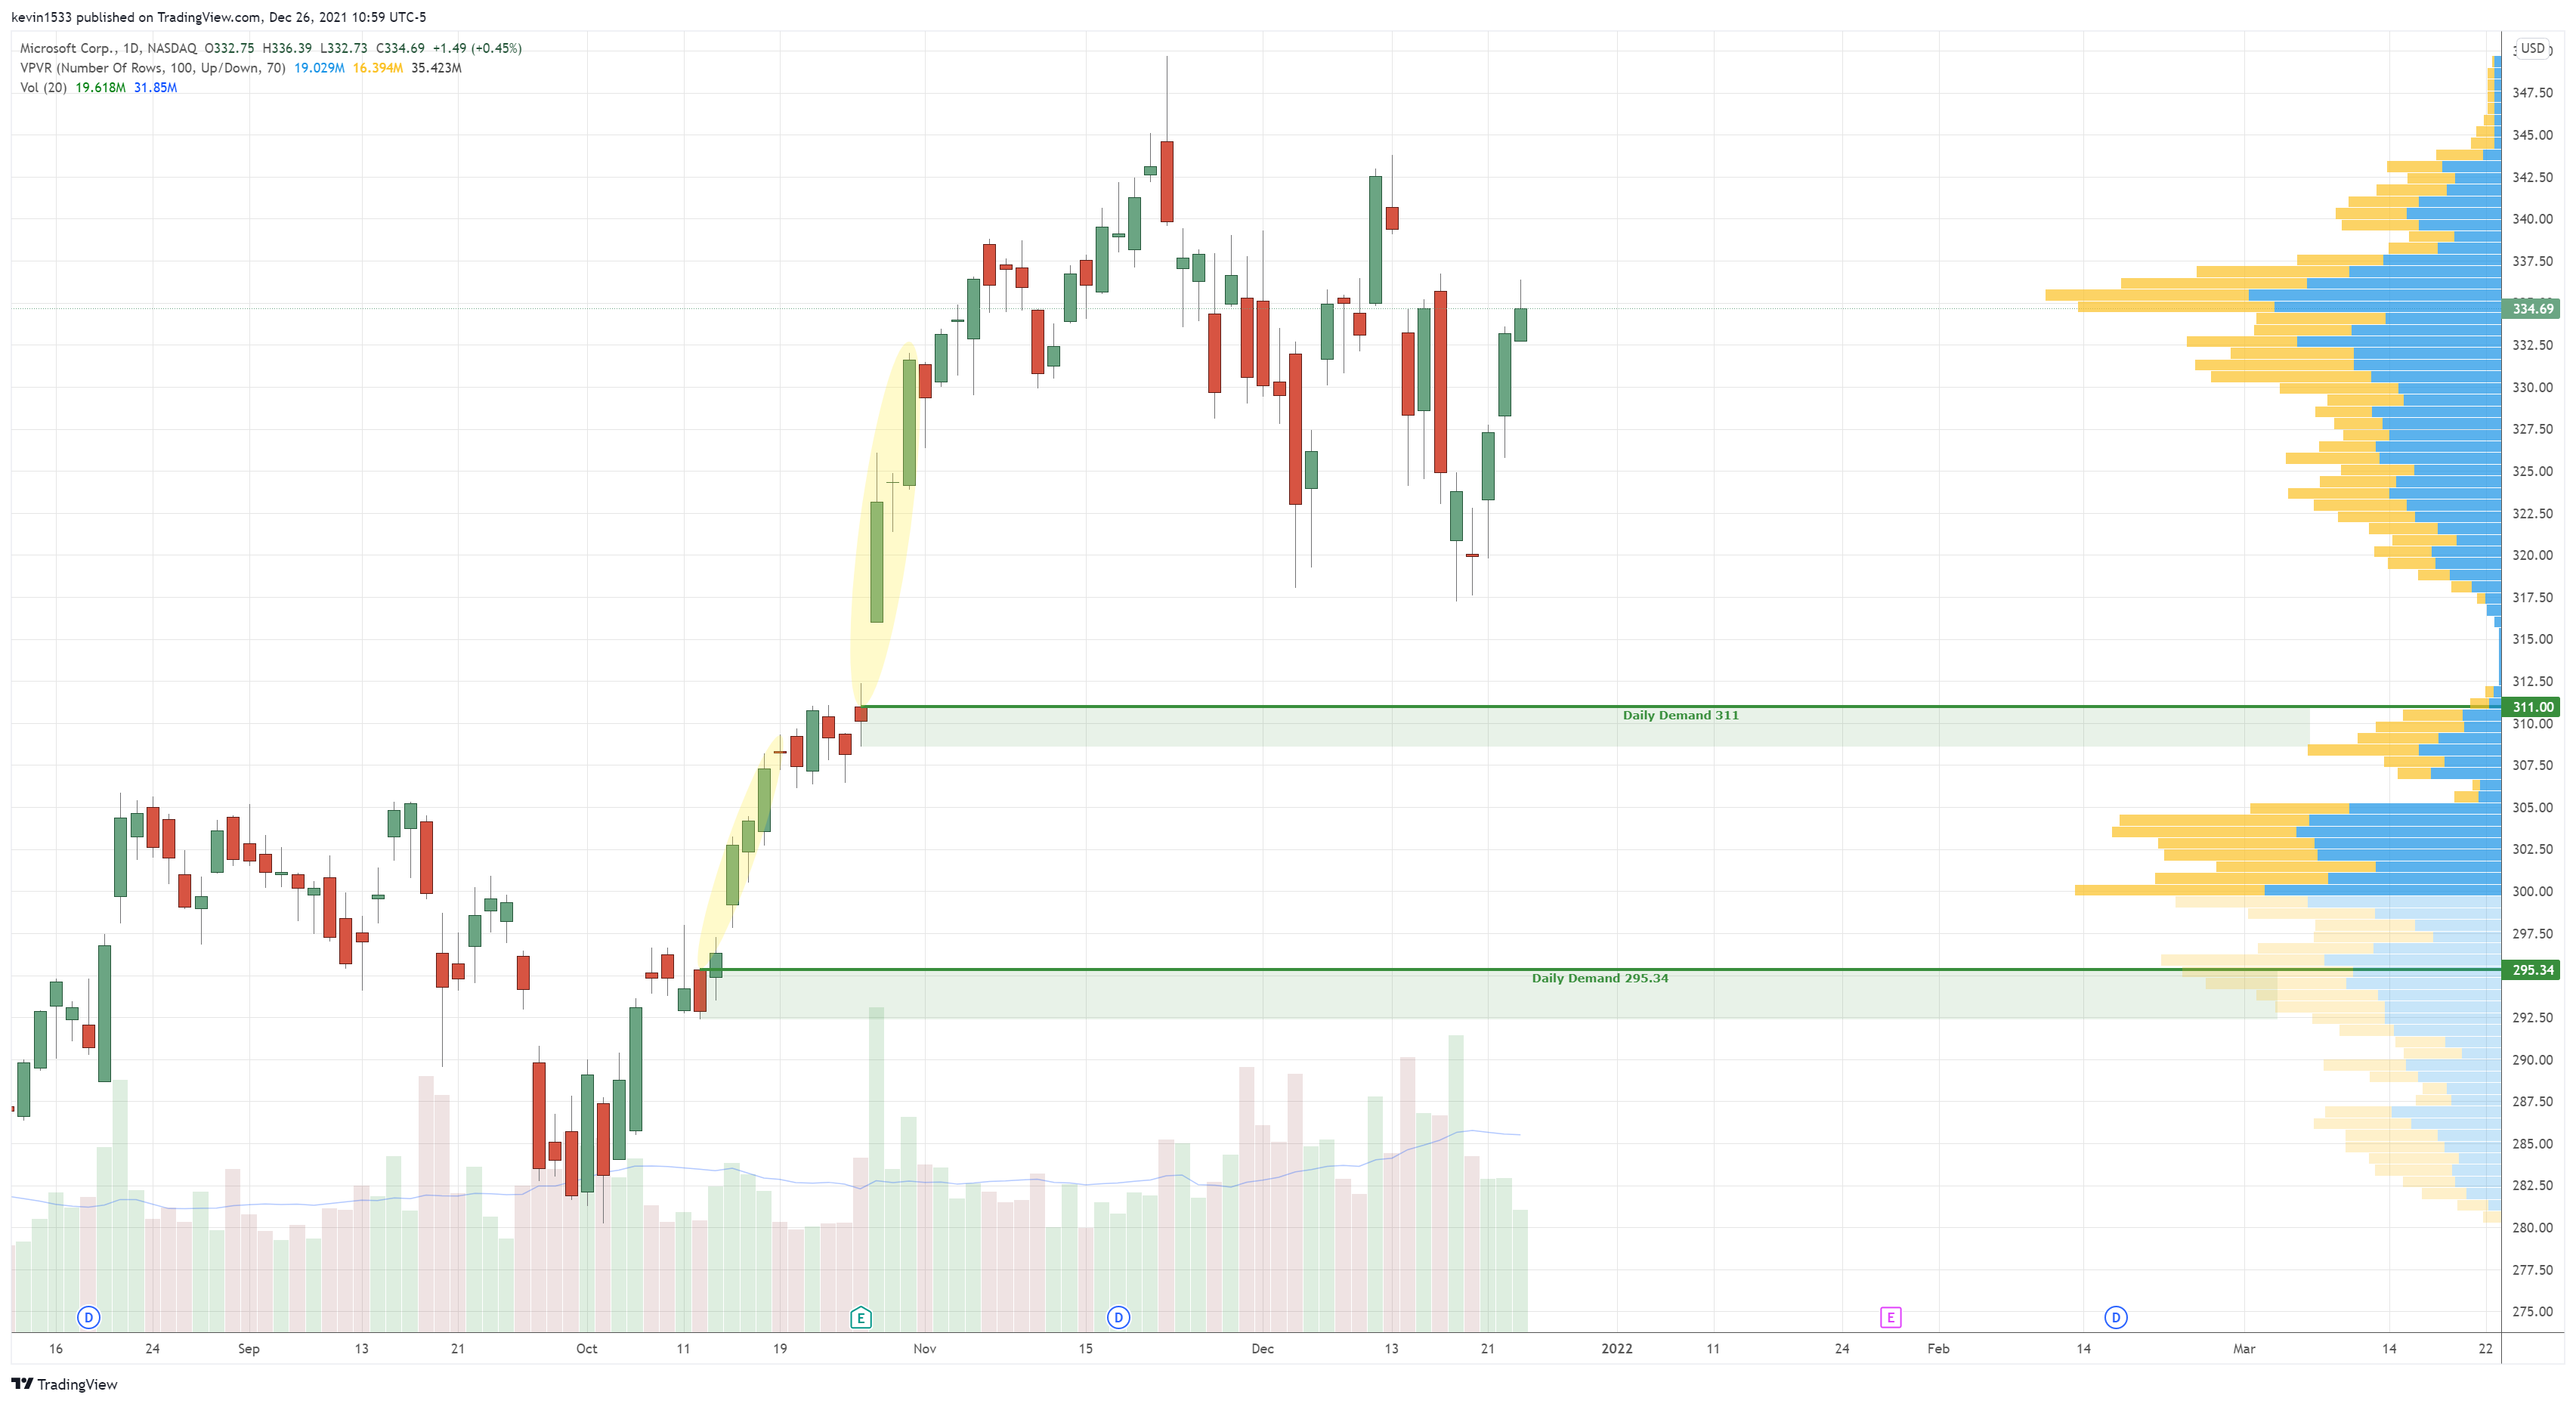
$MSFT (daily) long setup at 311 and 295.34
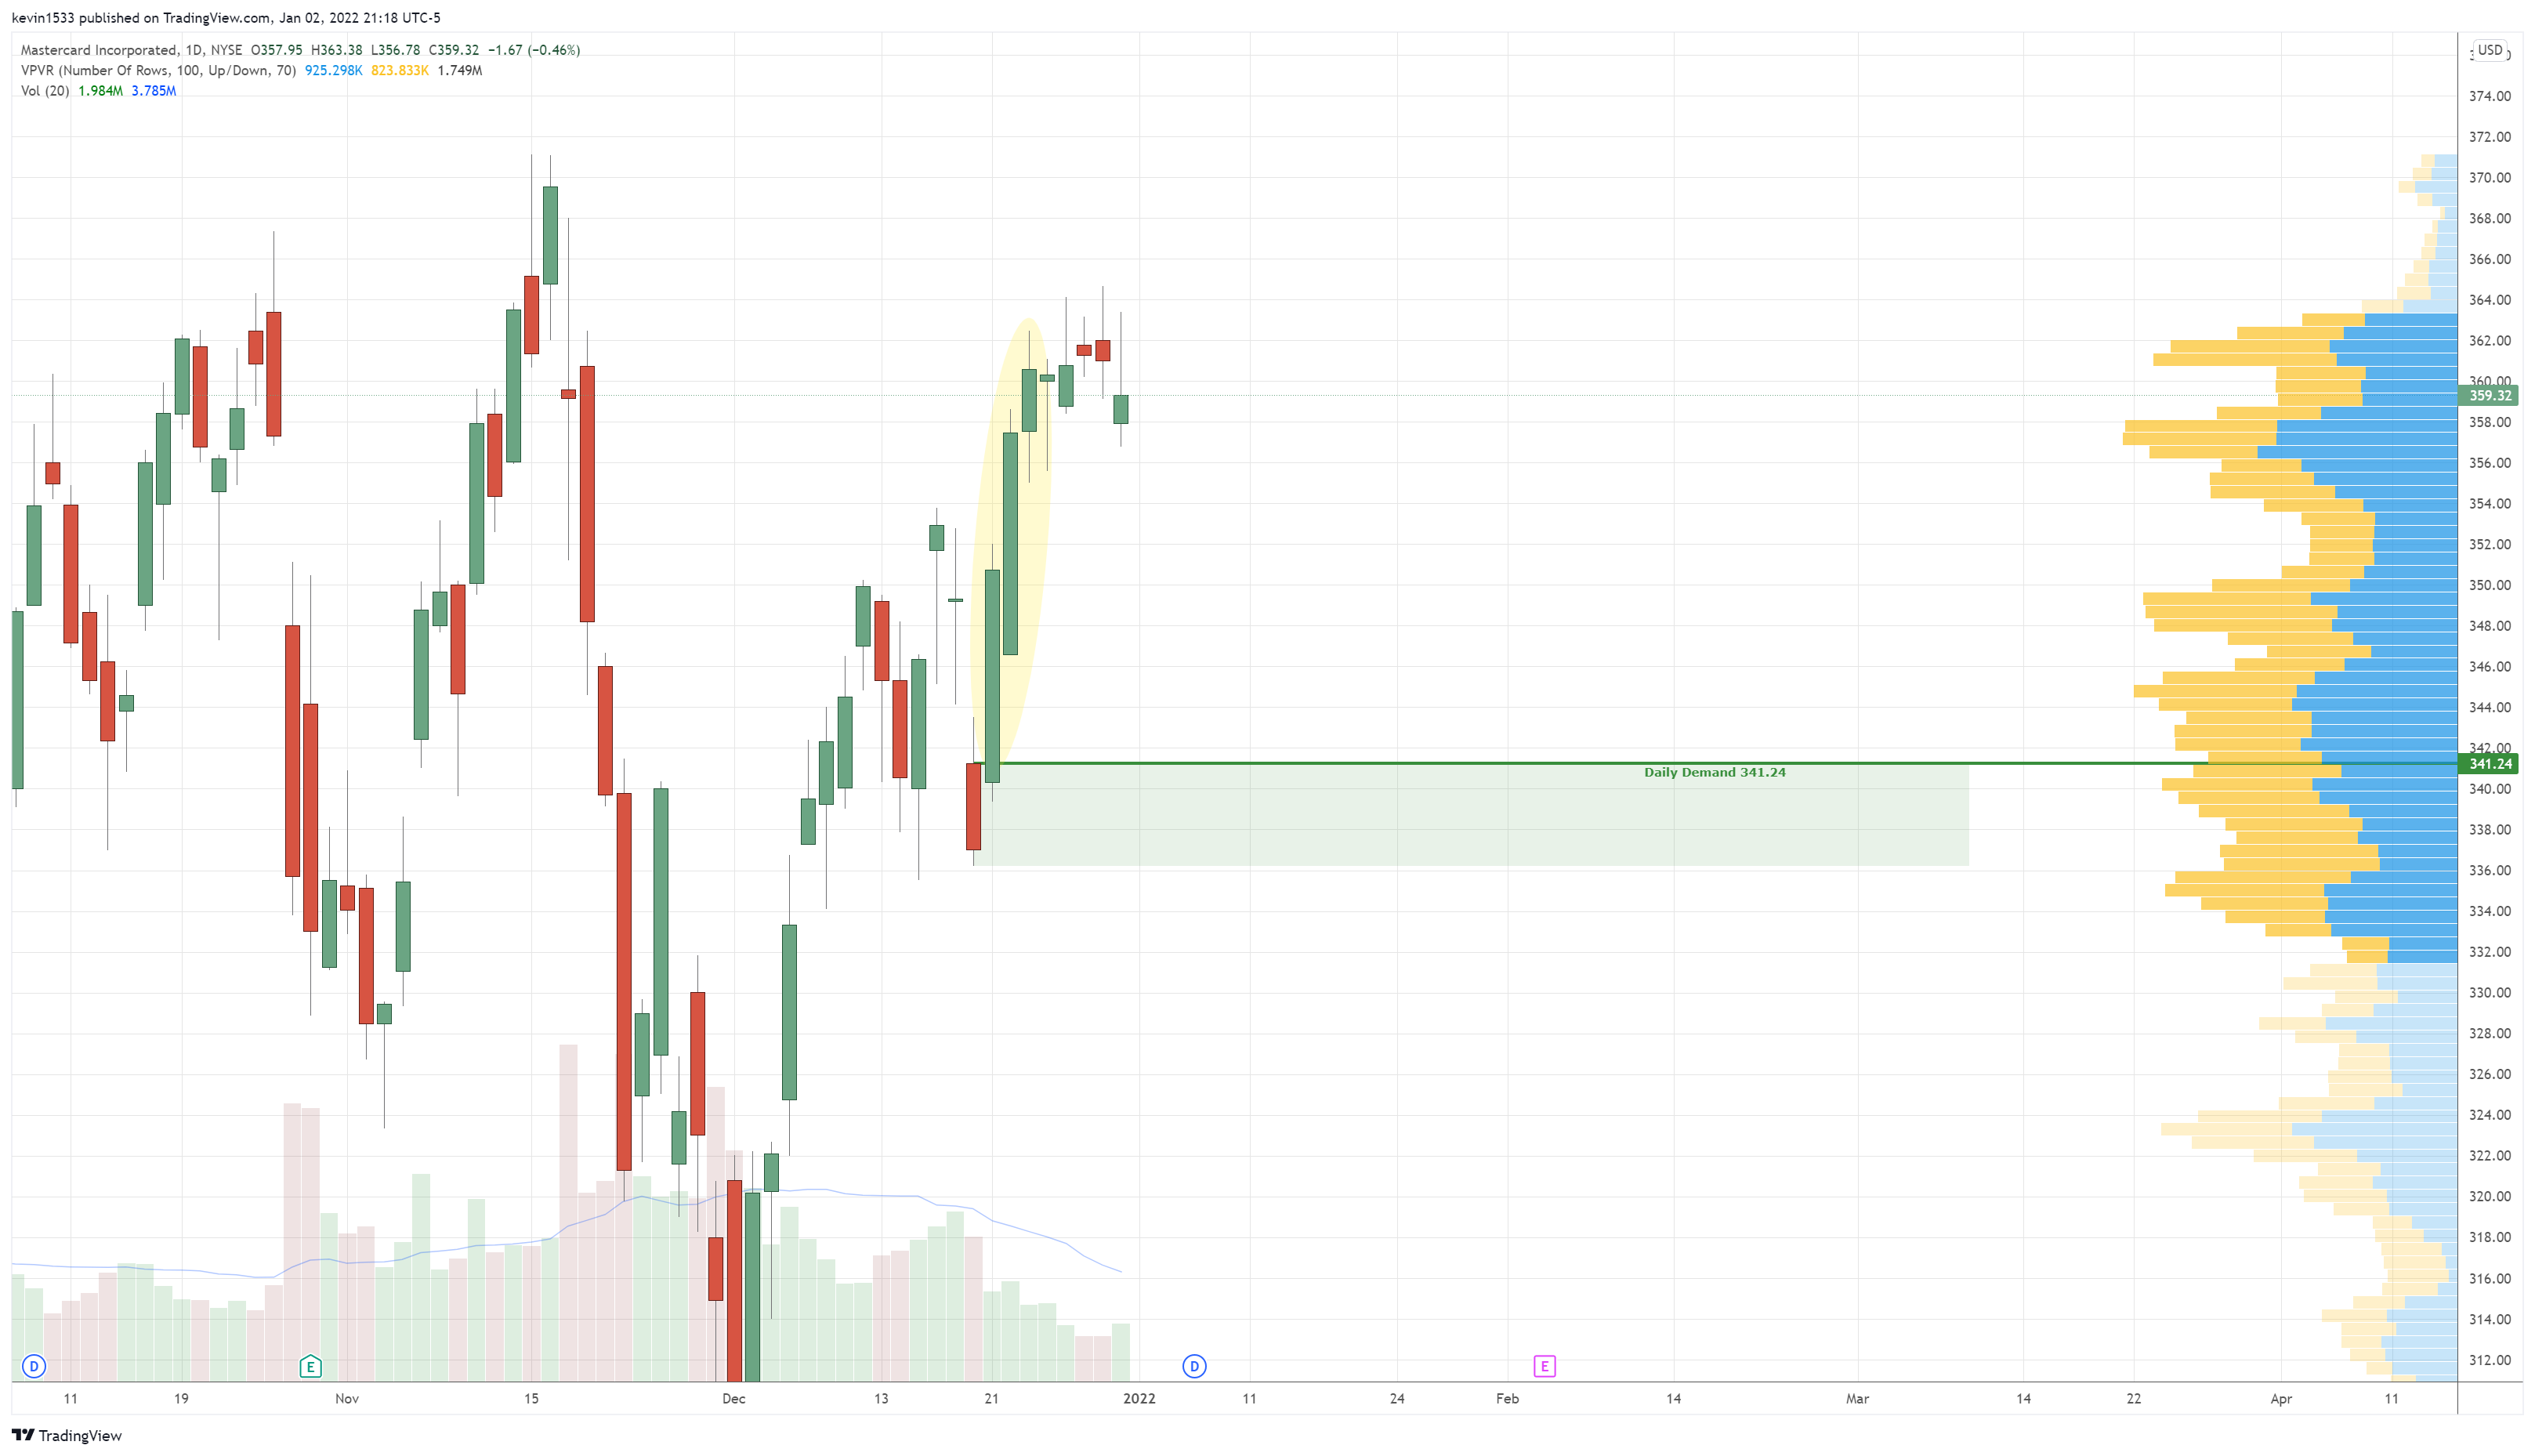
$MA (daily) long setup at 341.24
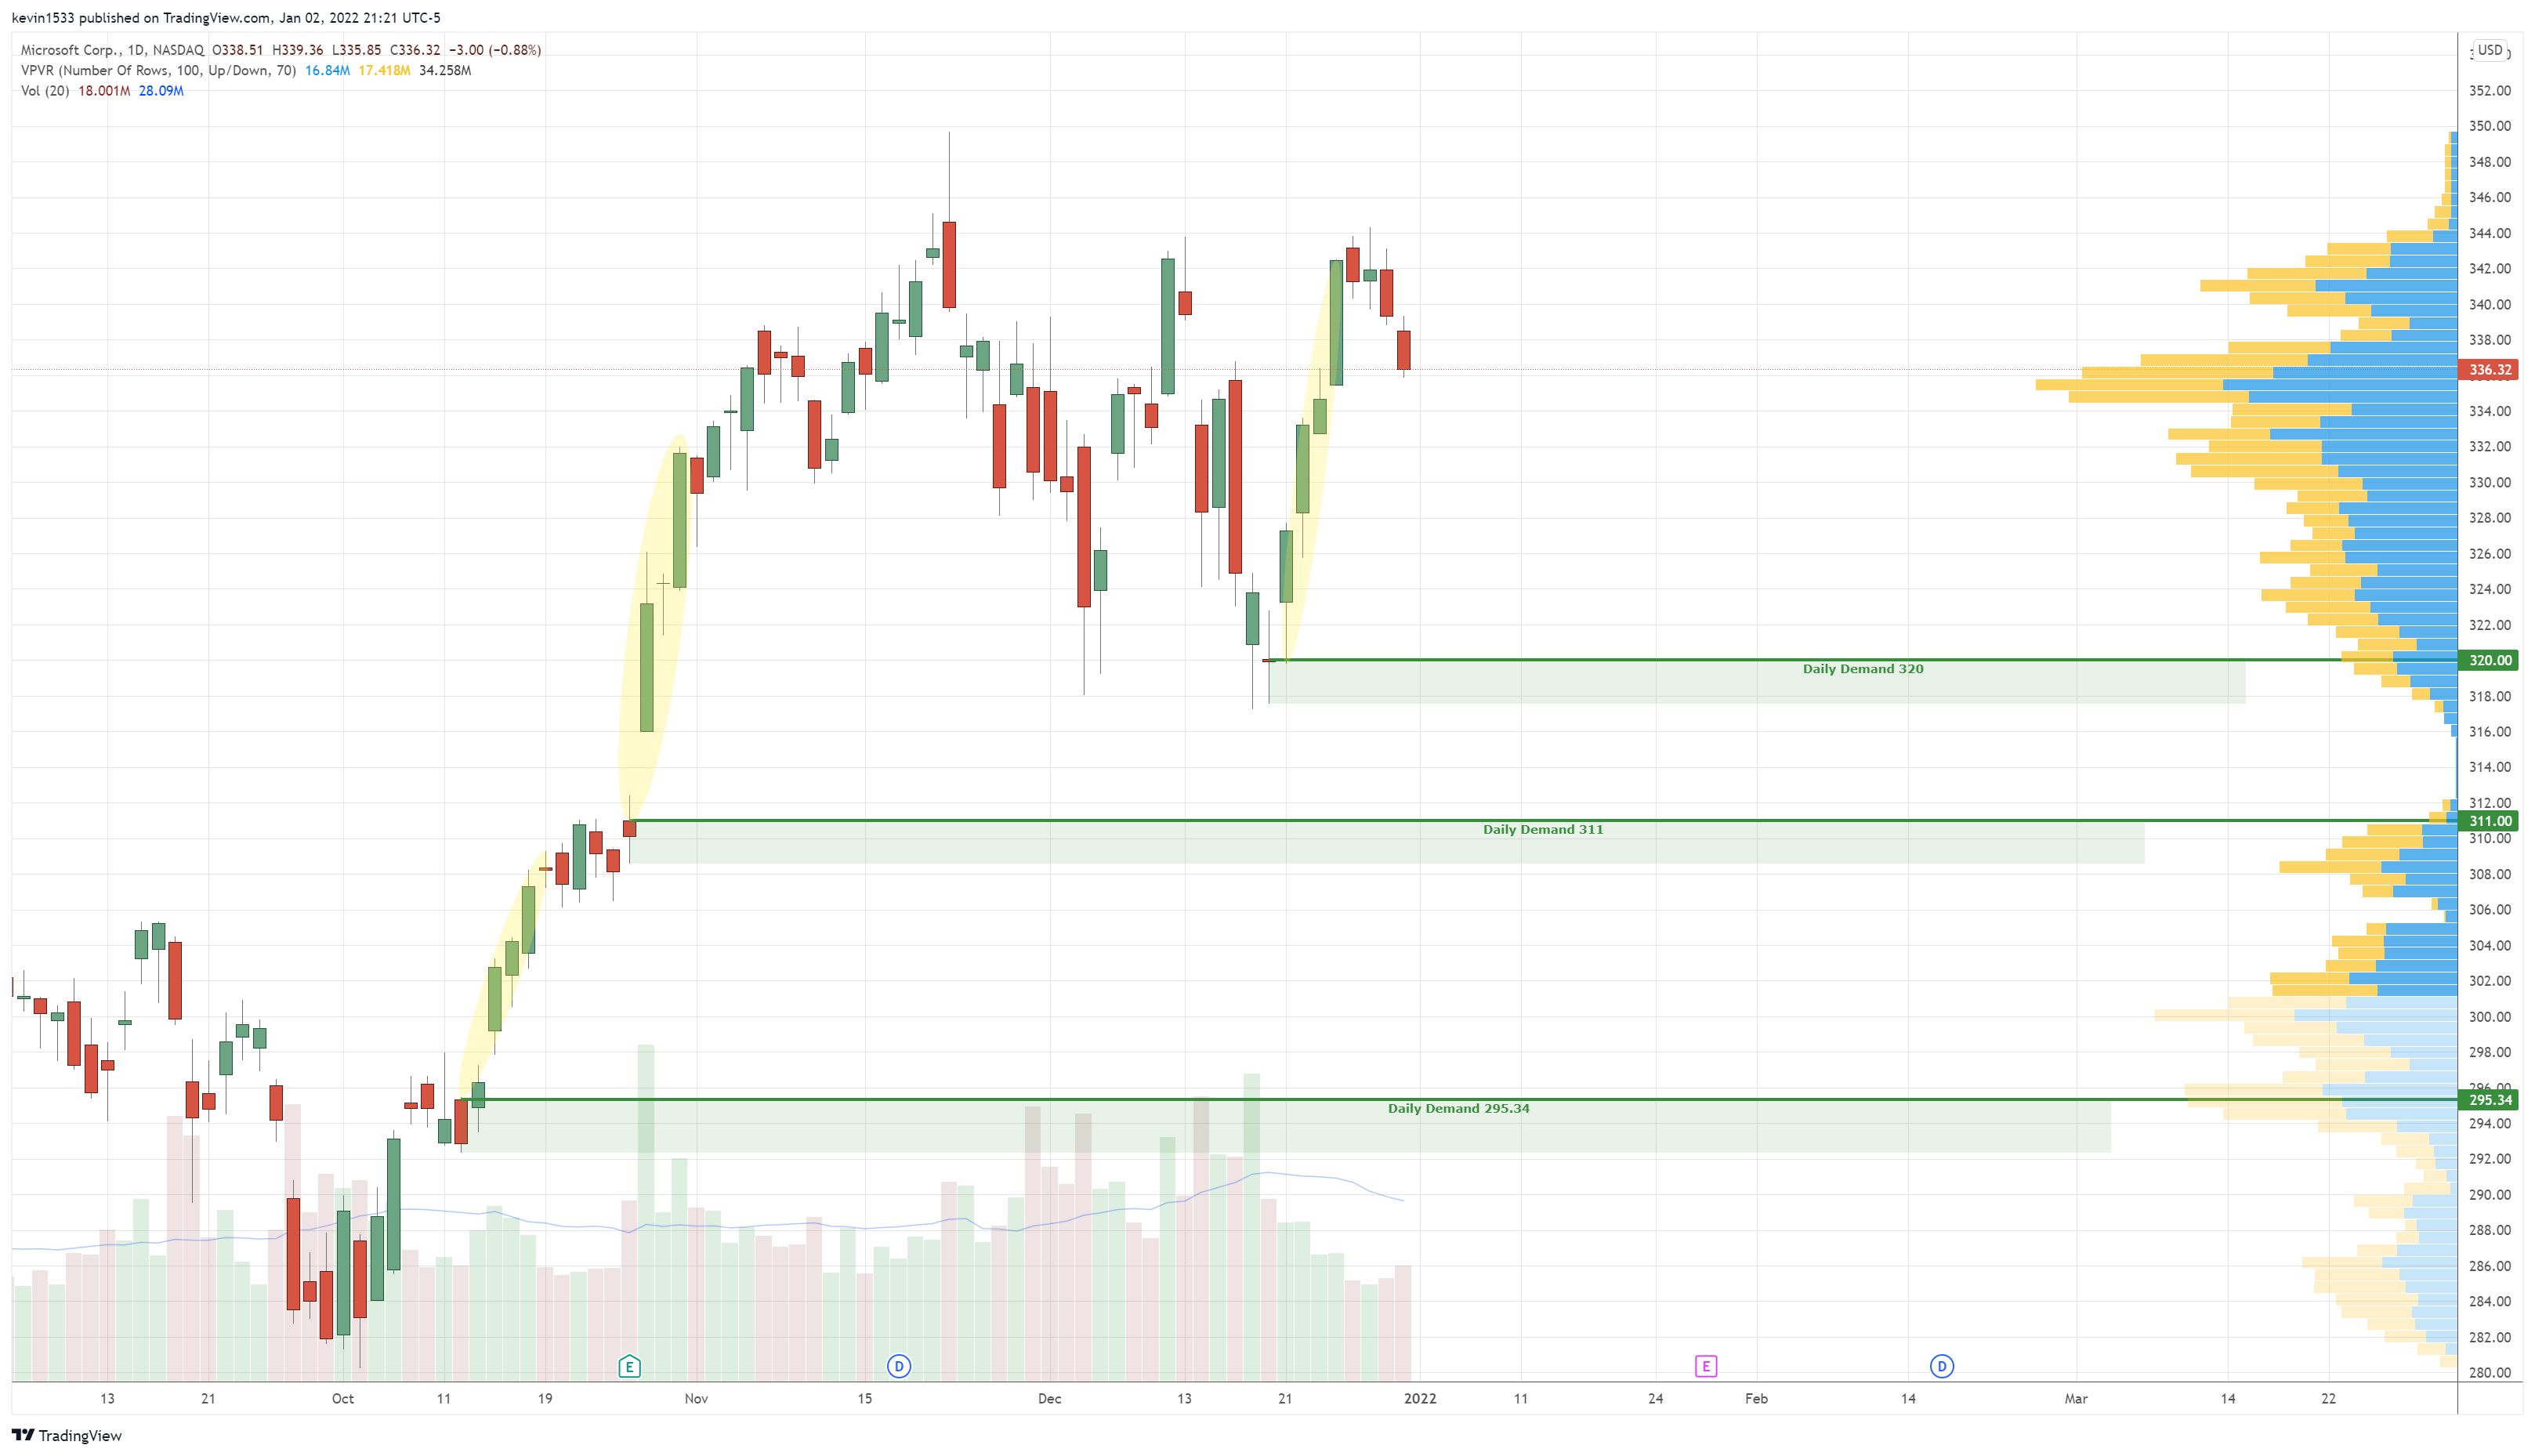
$MSFT (daily) Long setups at 320, 311, 295.34
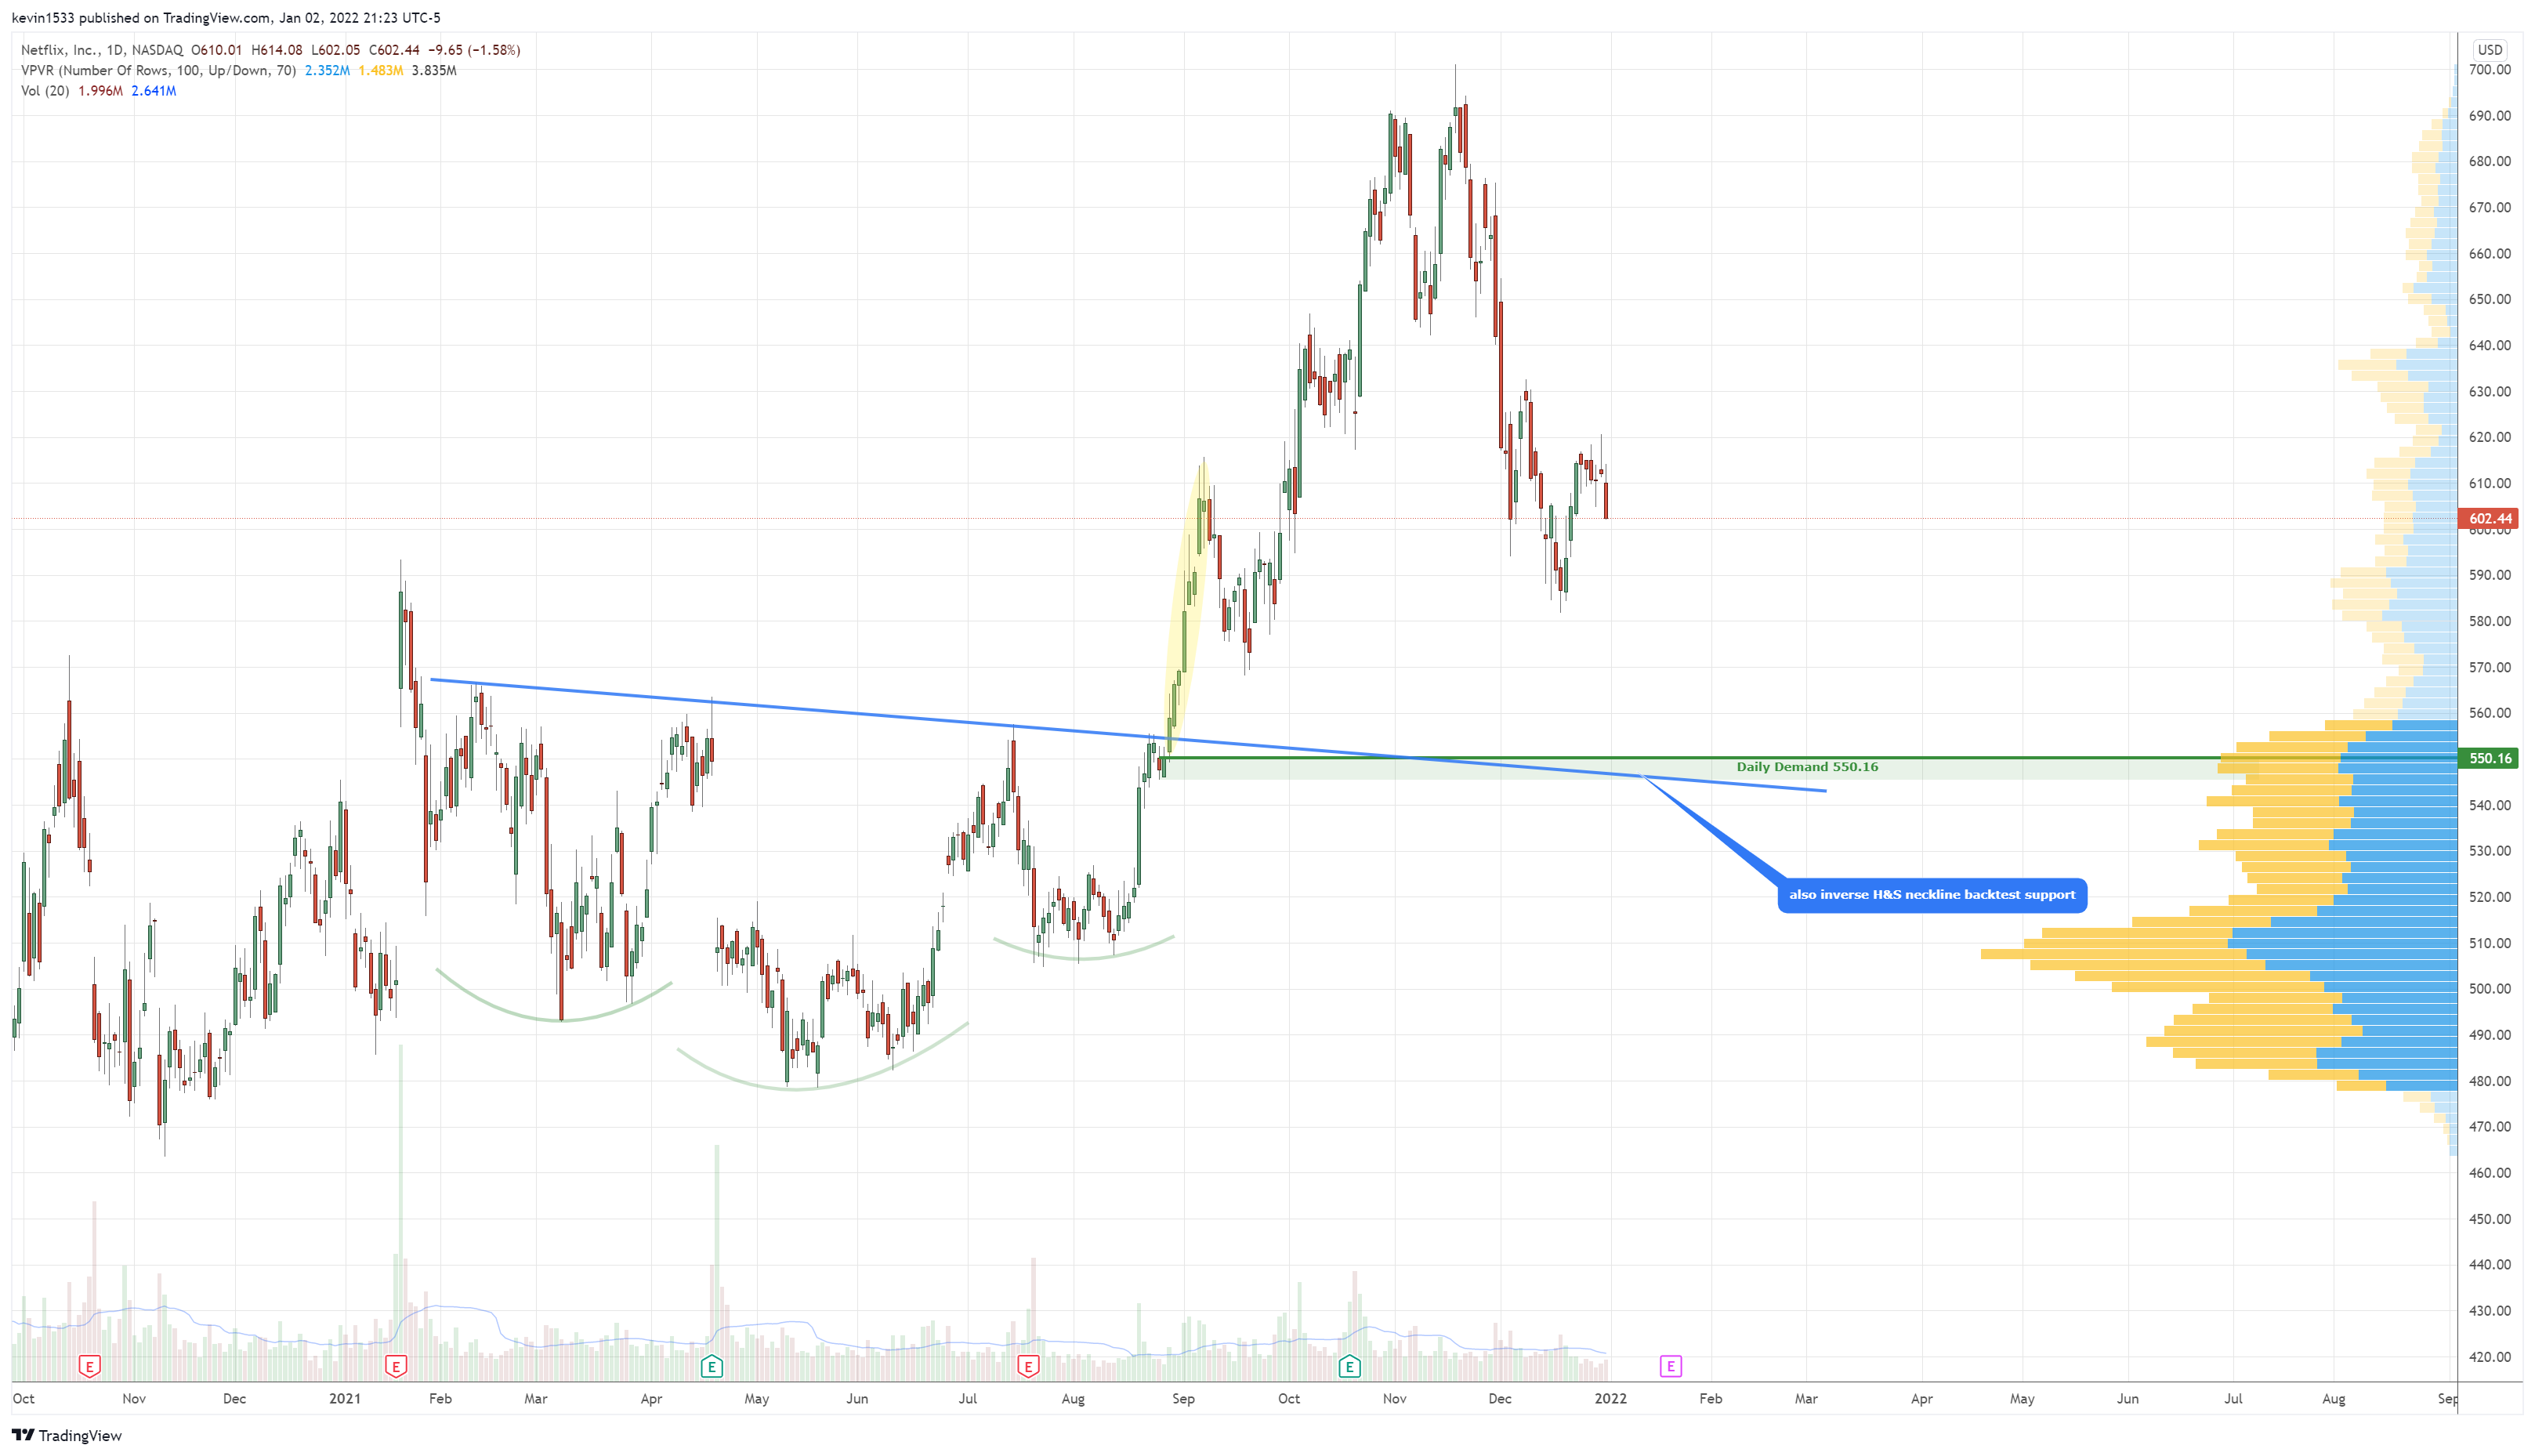
$NFLX (daily) long setup at 550.16
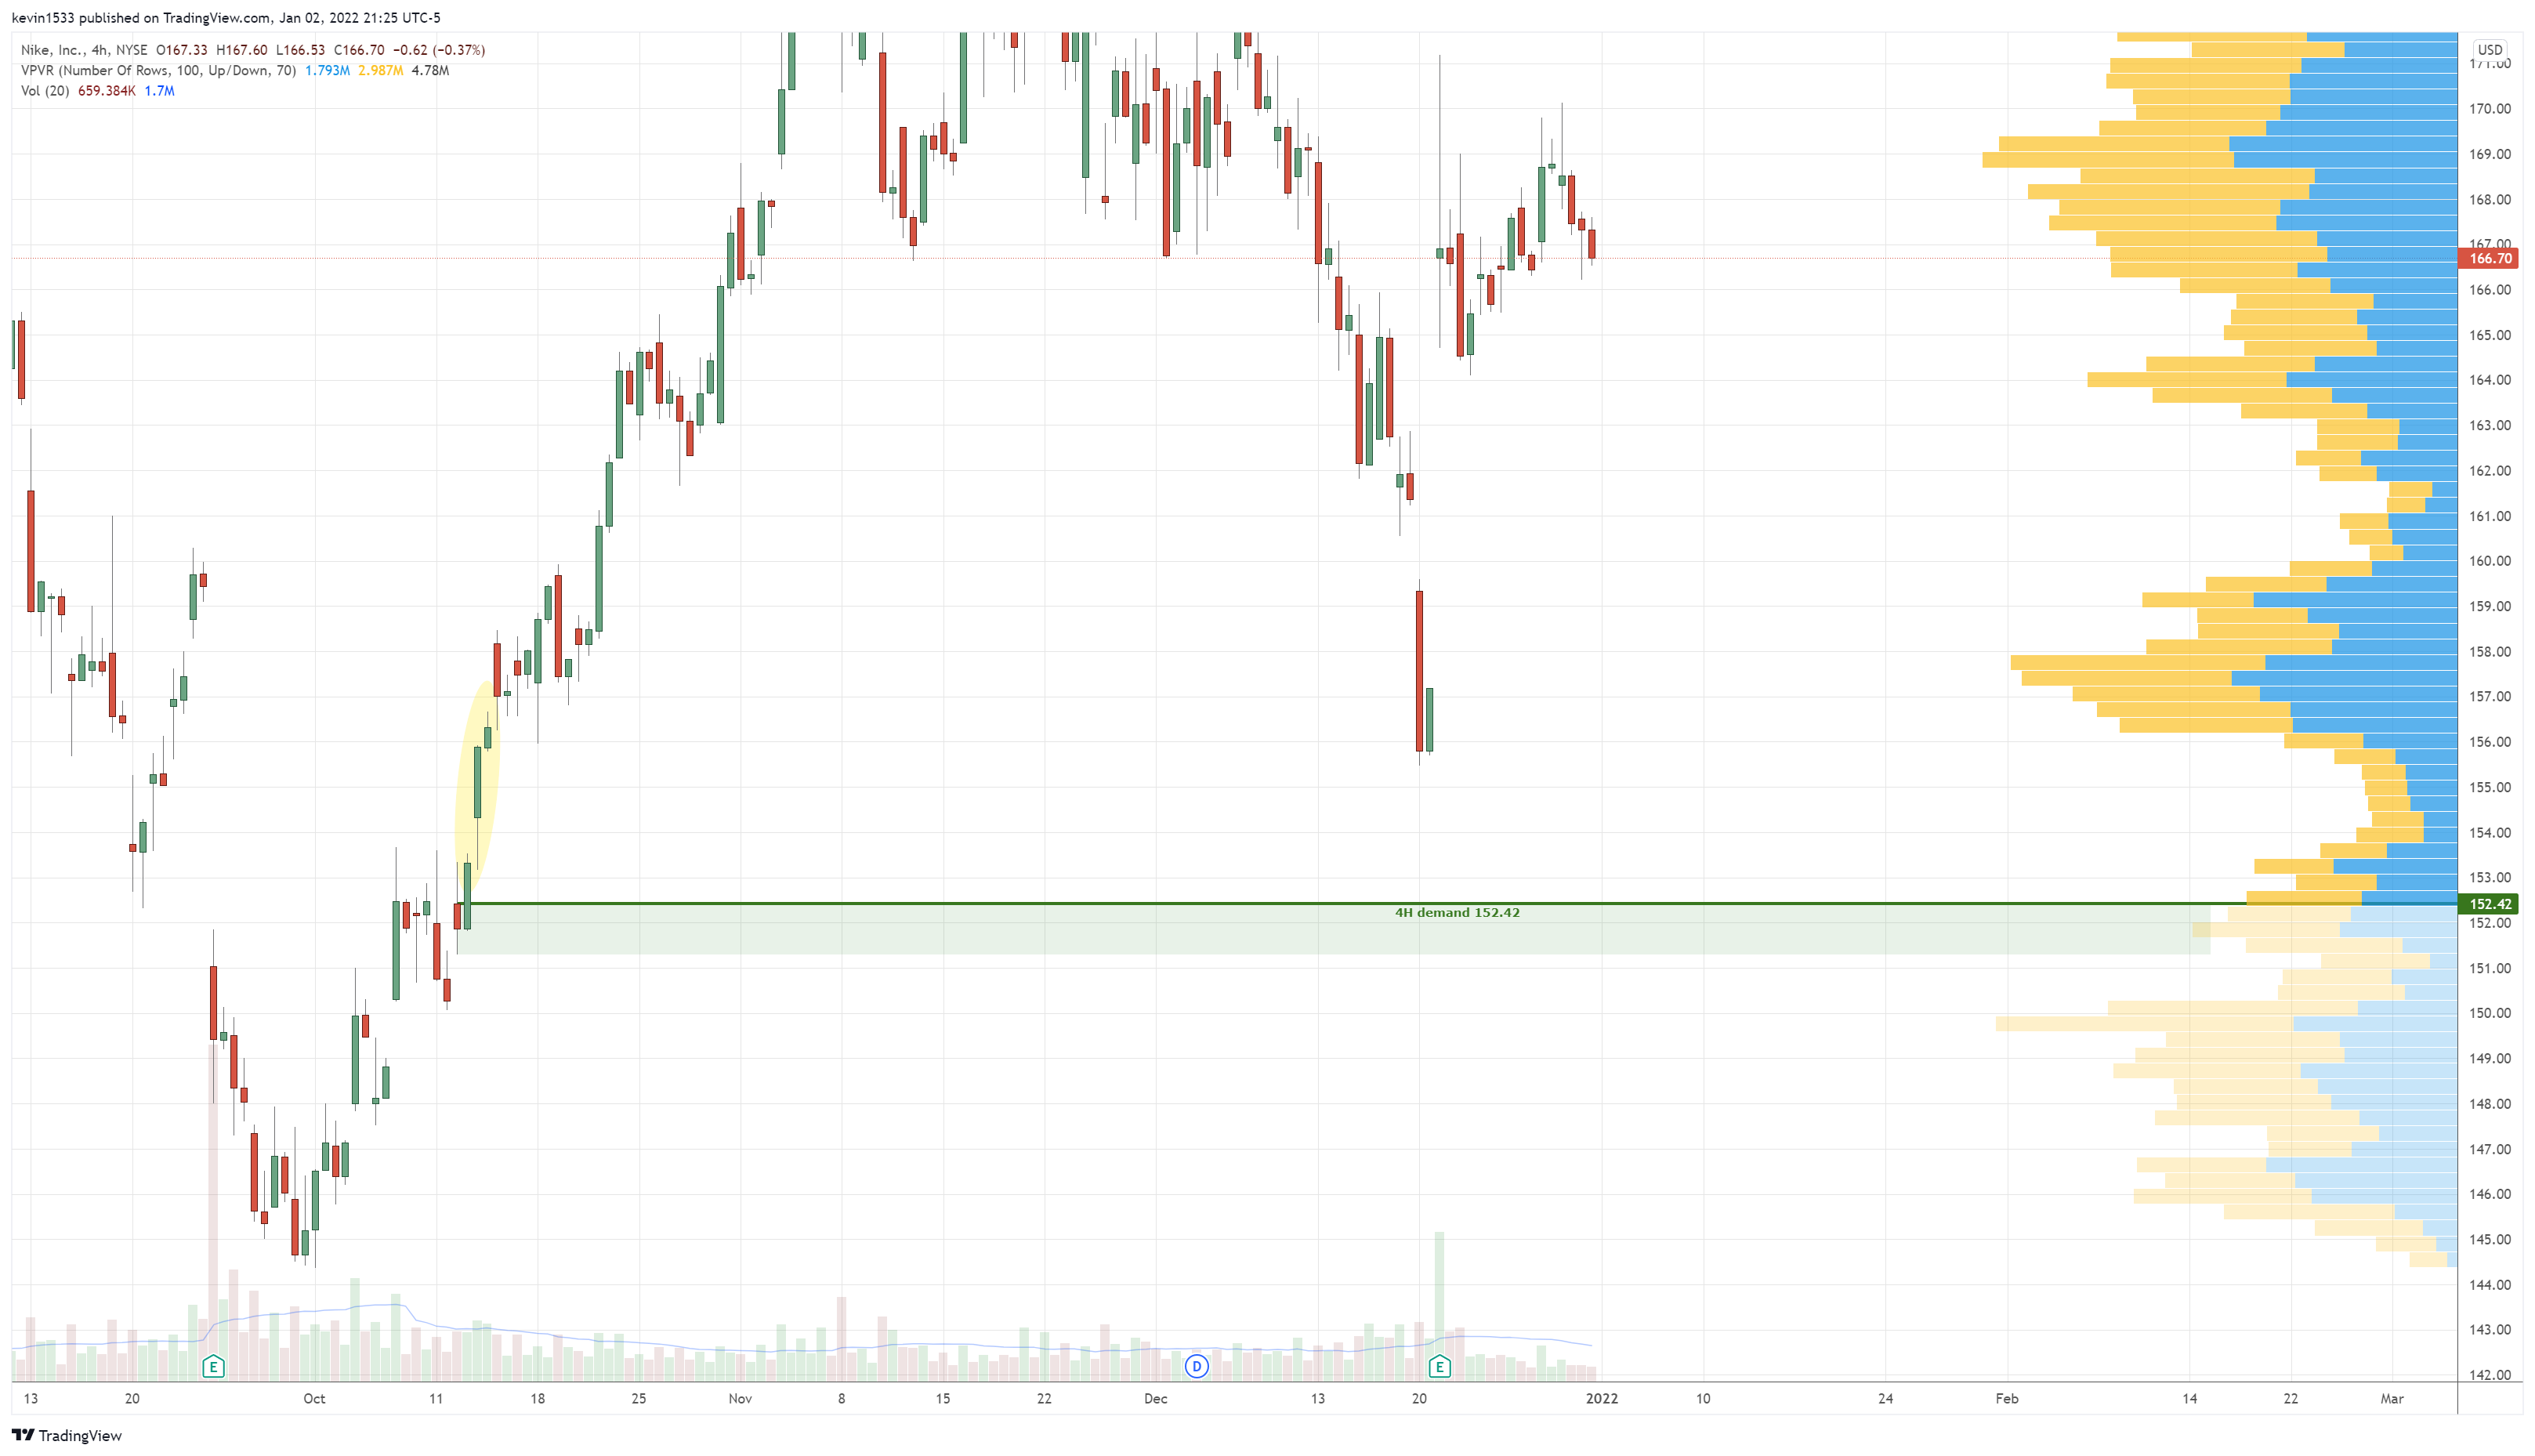
$NKE (4h) long setup at 152.42
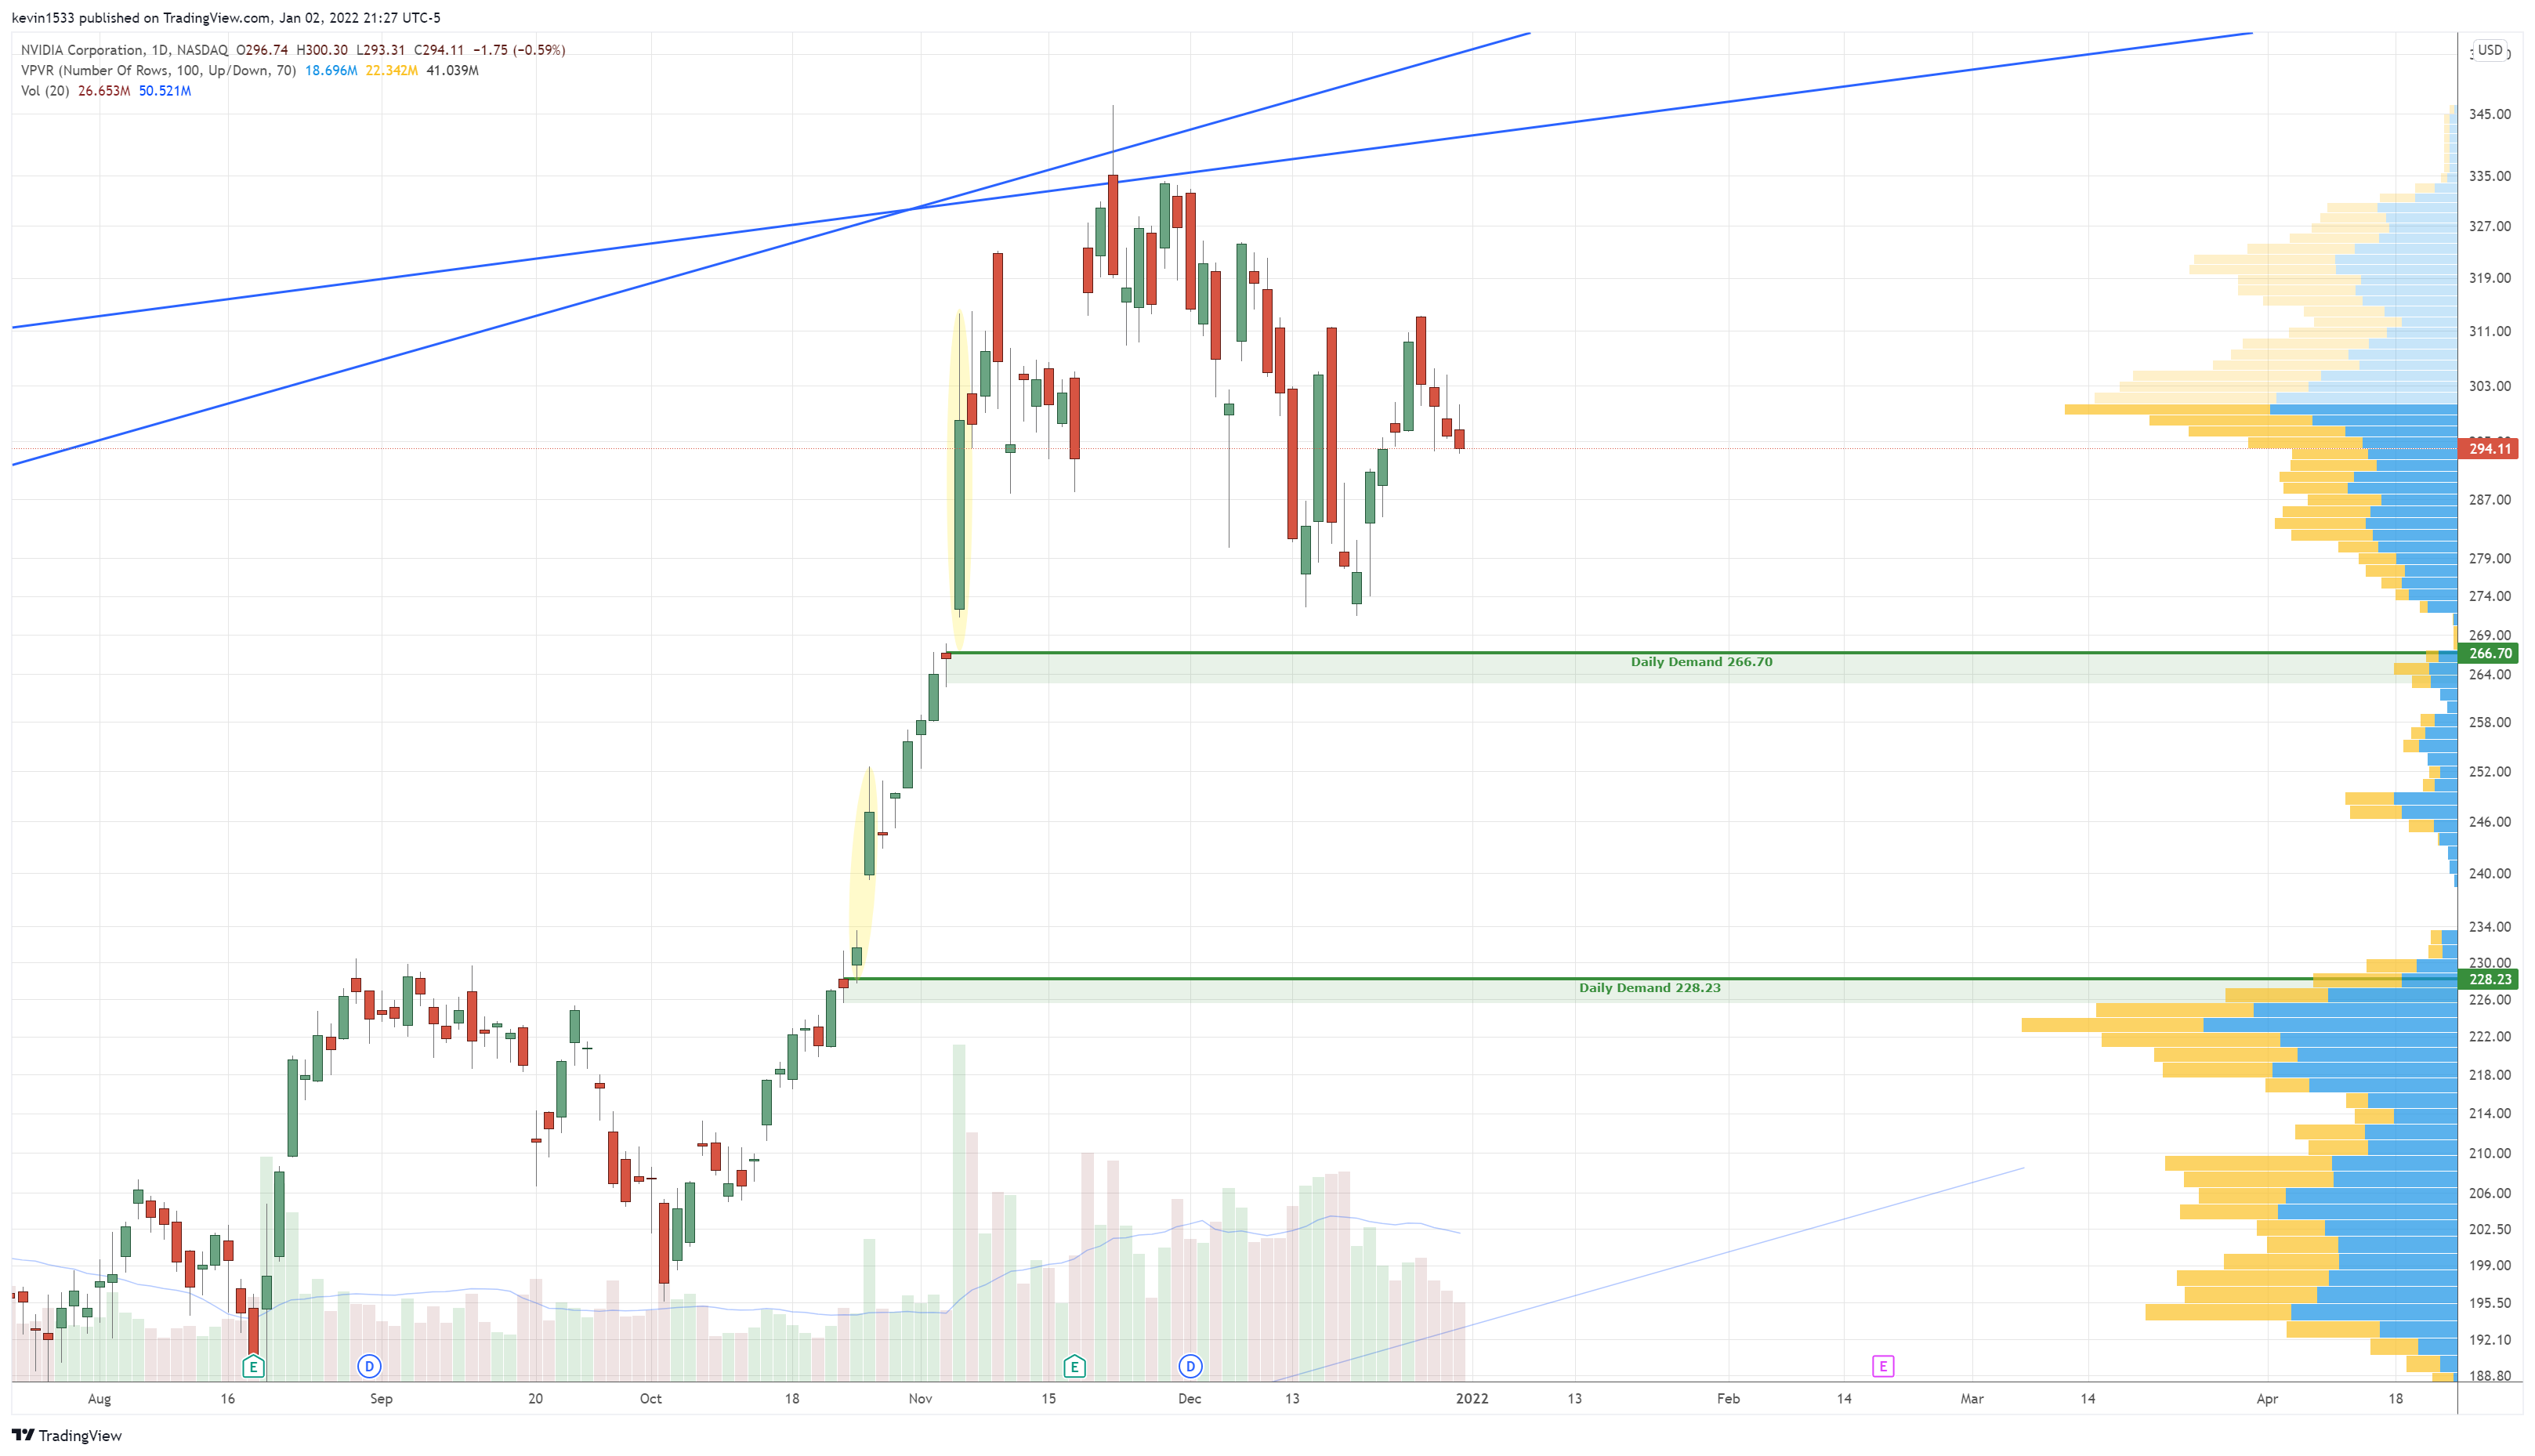
$NVDA (daily) long setup at 266.70 and 228.23
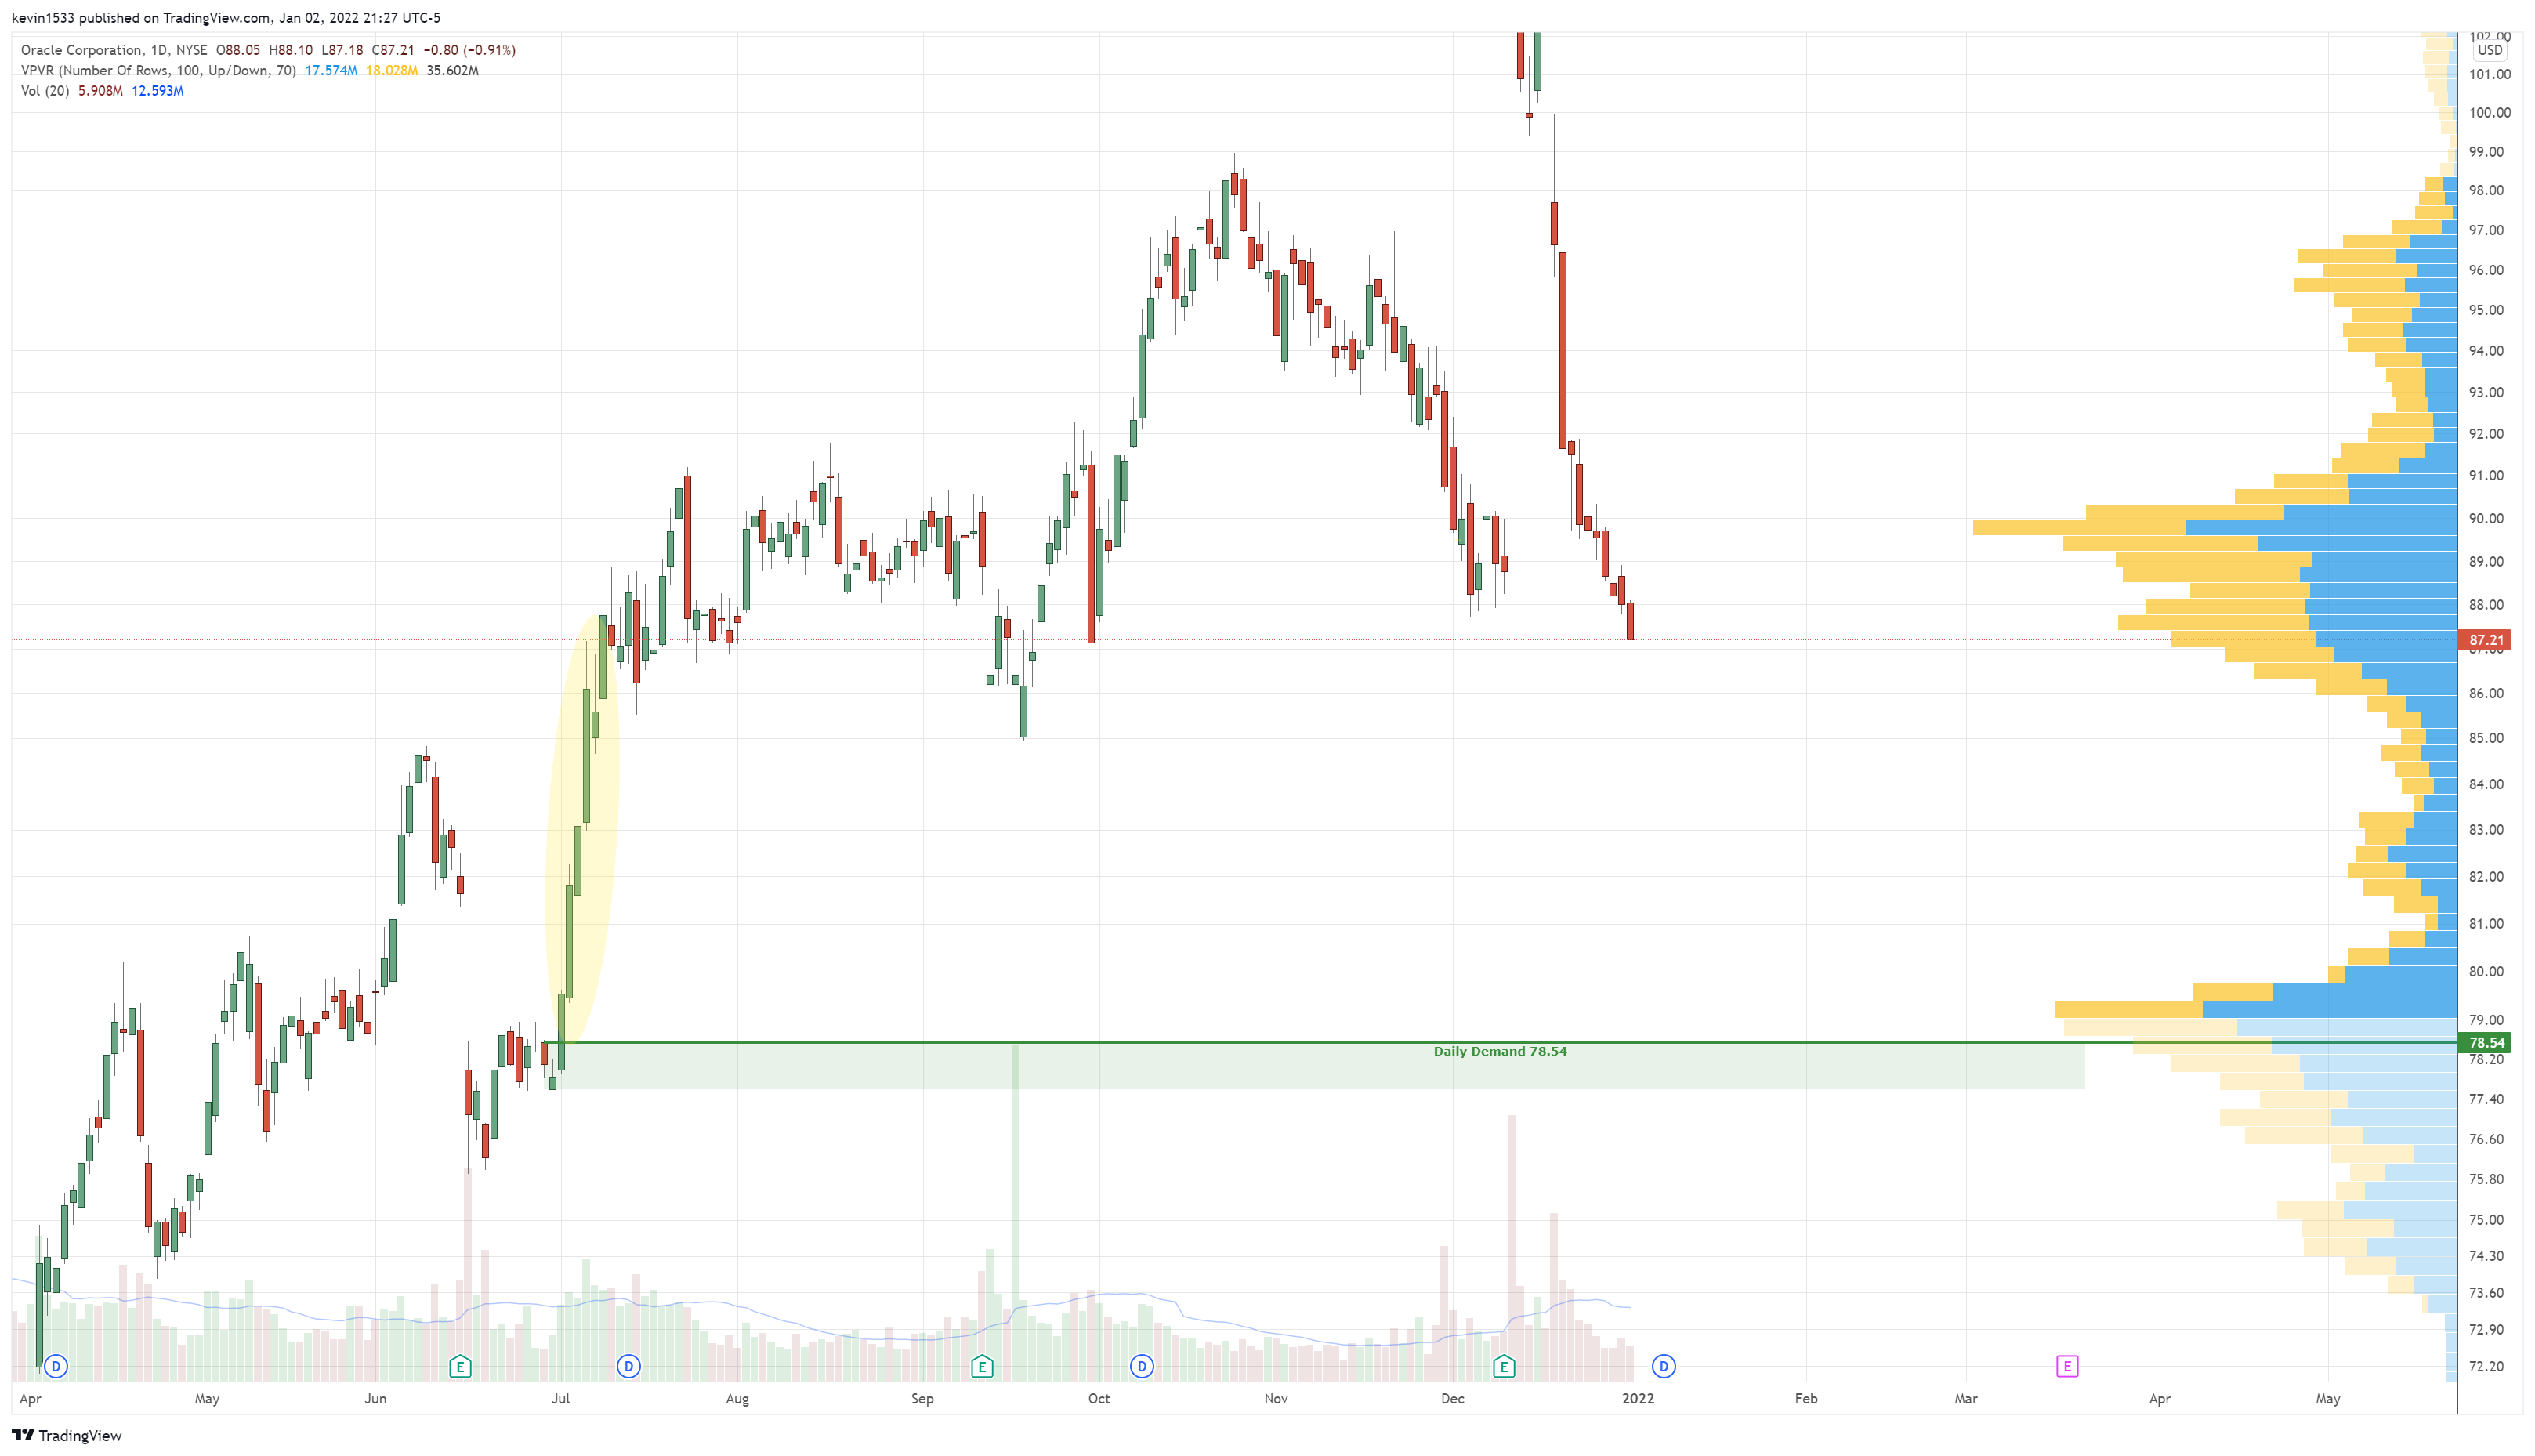
$ORCL (daily) long setup at 78.54
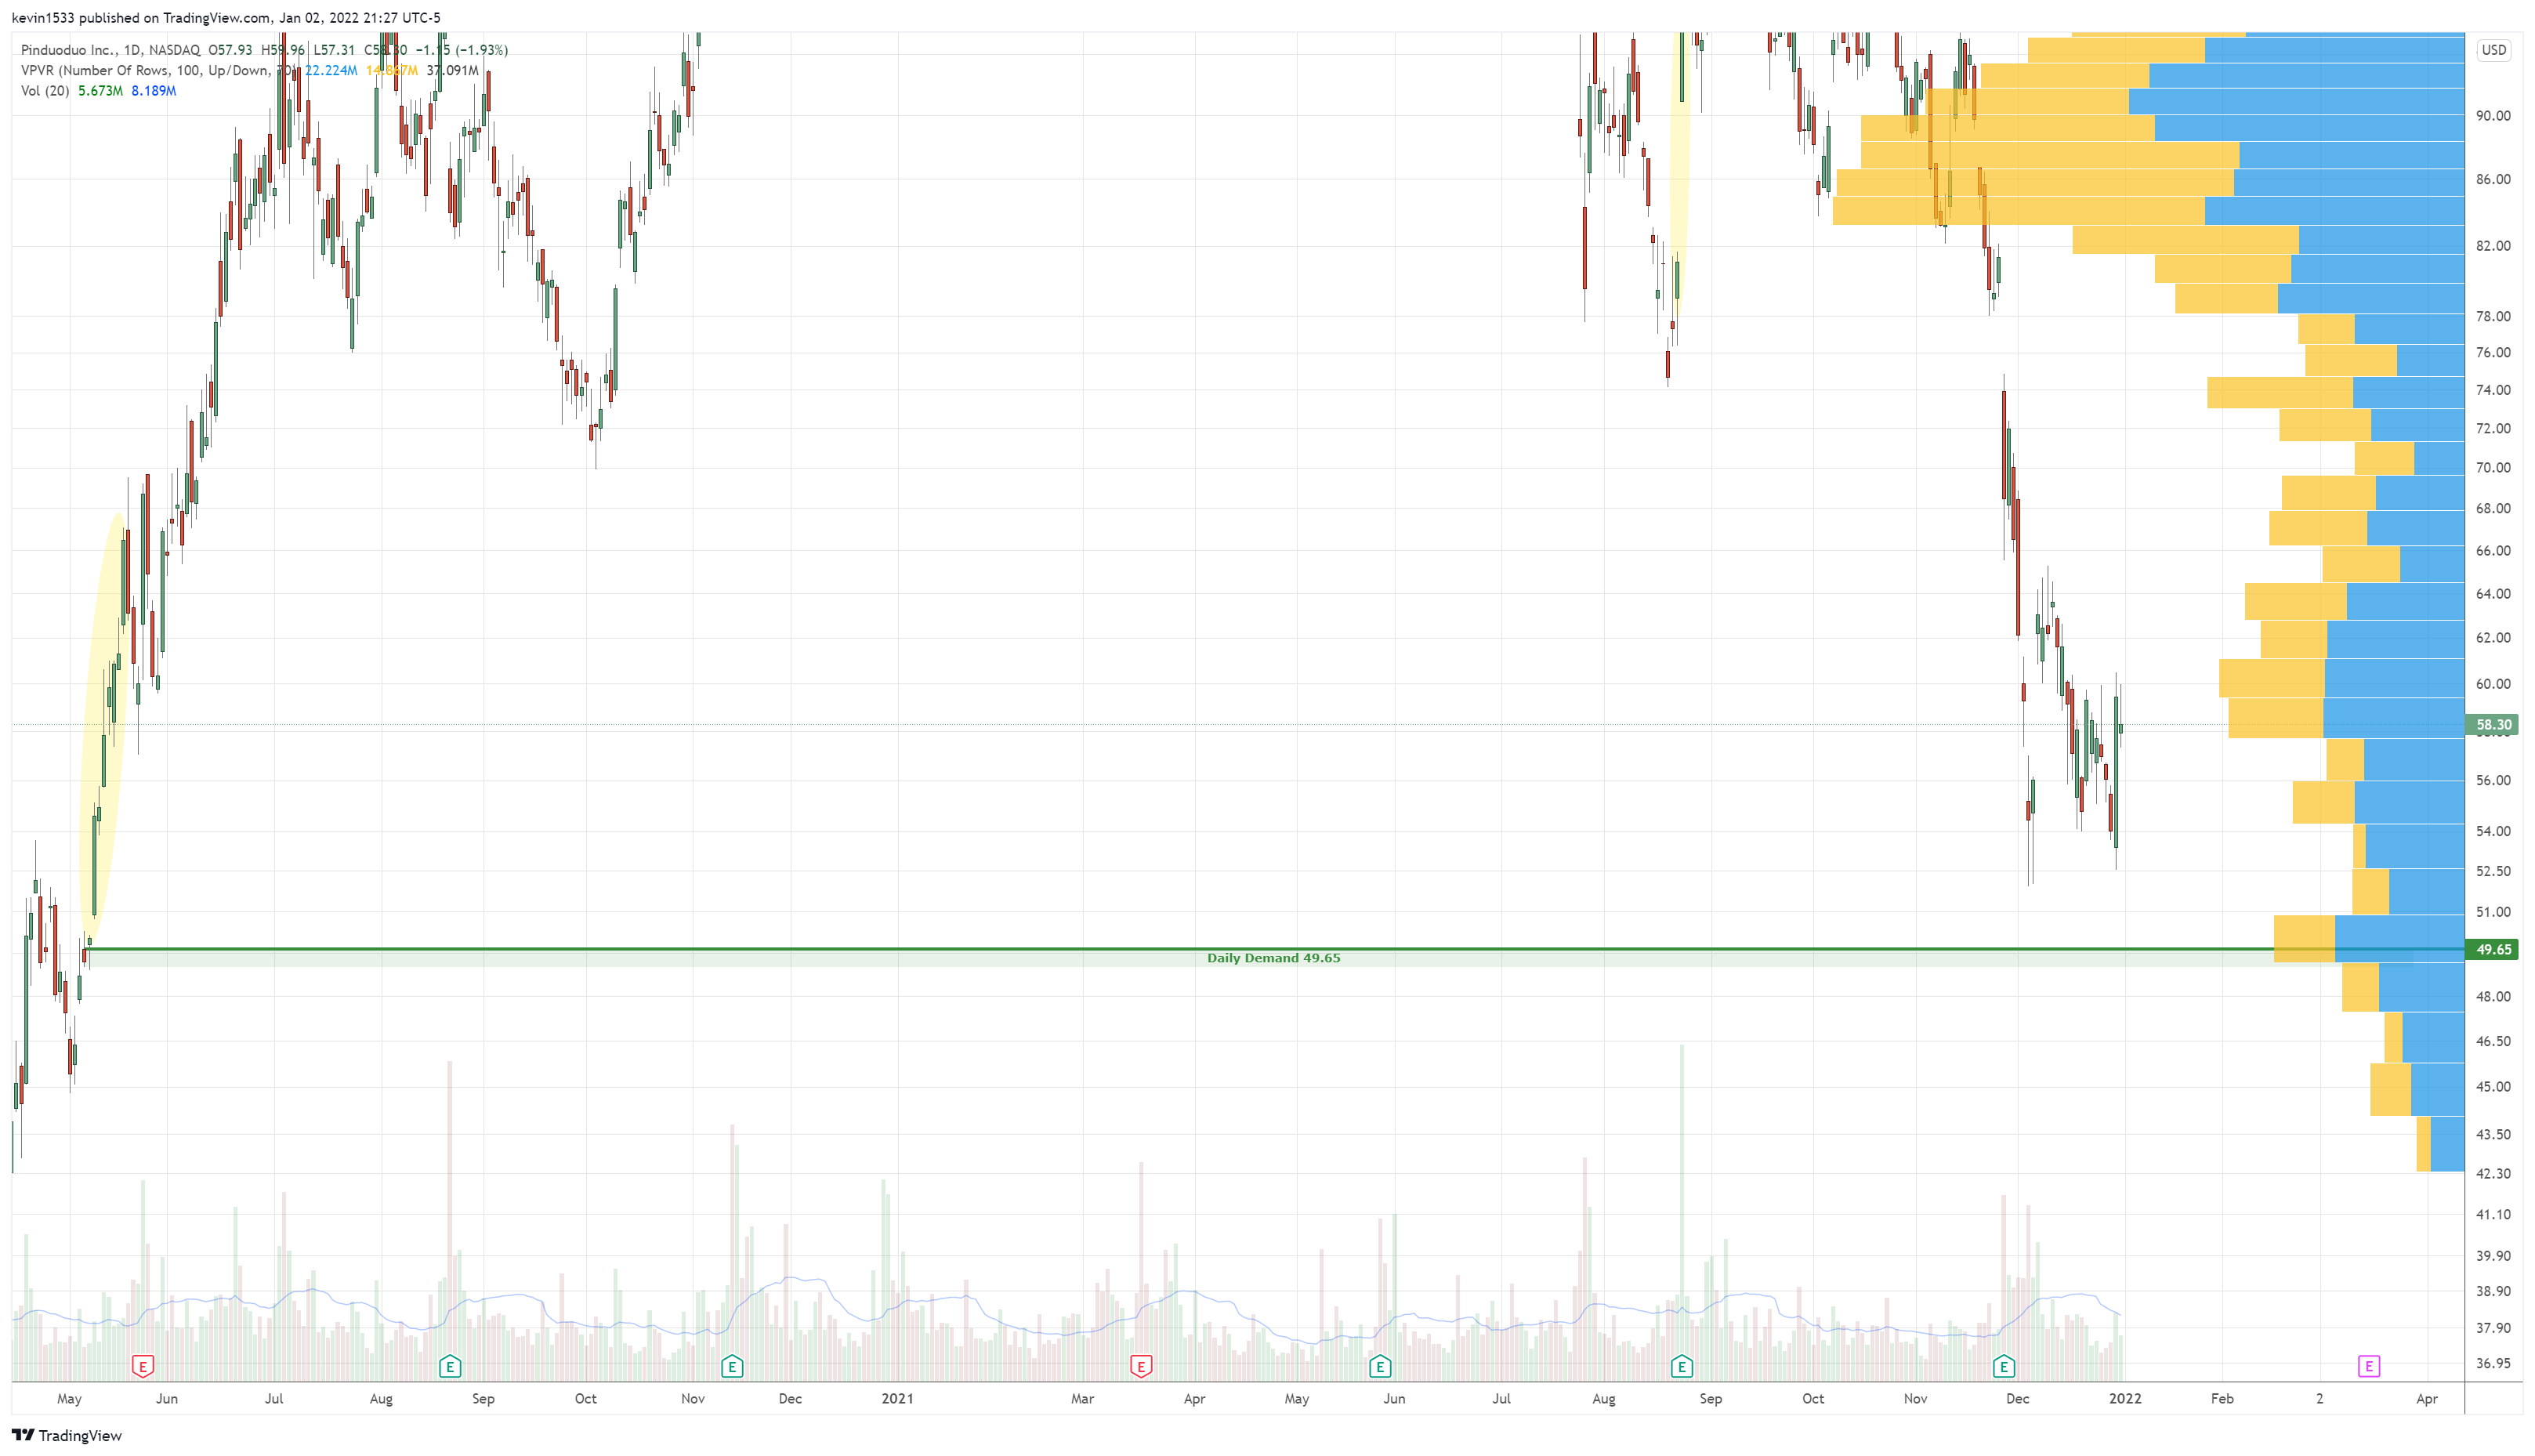
$PDD (daily) long setup at 49.65
$PTON (daily) long setup at 32.44

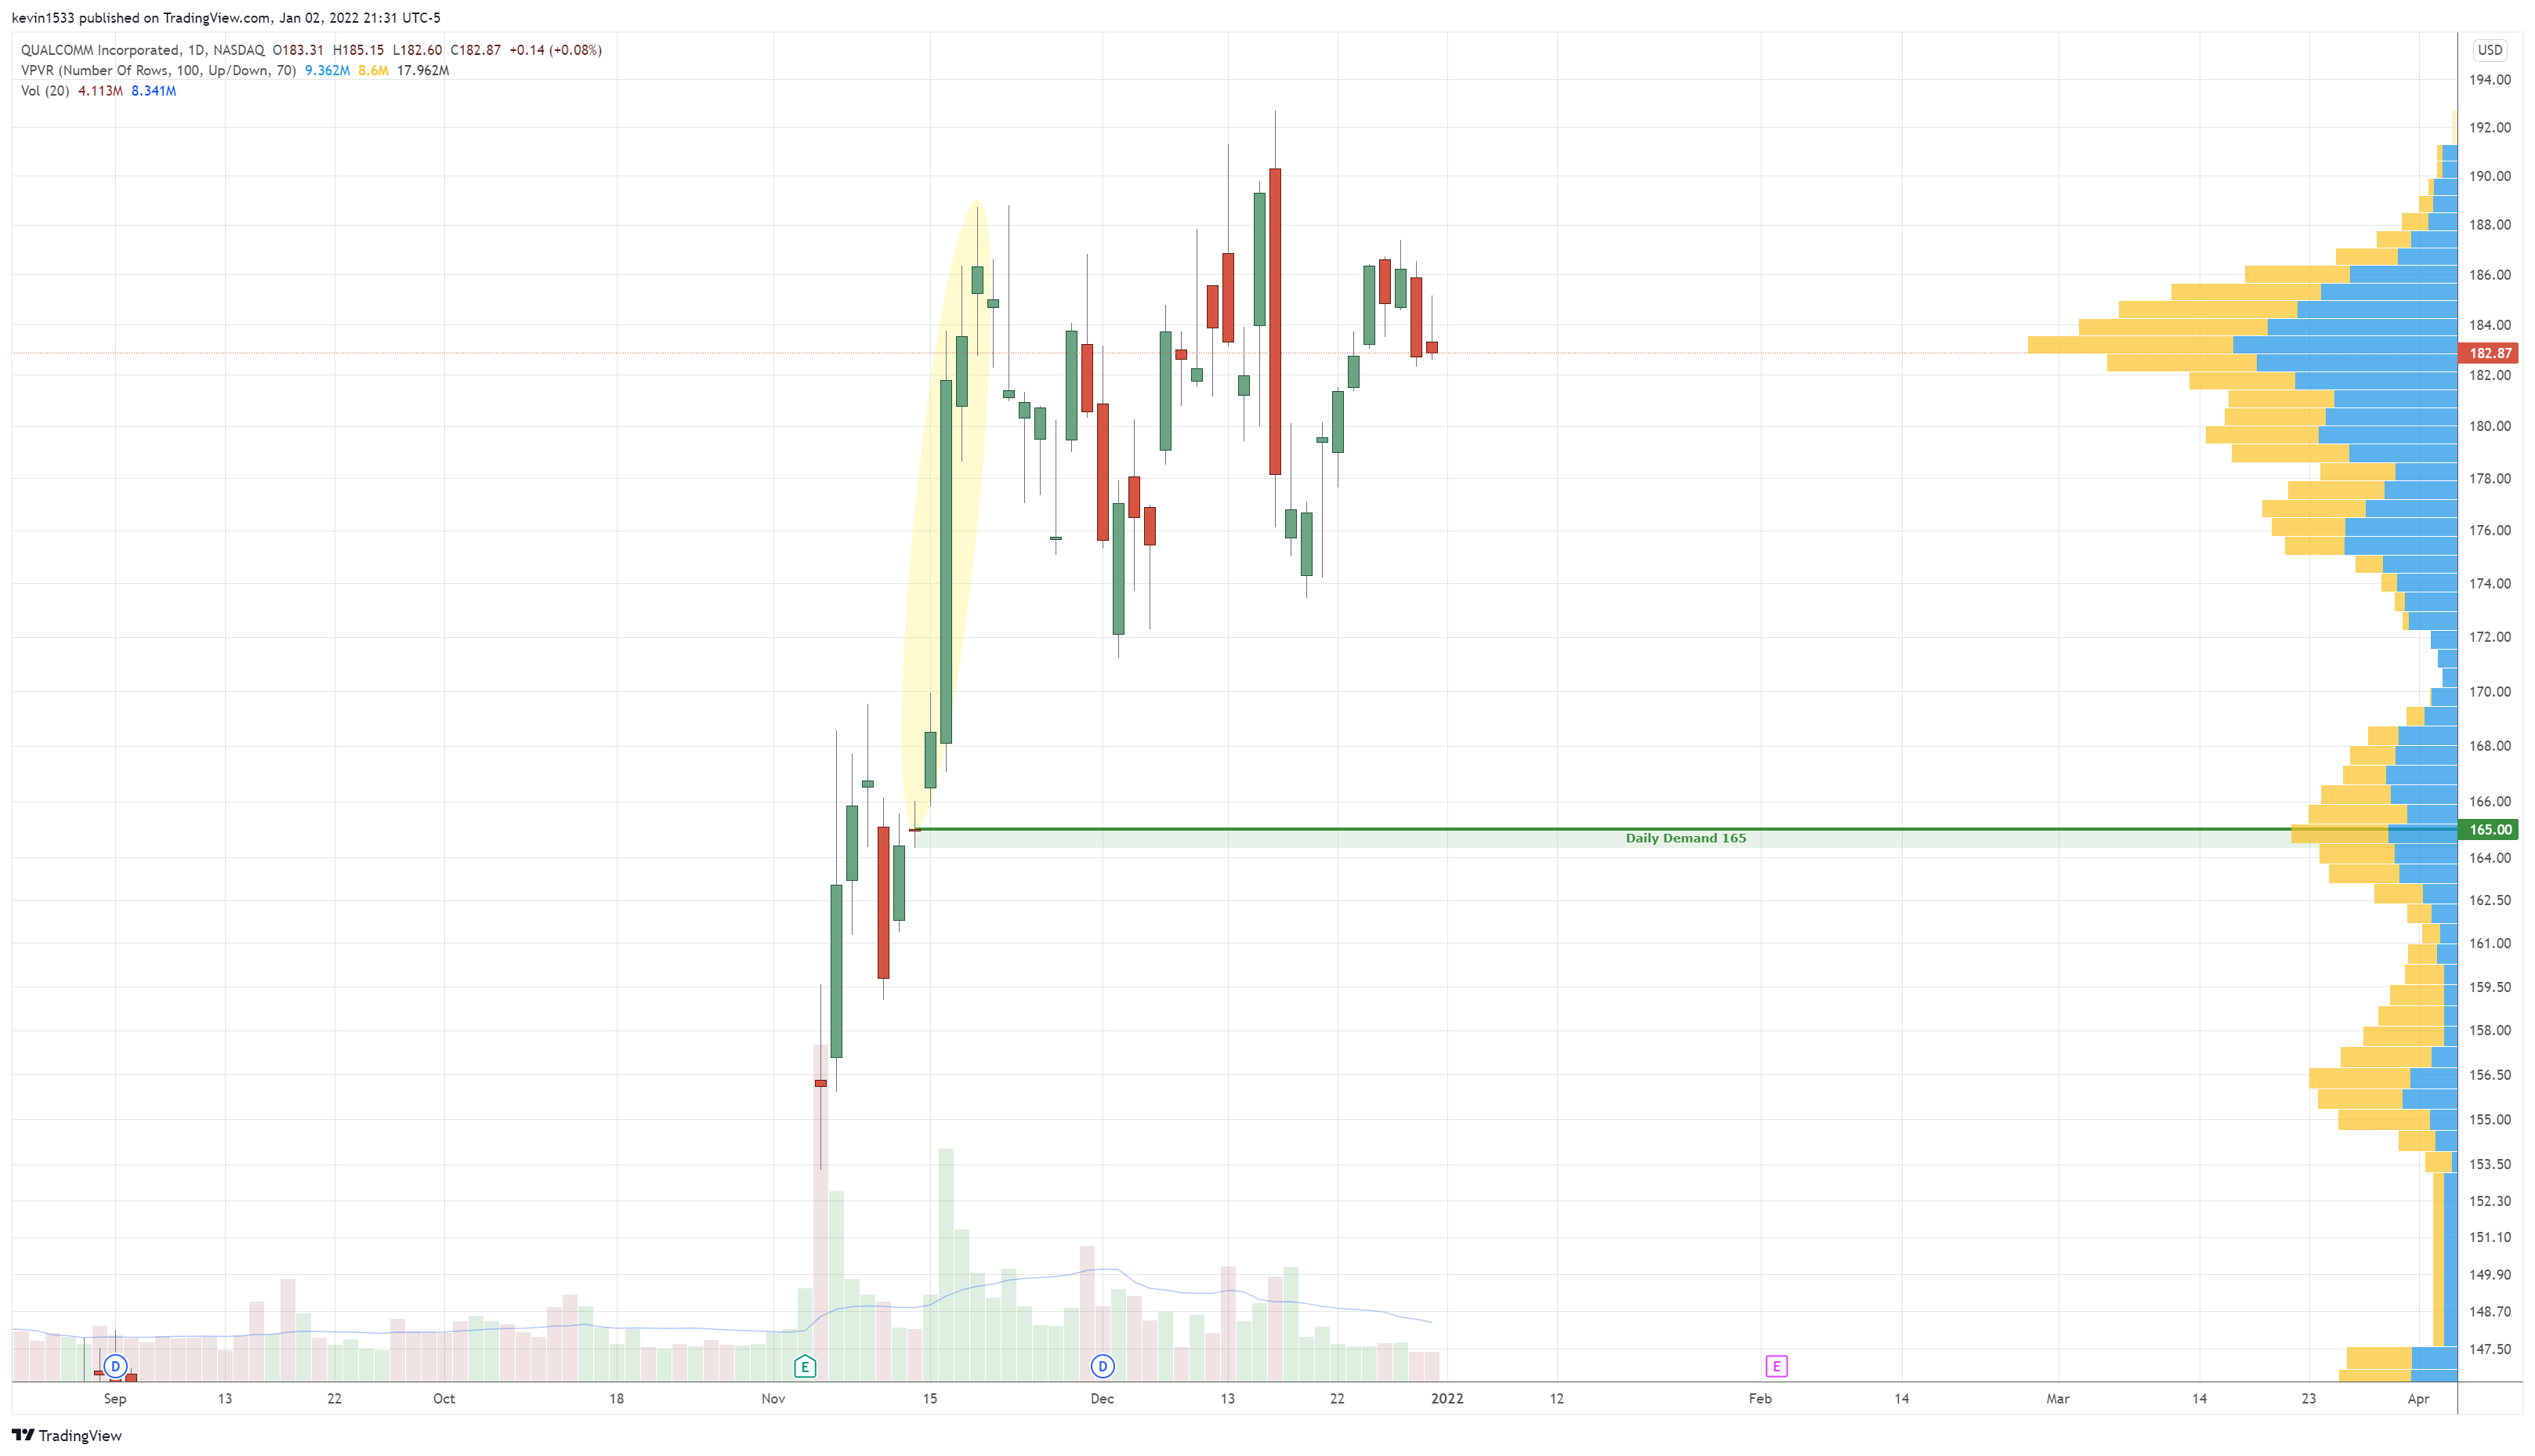
$QCOM (daily) long setup at 165
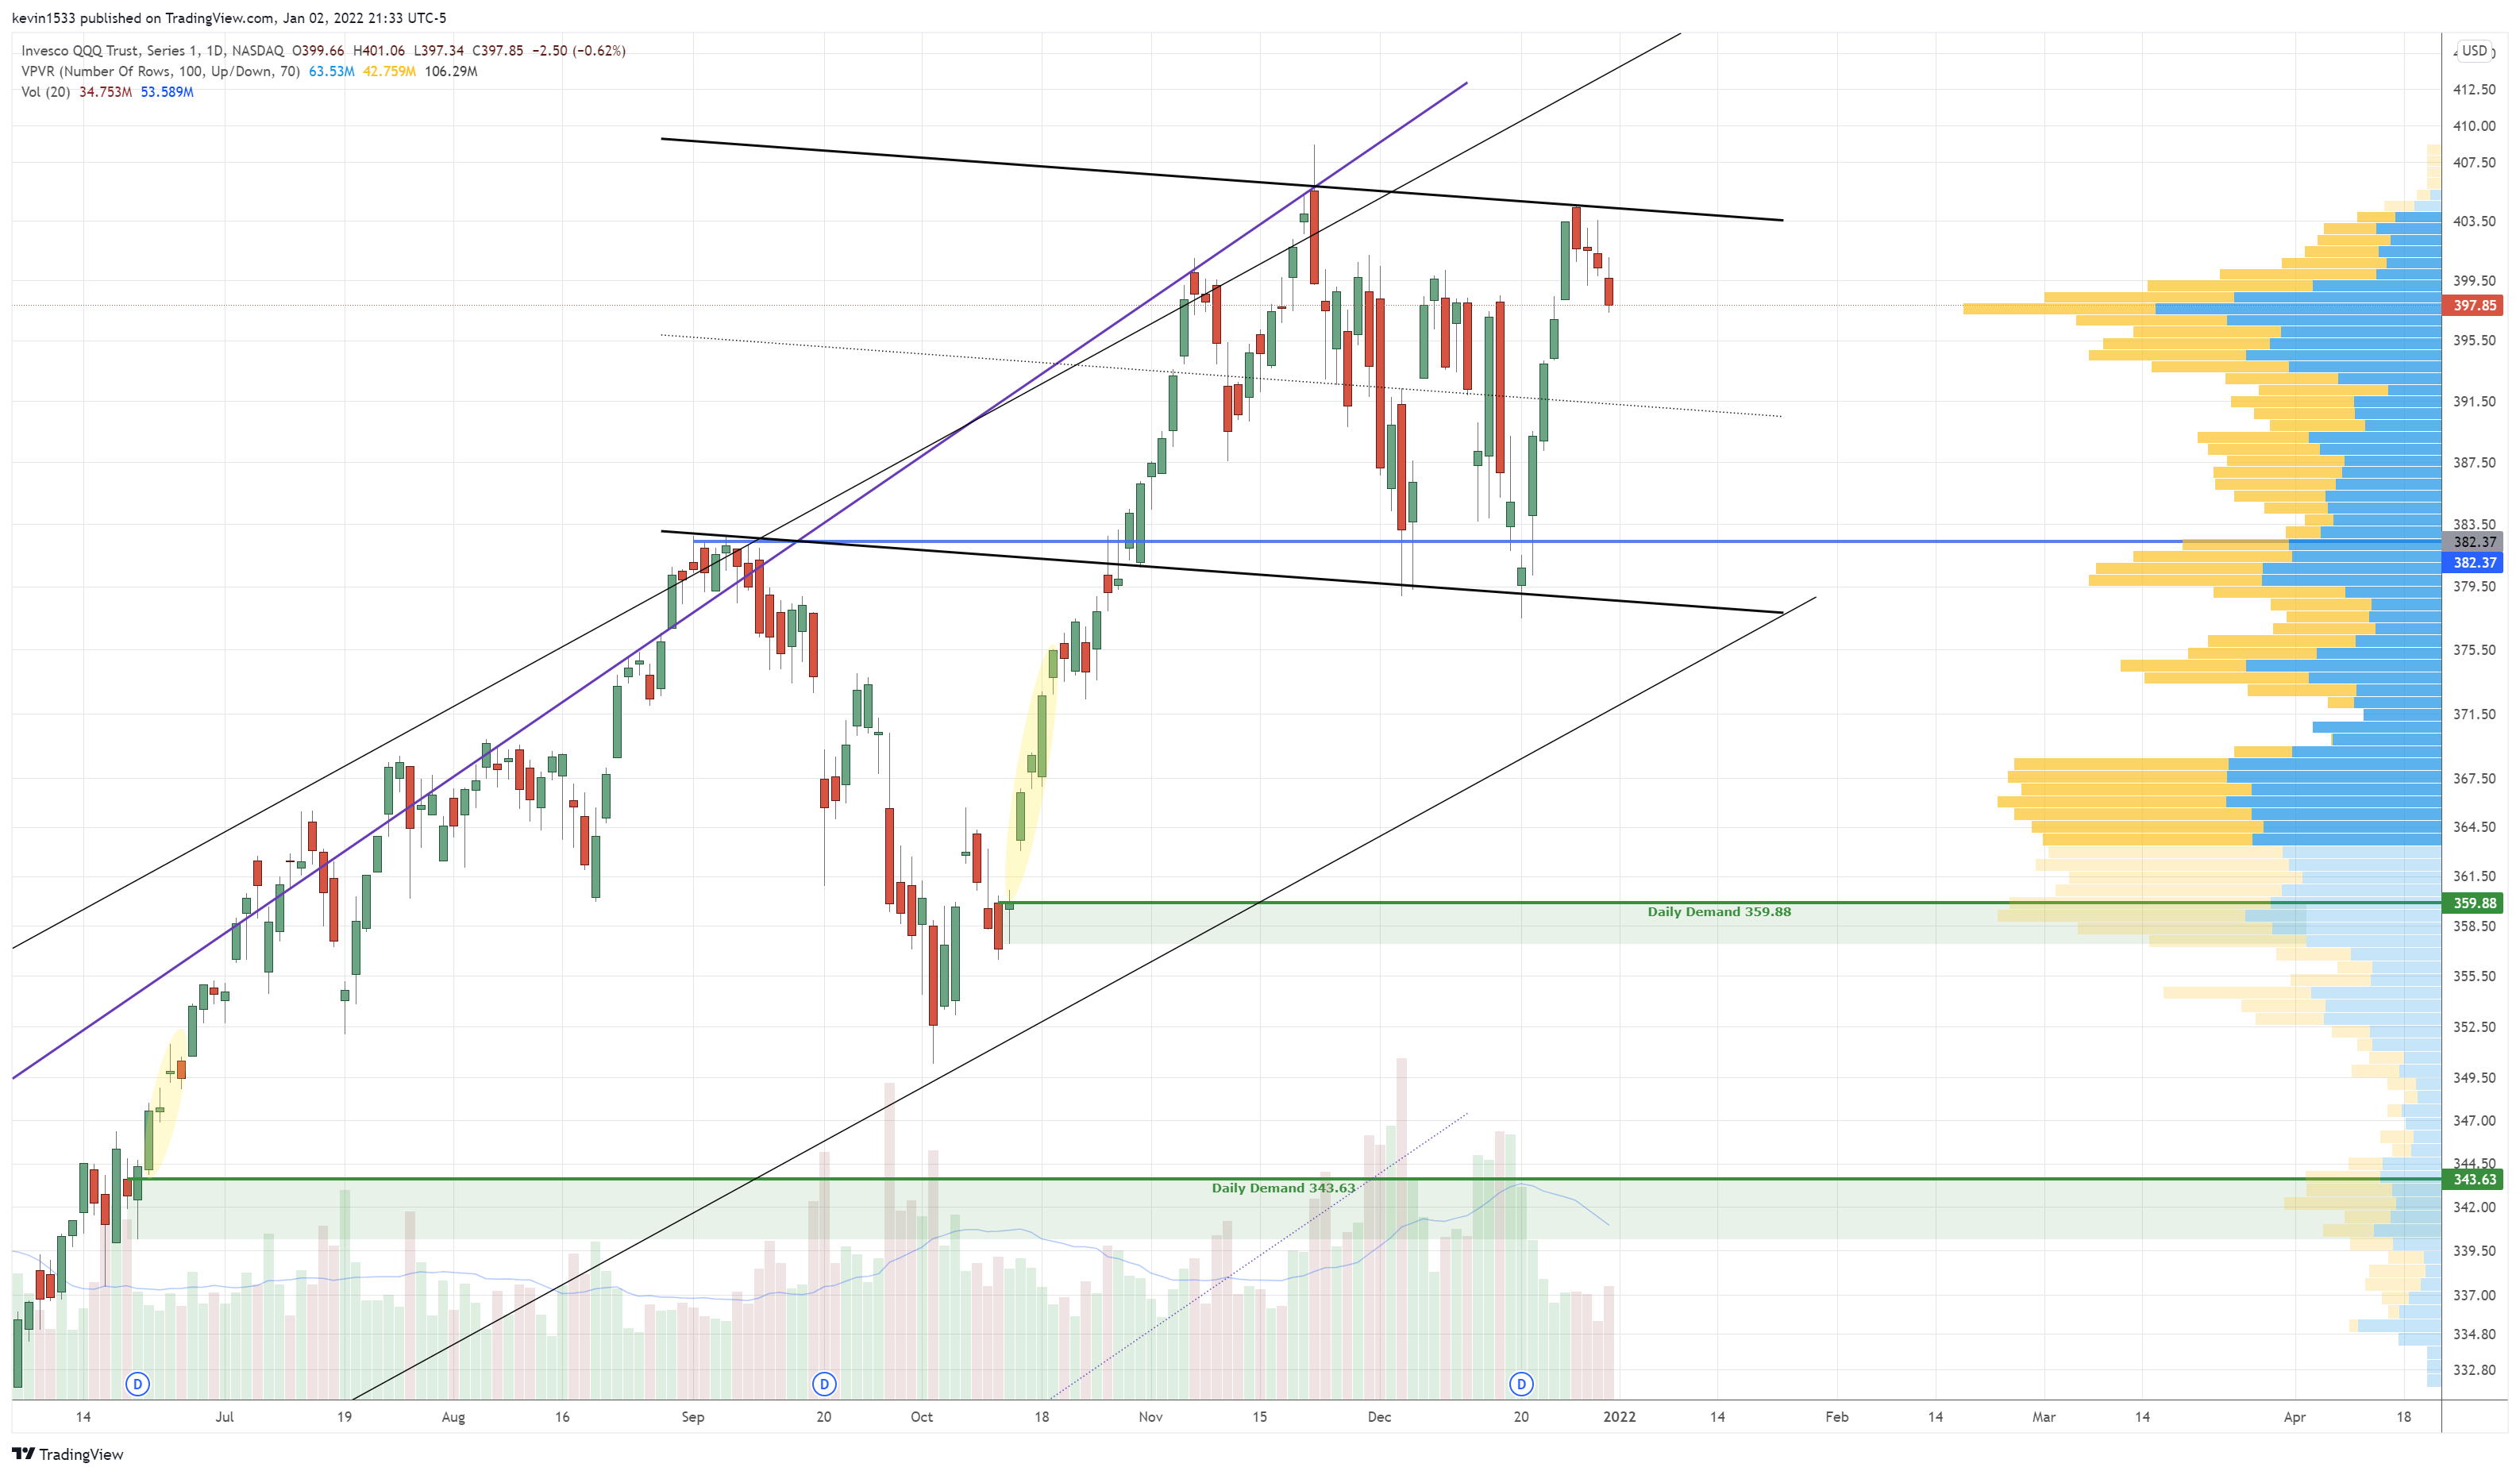
$QQQ (daily) long setup at 359.88 and 343.63
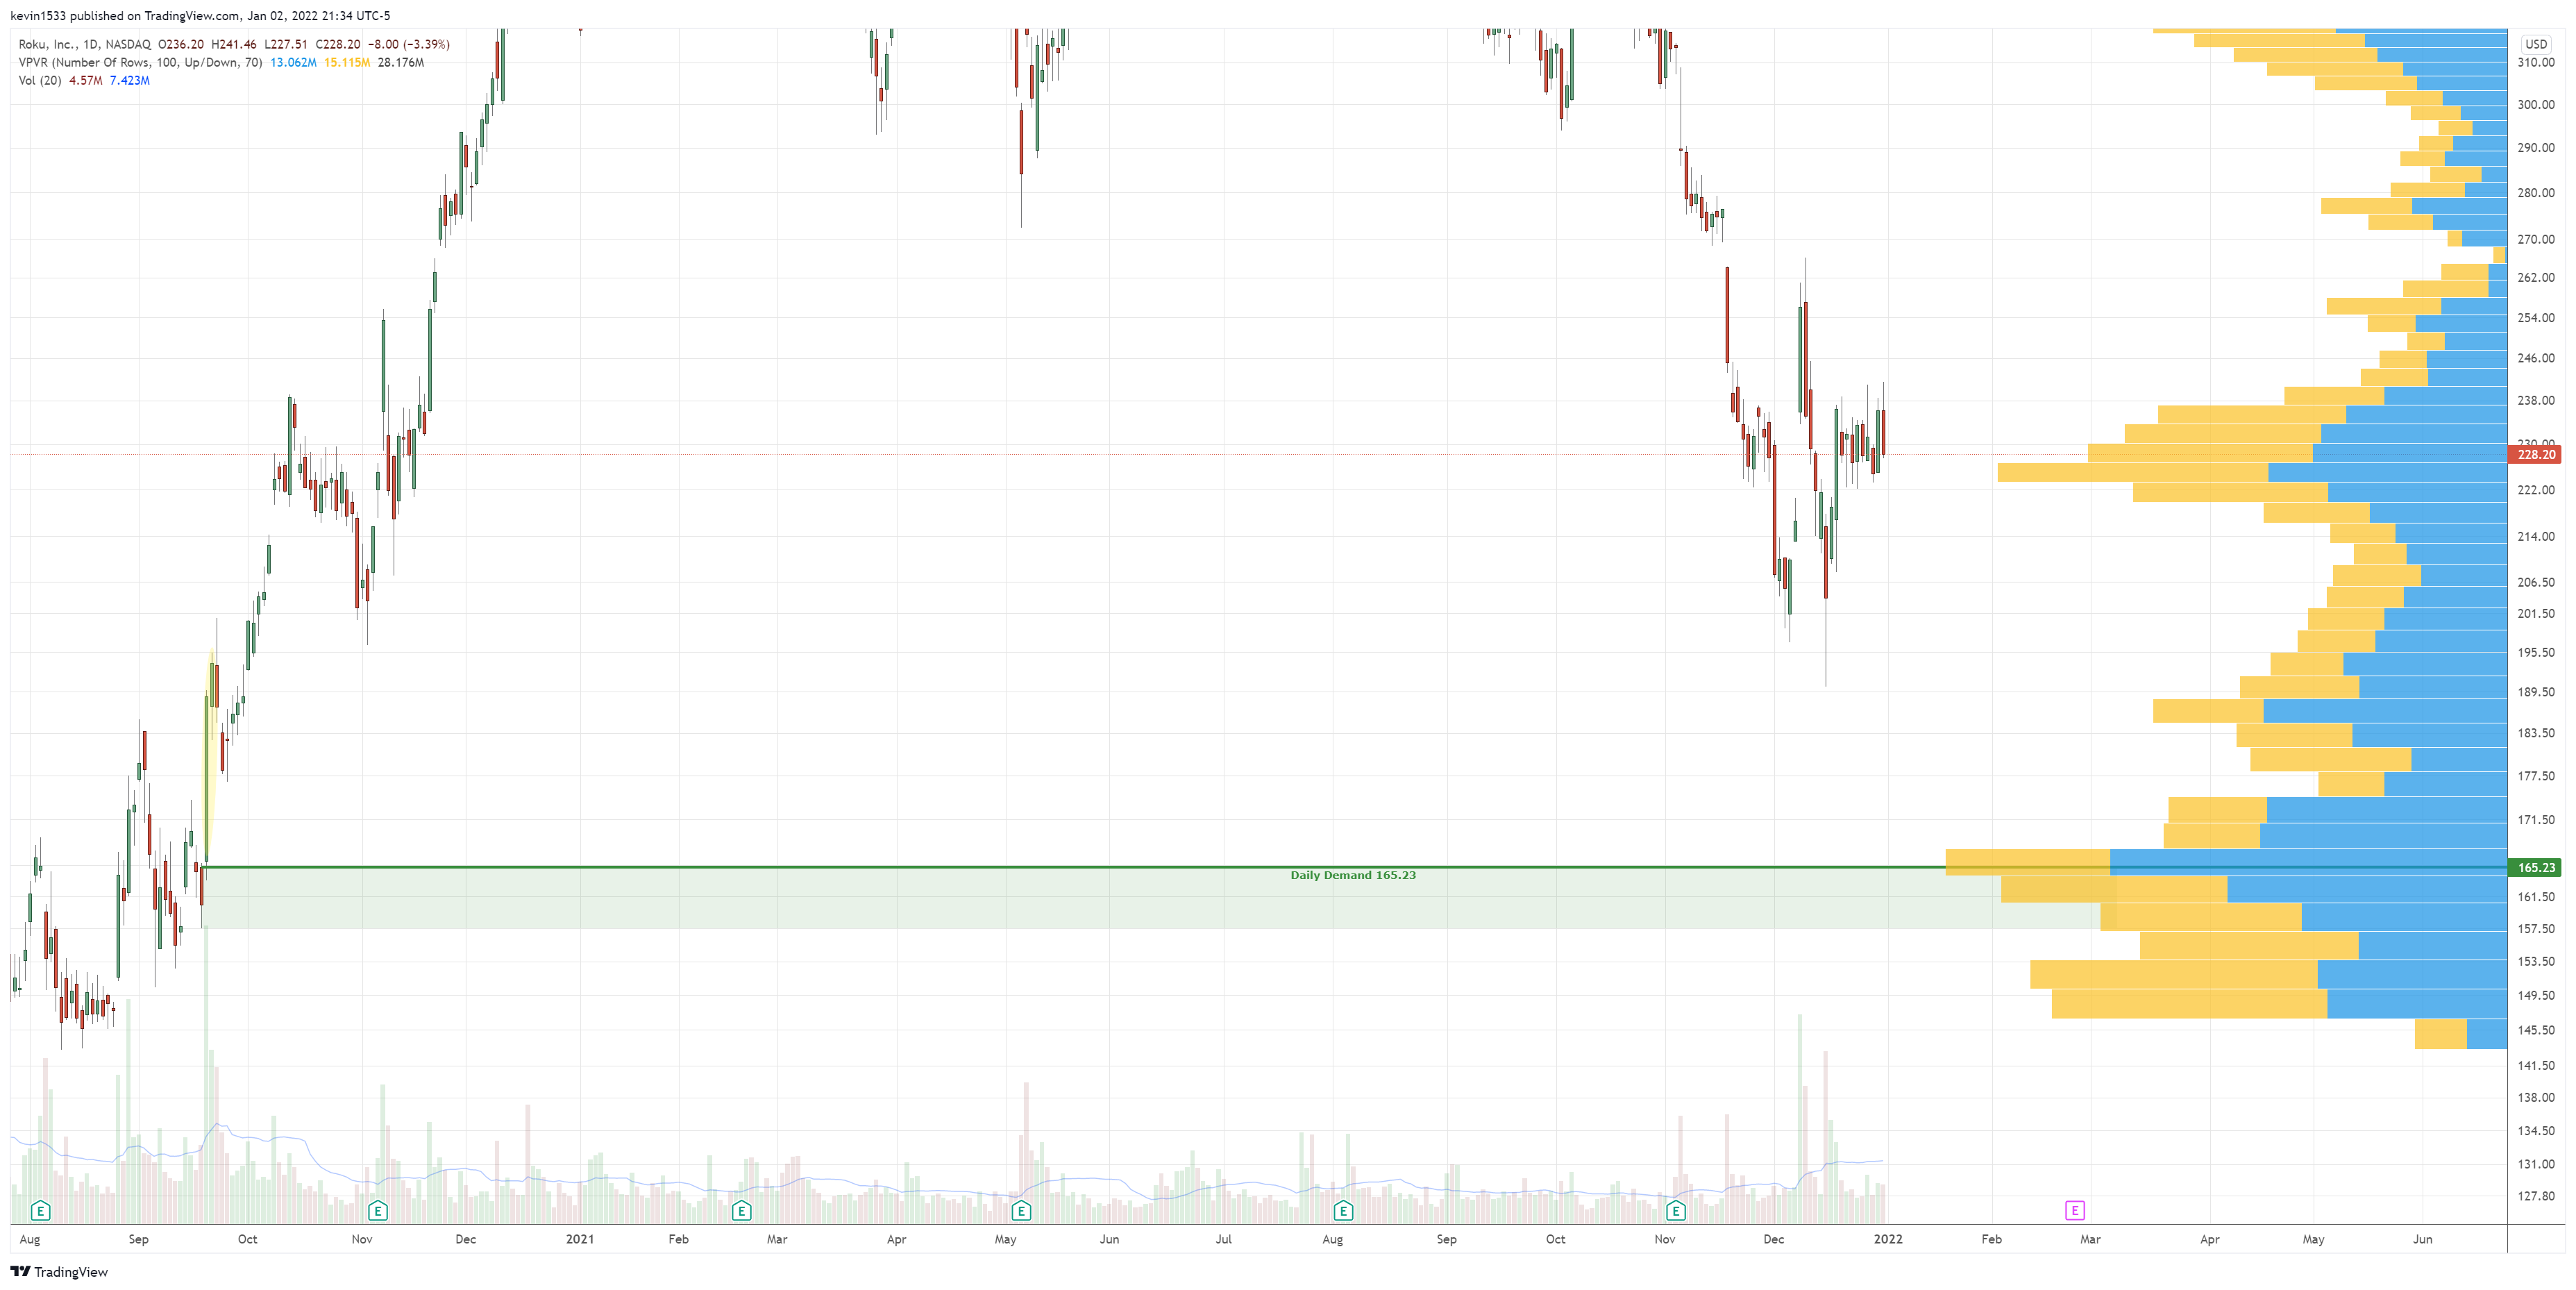
$ROKU (daily) long setup at 165.23
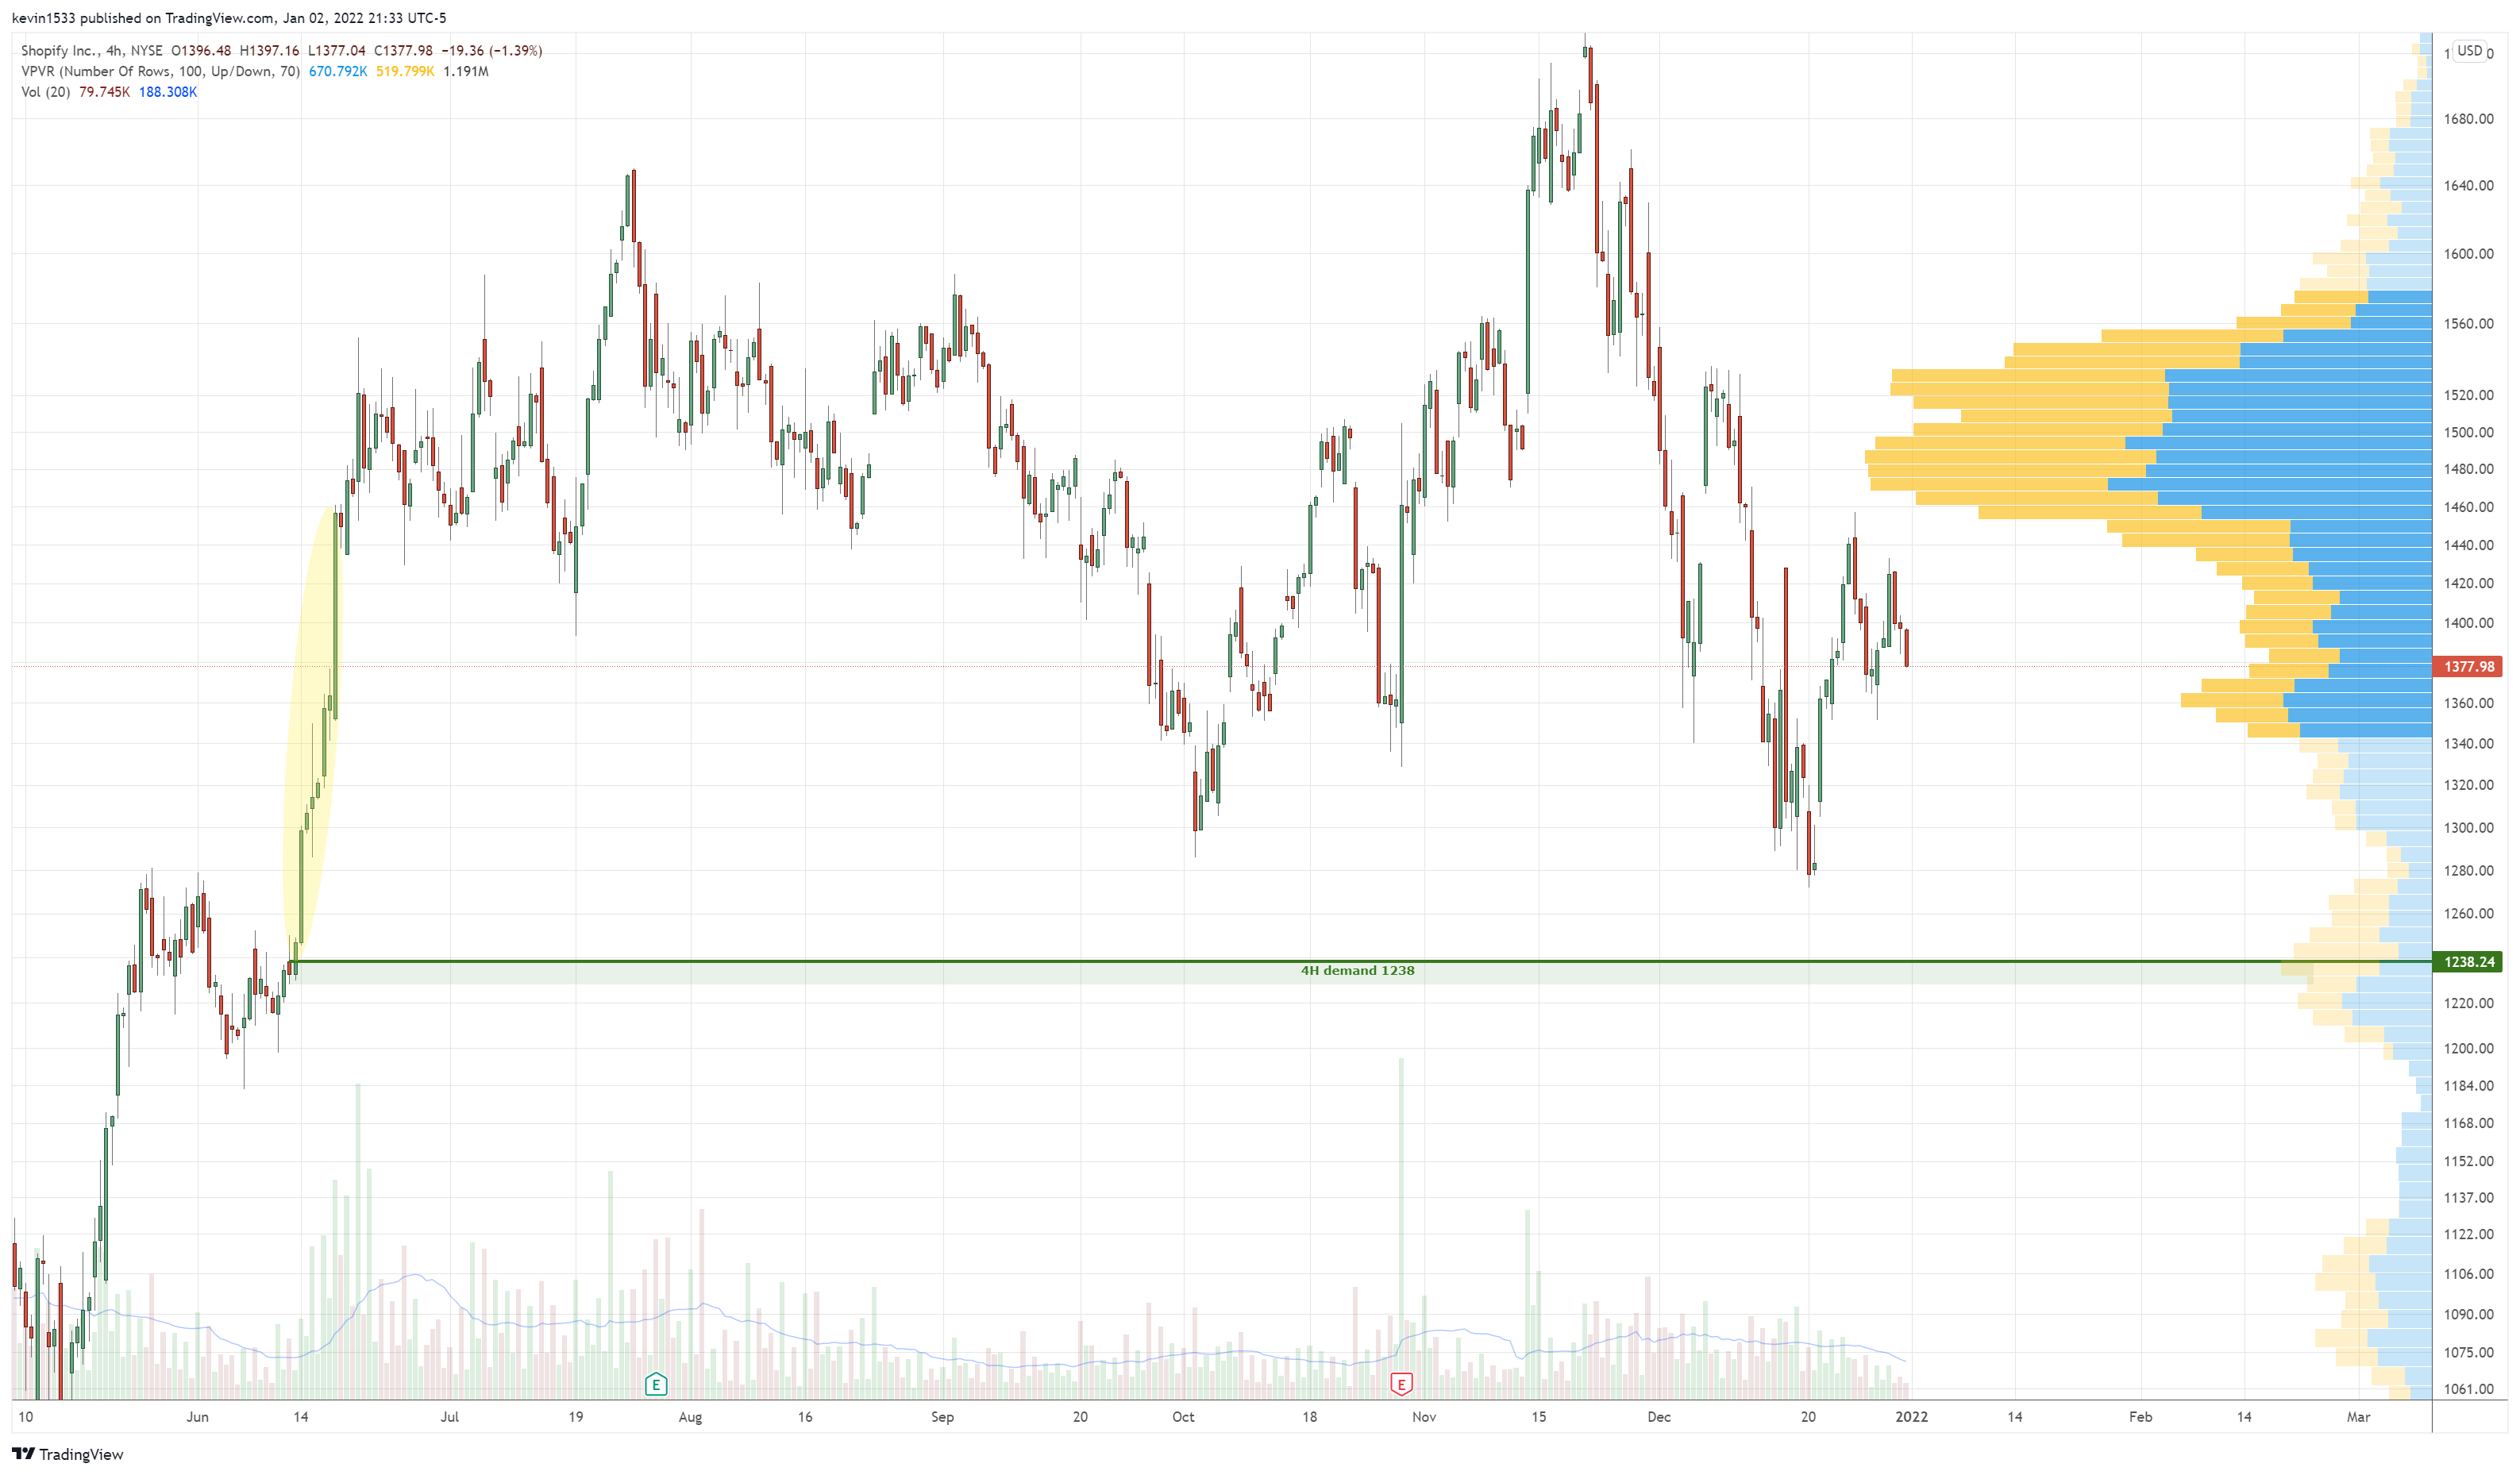
$SHOP (4H) long setup at 1238
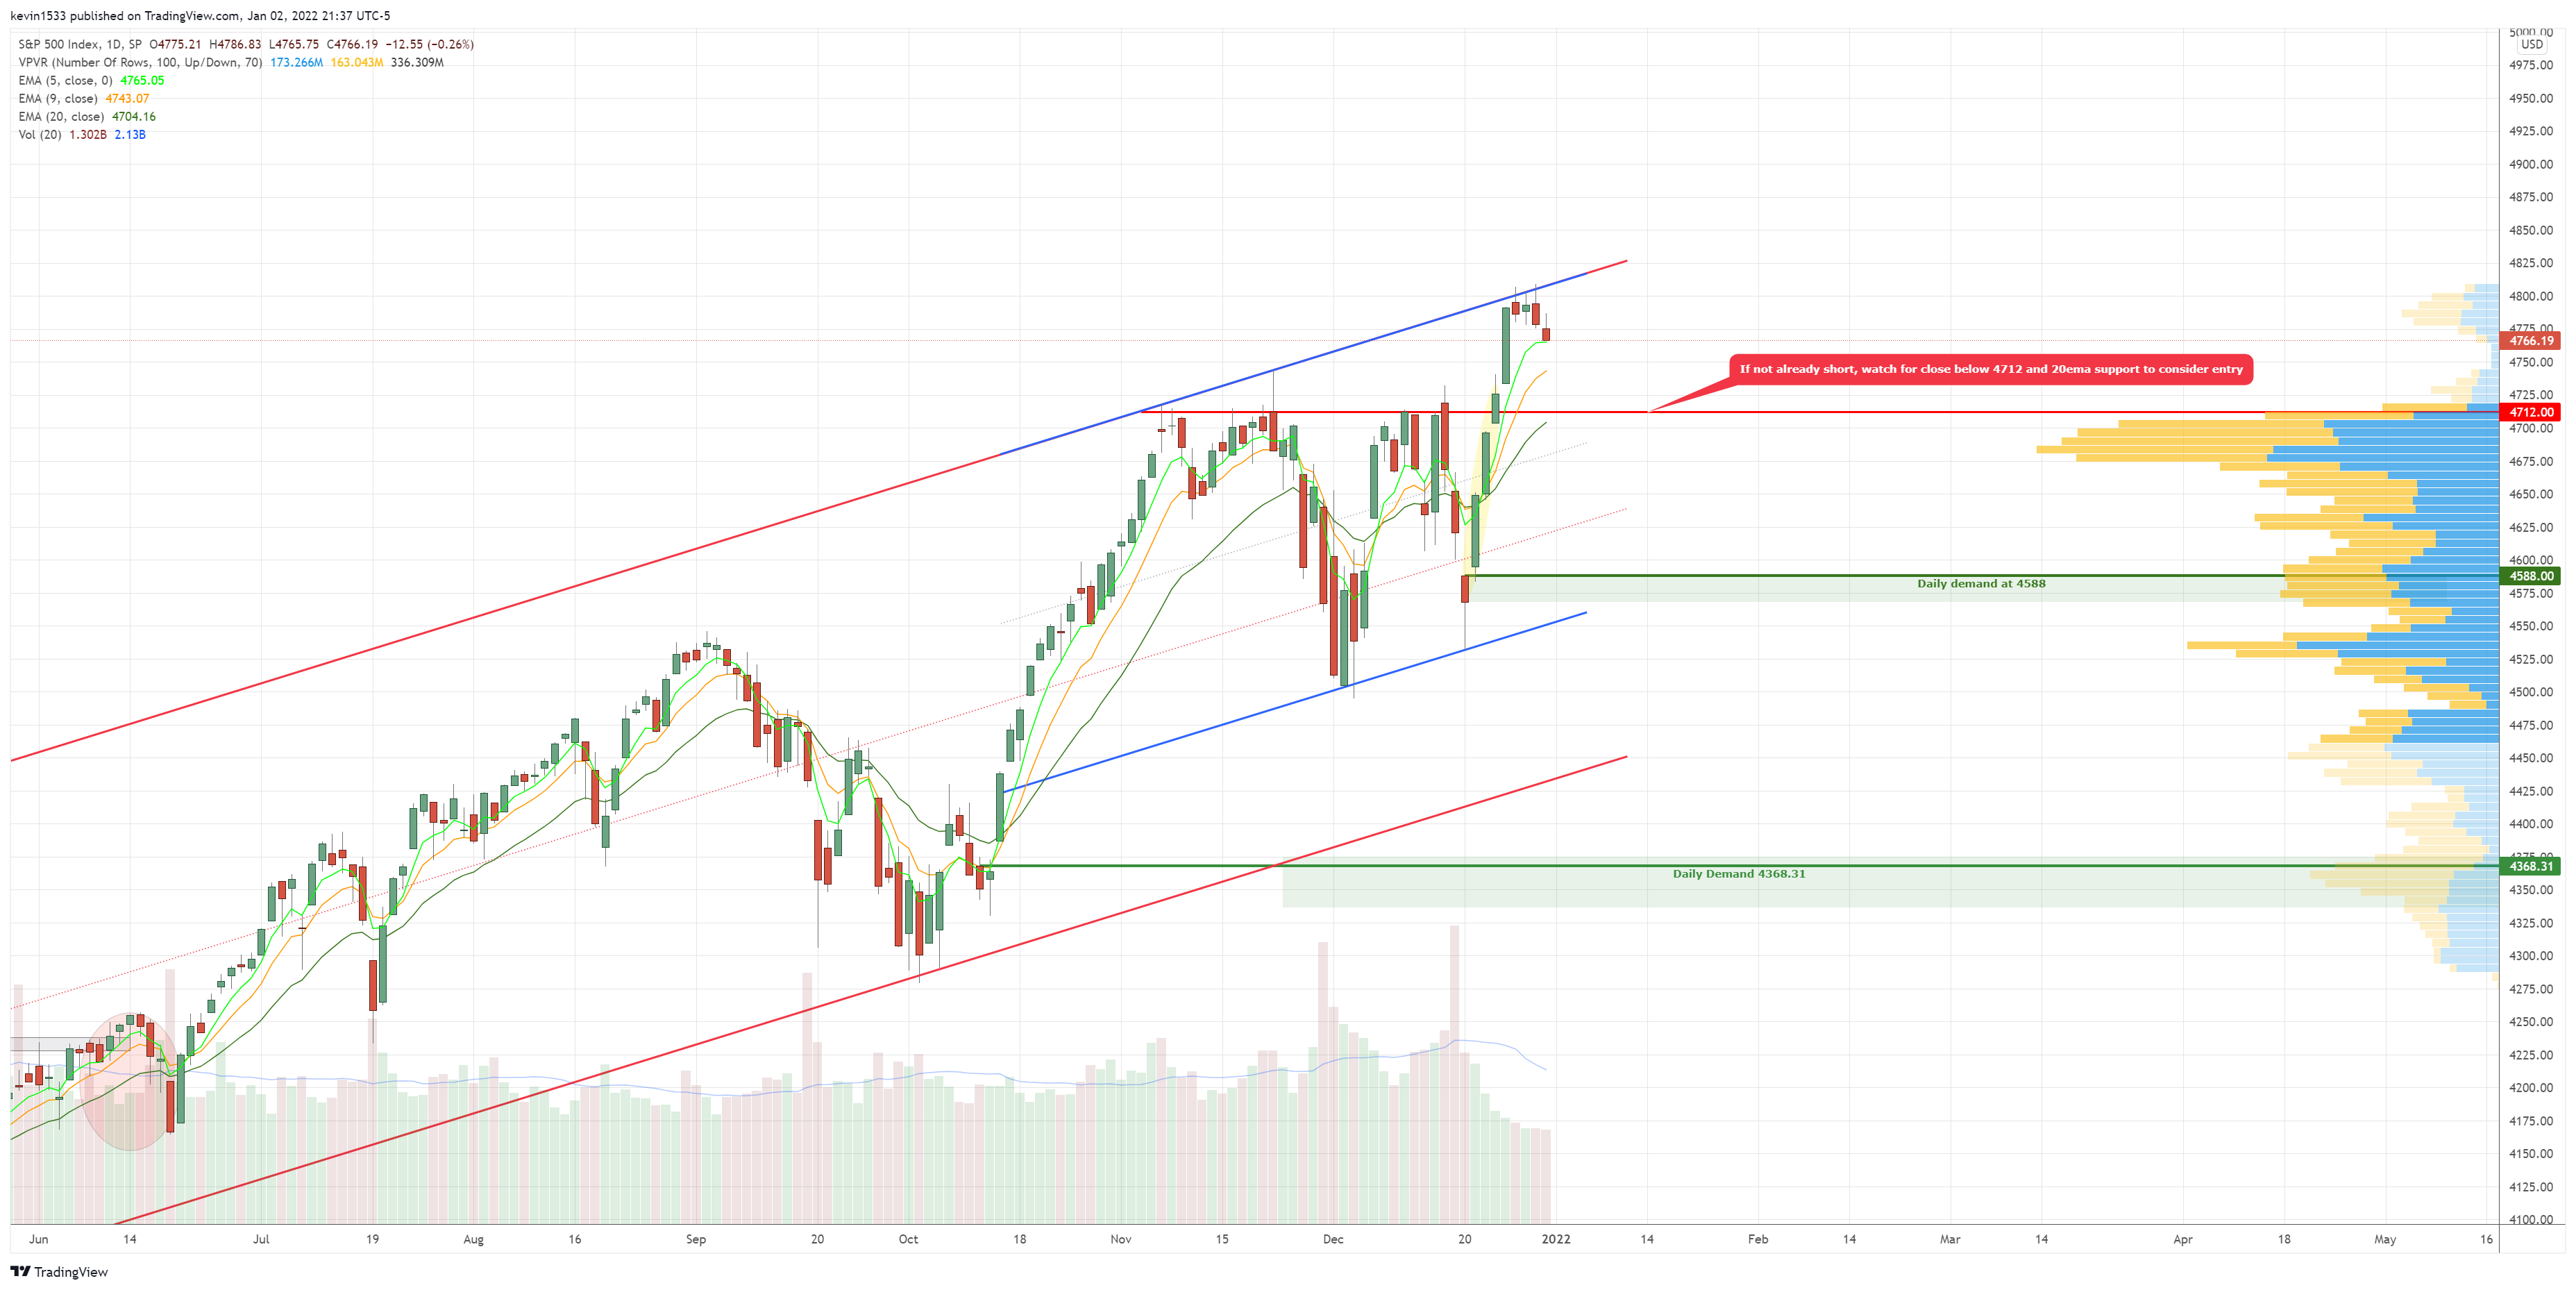
$SPX (daily) long setup at 4588 and 4368.3
$TDOC (daily) long setup at 85.92

$TGT (4h) long setup at 207.20

$TLRY (daily) long setup at 6.29

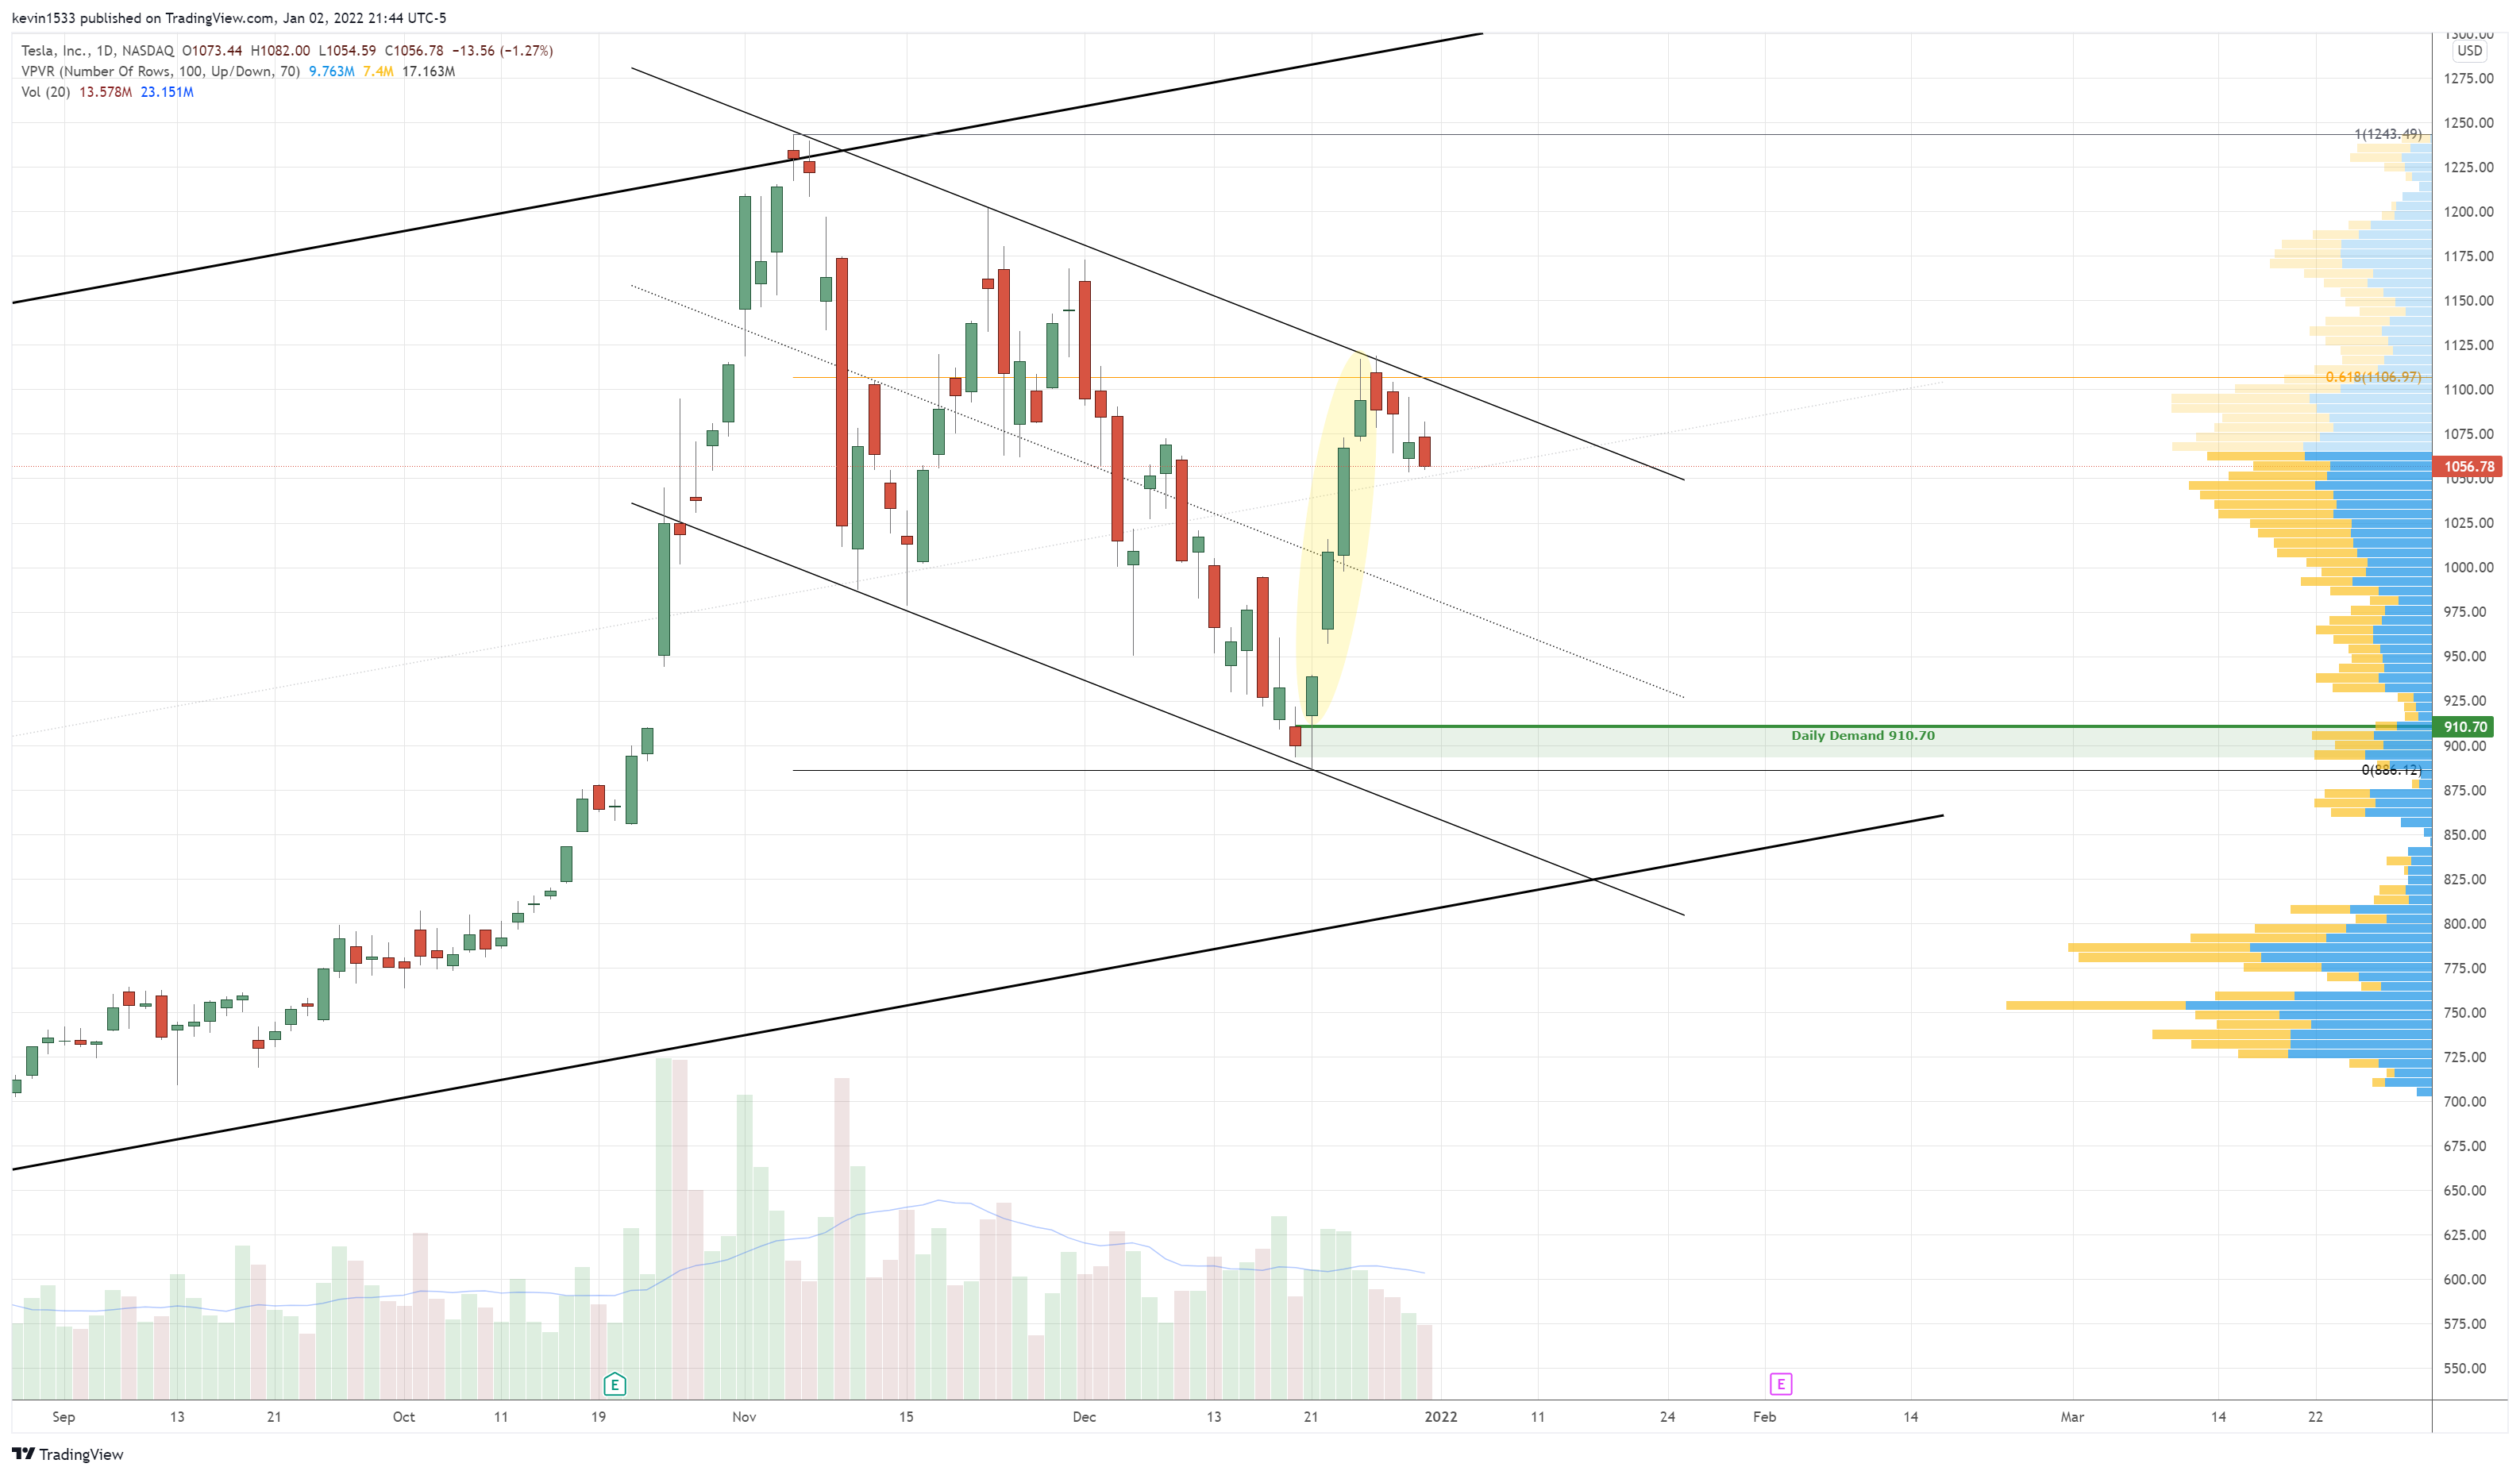
$TSLA (daily) long setup at 910.70
$TTD (daily) long setup at 73 and 61.81

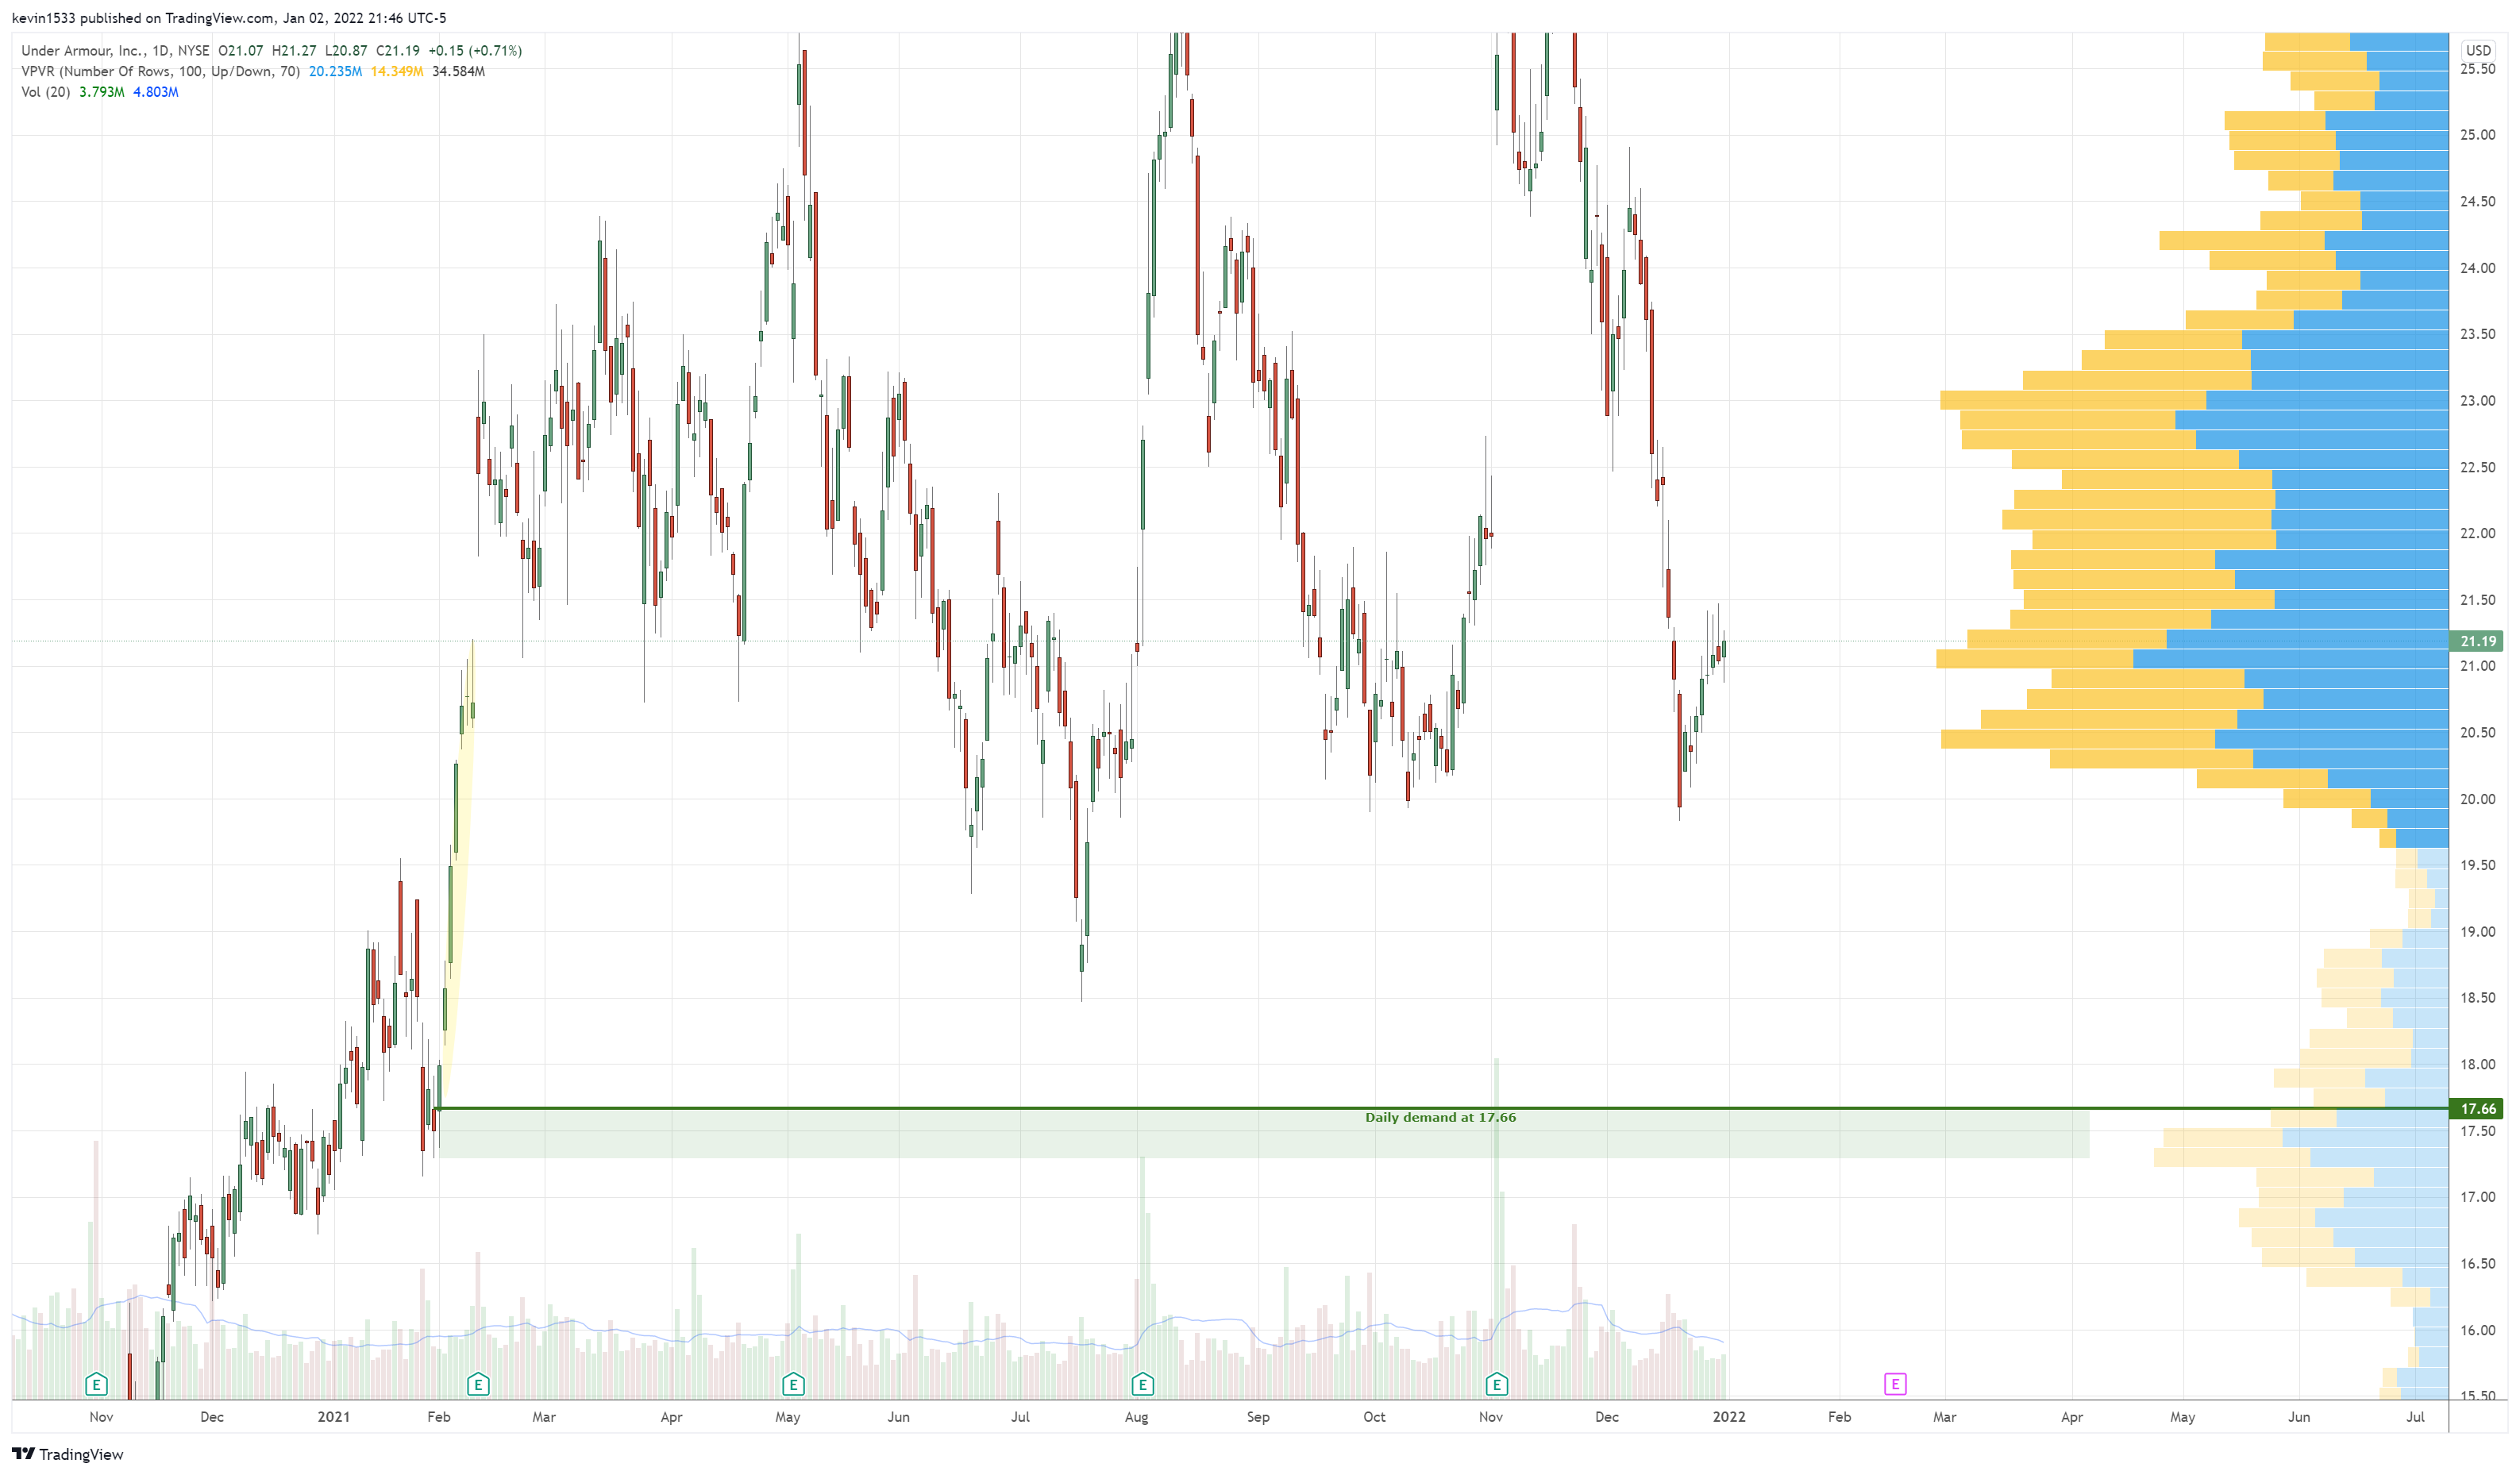
$UAA (daily) long setup at 17.66
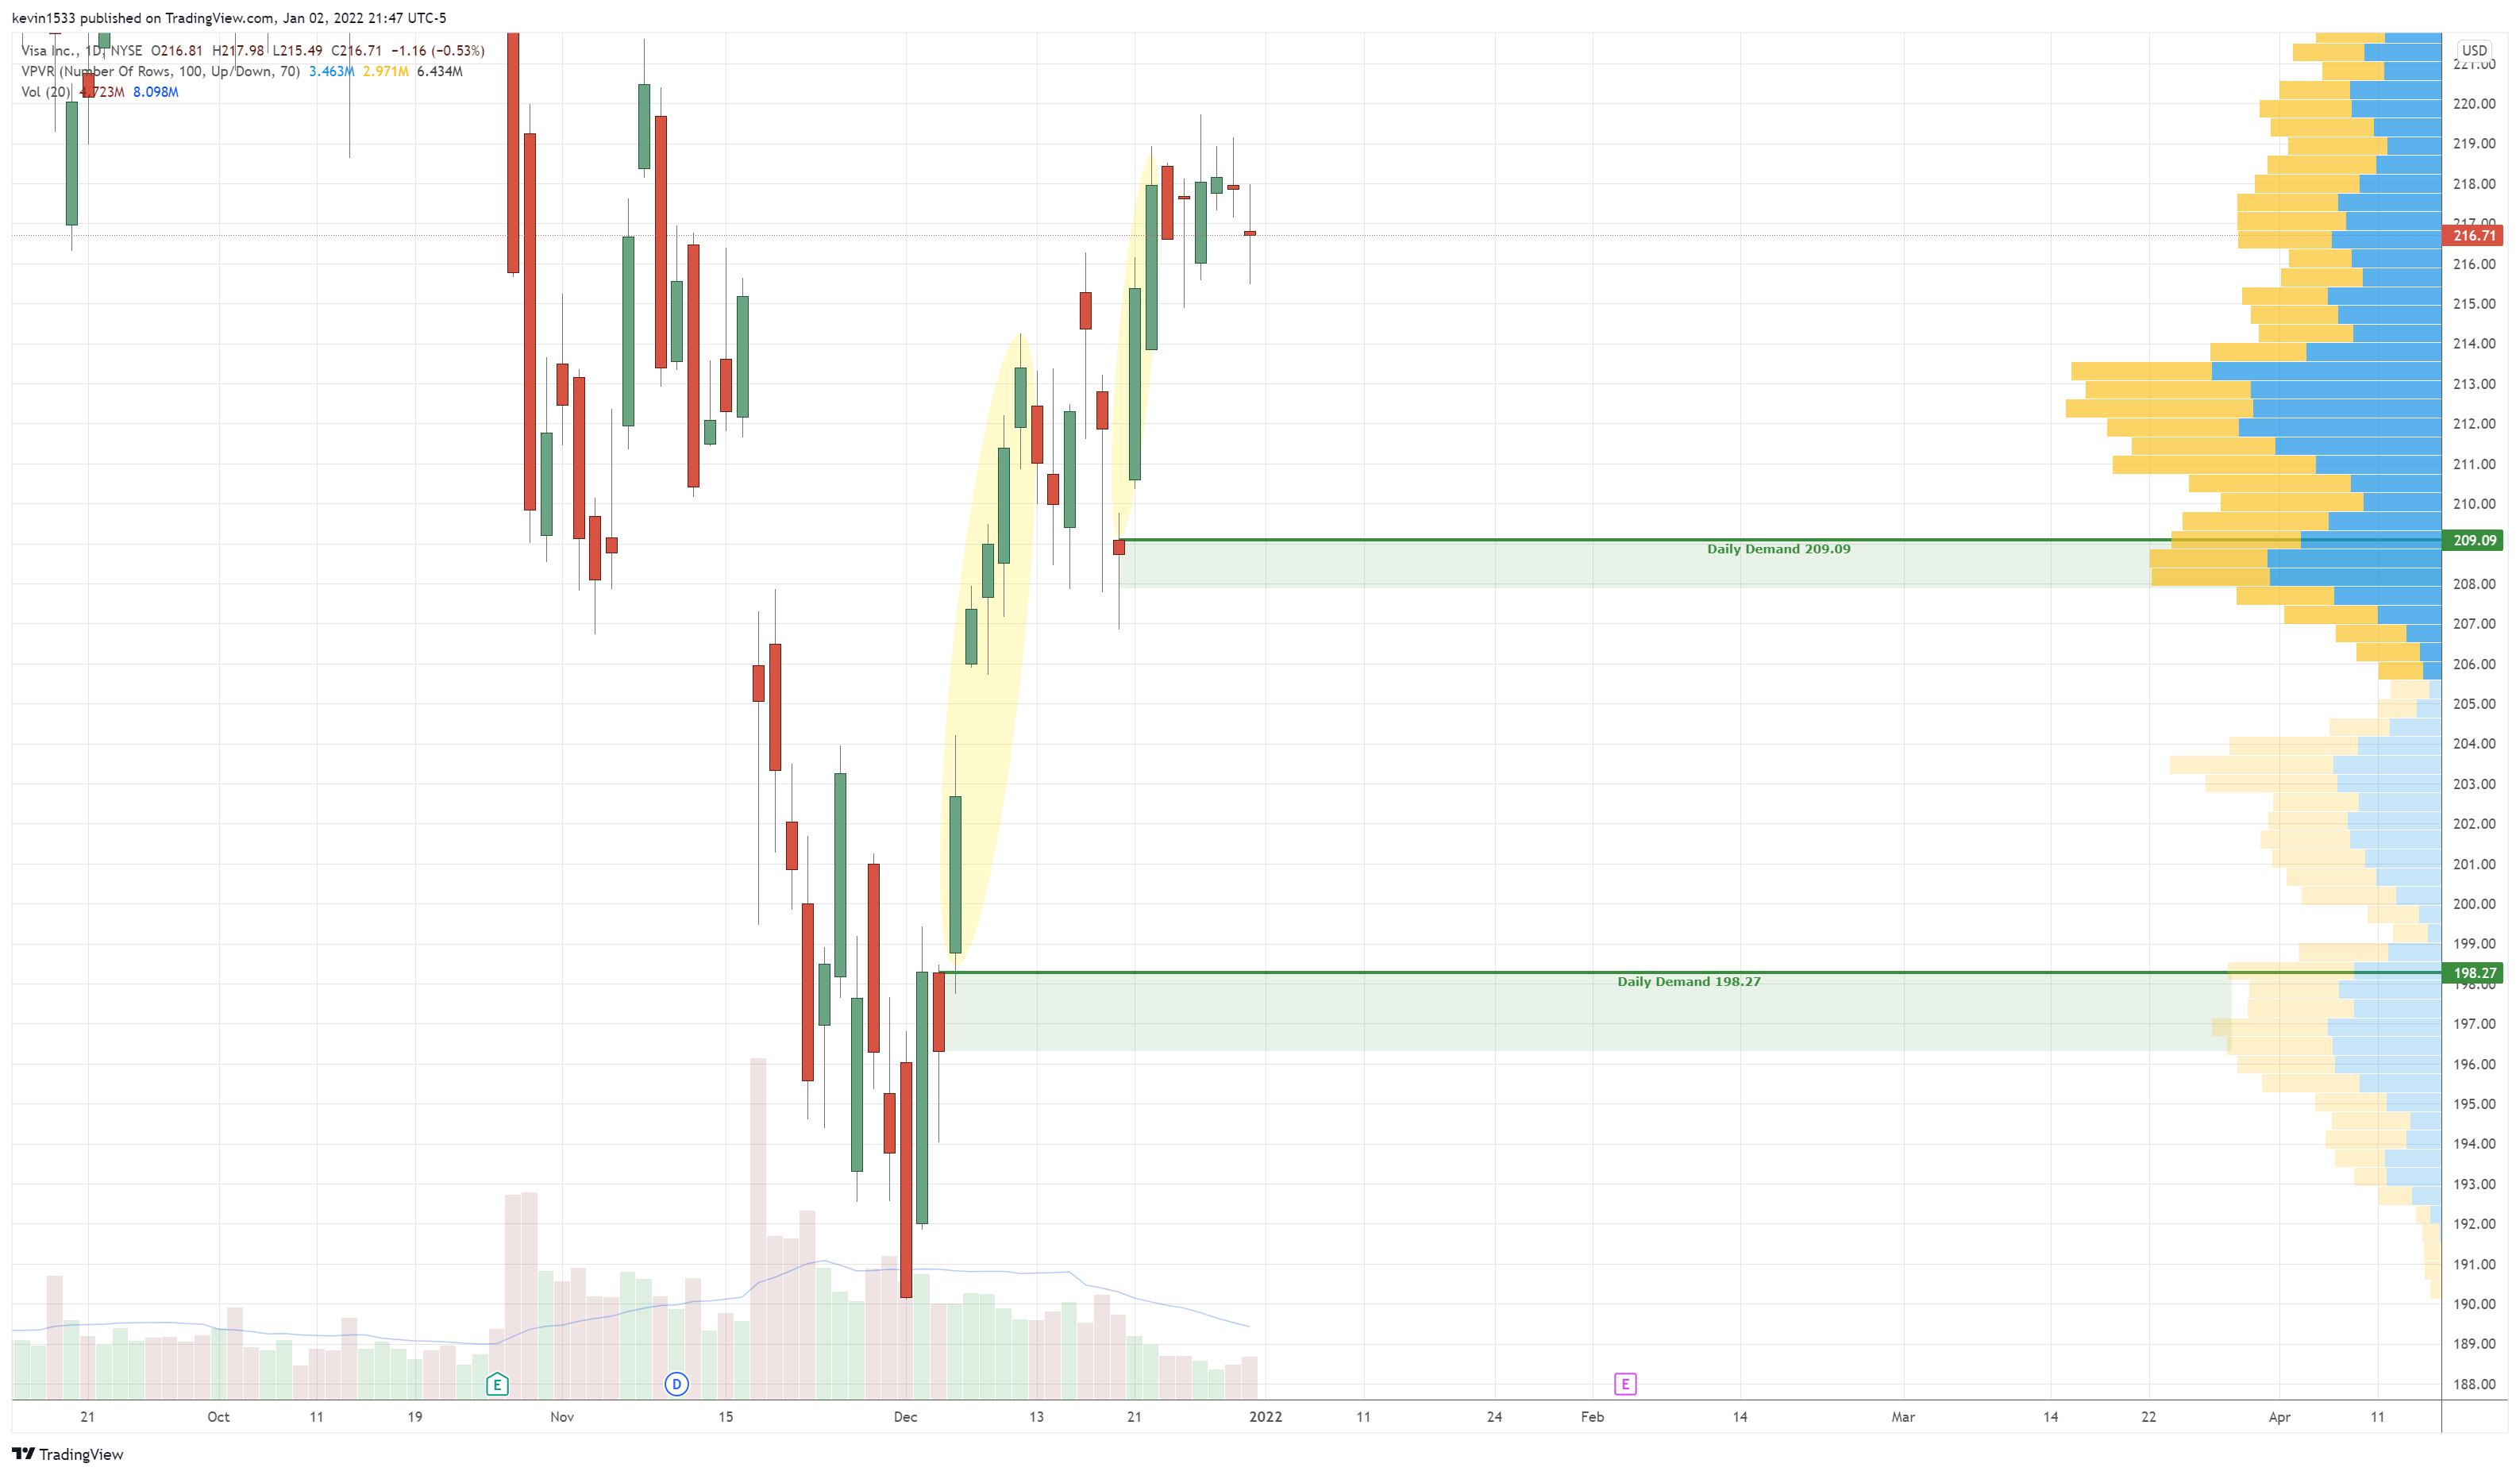
$V (daily) long setup at 209.09 and 198.27
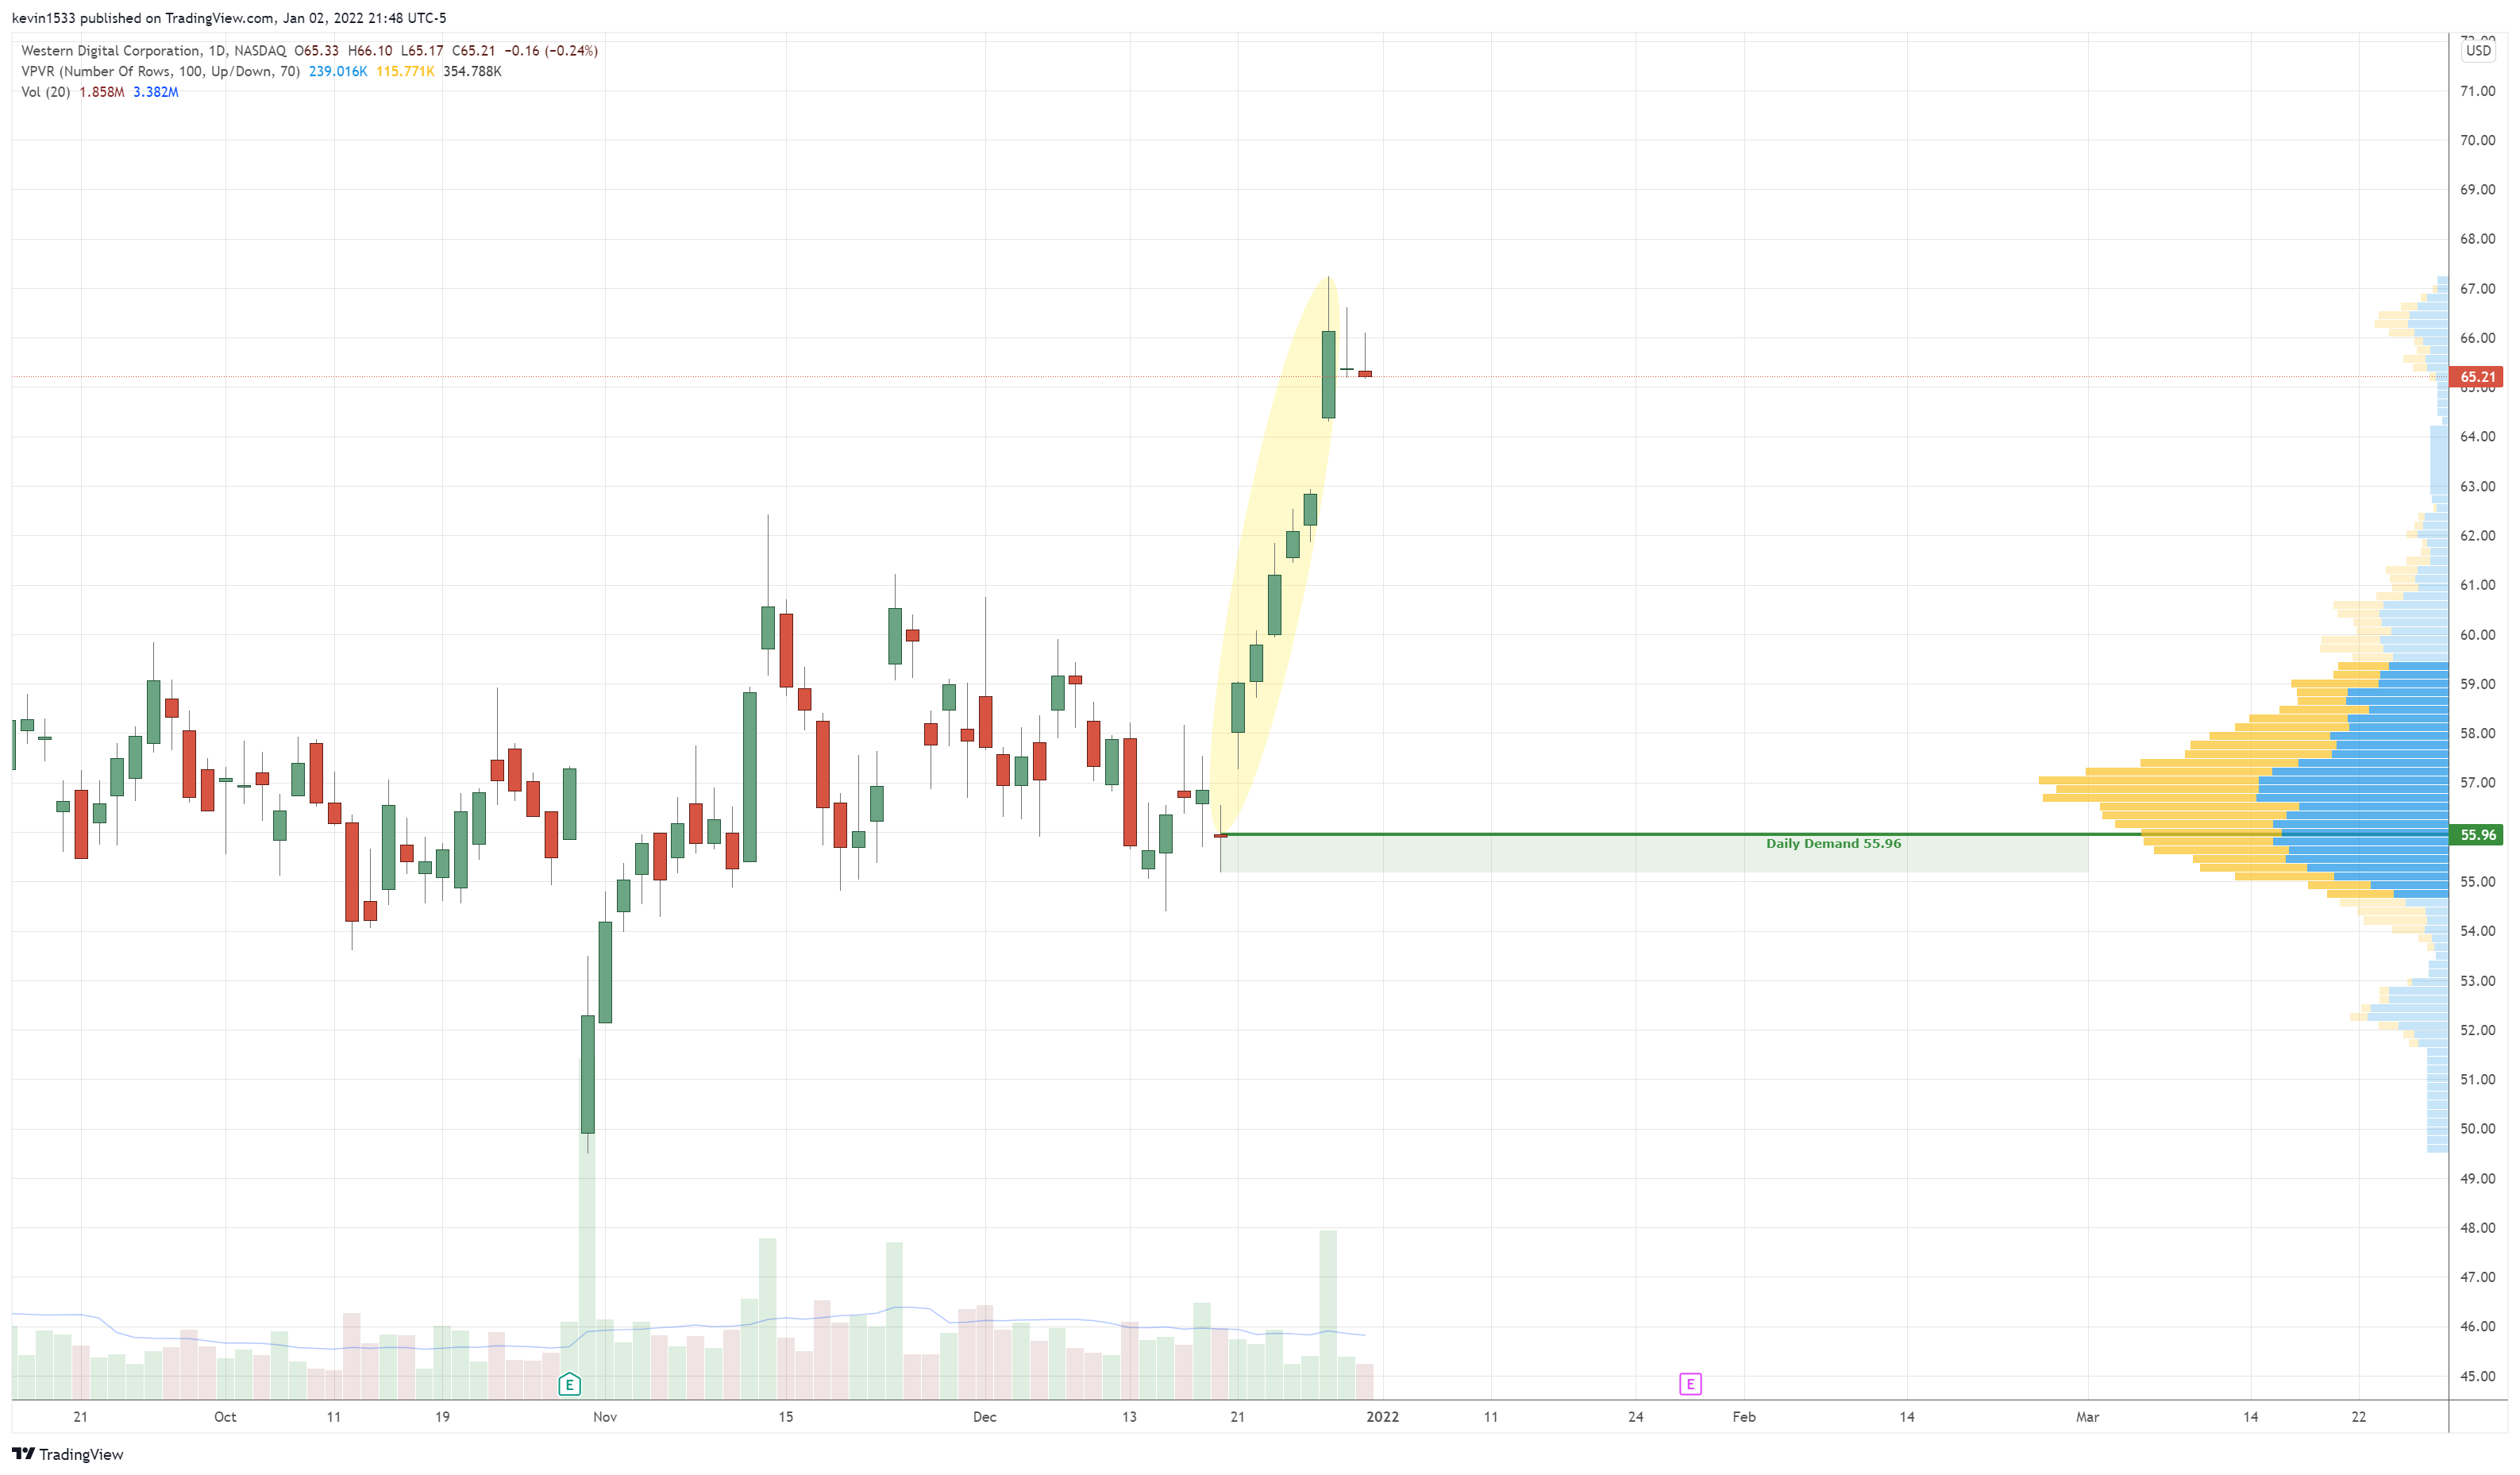
$WDC (daily) long setup at 55.96
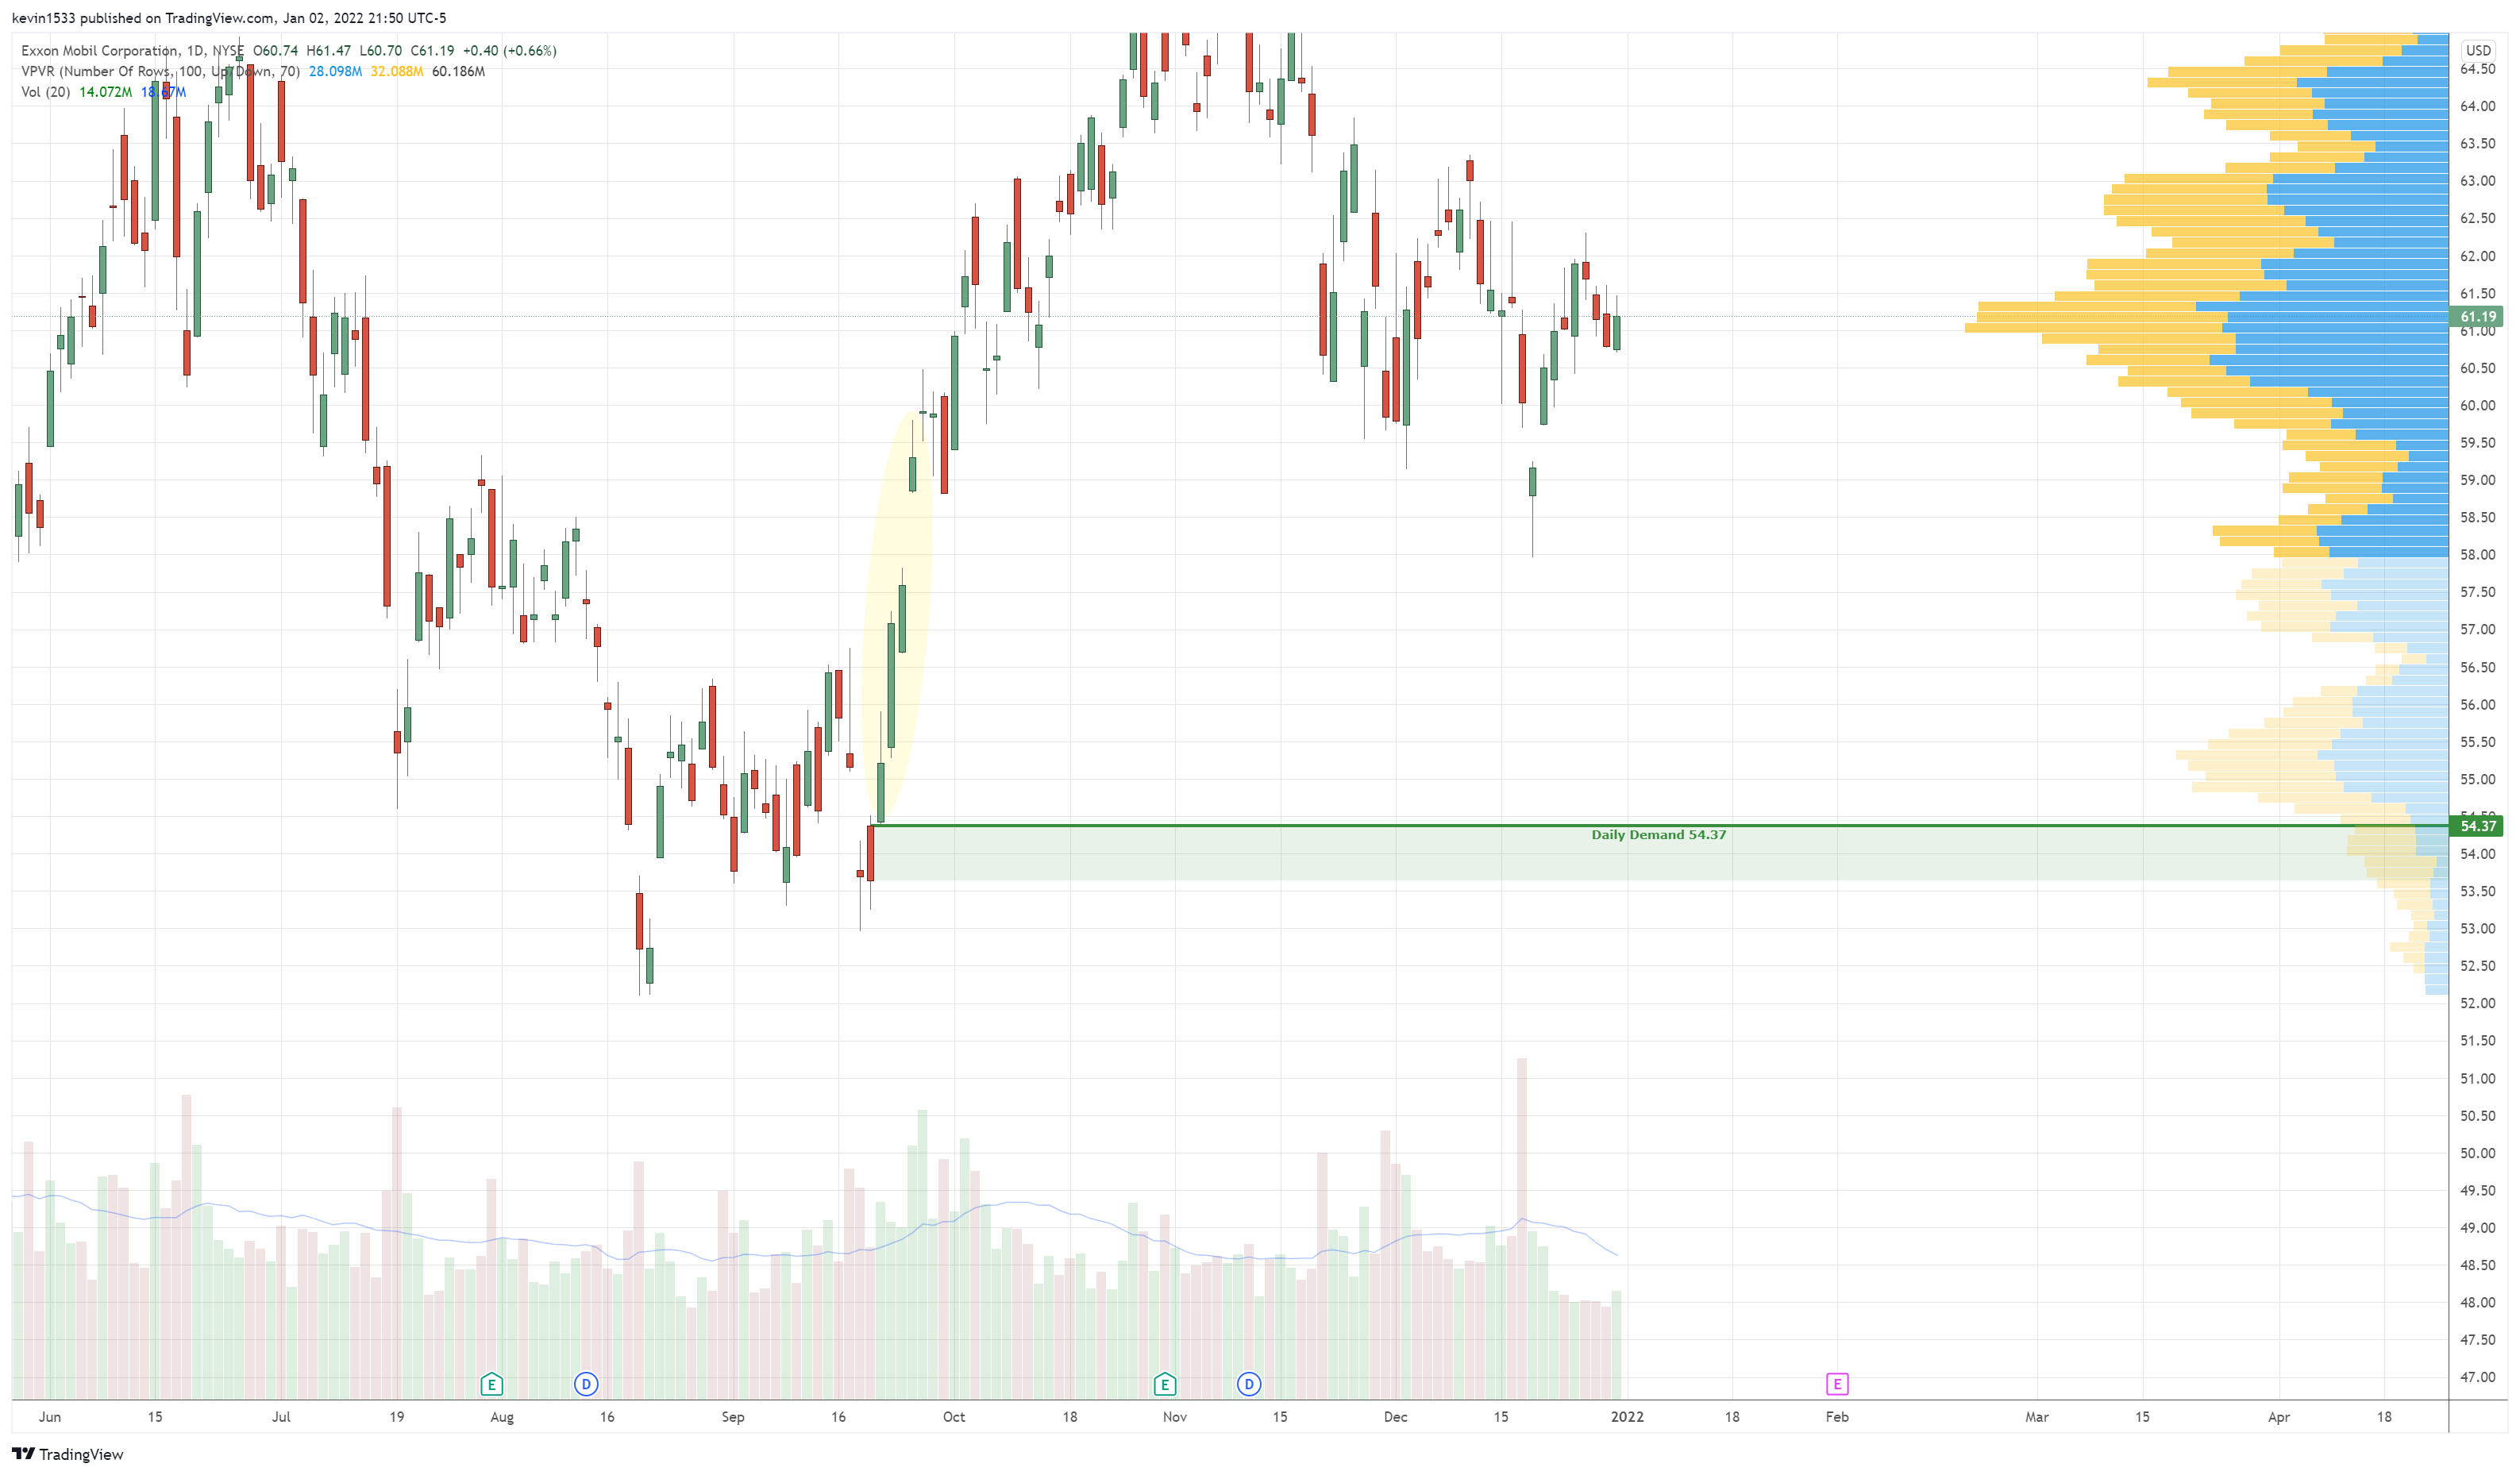
$XOM (daily) long setup at 54.37
$ZM (4H) long setup at 167.14

Thank you & Happy New Year 2022.
I wish the so what was also noted, for eg: “ and inside bar at ATHs at 9year channel resistance with negative RSI divergence”
I am a novice – so would he nice foe KPak to go on and outline the implication eg; This patterns usually leafs lower…
Most people understand what Im implying. I spend over 8 hours on the newsletter. If they dont understand simple terms that I use over and over, you can ask and get with the flow or it takes 5min to look up “inside bar at resistance”?
8 year resistance = obvious big resistance (bearish)
Negative divergence I mention every single day. Its a bearish element.
Its your career. You can choose to complain or just get your edge however you like.
Thanks for this write-up!
I’ve read two of your weekly newsletters and I’ve noticed that you remove some of your long setups even if they don’t trigger to the cent, like BBBY (by the way INCREDIBLE how close that one was–I bought a few shares at 14.46 anyway and it turned out to be the LOD on Friday). Your NIO active setup is also missing from your list–is there a particular reason that these plays are not listed/not valid anymore? I was just wondering because I was looking to open a short position on NIO until I could flip to long on your levels.
if it reacted strong real close to the trigger level, buy orders that may have been waiting at demand may have been filled so I sometimes take those setups off the list as they may not be as reliable. But they can still work, its up to you if you want to leave it in your setup list. Also if a setup is too far away, I may take them off the list for the time being so we have less clutter on the setup list. also just b/c theres a demand doesnt mean u short until u get there. The setup is if and when it gets there its a long, not necessarily have to go down to it.
Thank you Kevin
Would you recommend swing shorts into the daily demand zones?
Make sure you go through the FAQ/Edu section:
Can you short a stock until it reaches the demand level? (or go long until it reaches supply?)
No, the setup is only active once it hits support or demand level. Just b/c there’s a demand level somewhere in a chart, doesnt mean we are headed there right away. You do not want to enter inbetween (in no man’s land) support and resistance and get chopped up. You want to let it hit demand where buy orders are waiting to push price up. Also if you are impatient or lack discipline and enter early due to fomo (there will be times when price misses the trigger and leaves without you – thats ok. You cant catch them all), then you are now stuck with a wide stop if price decides to go down further to test the demand or support level as your stop or invalidation point is below that.